Key takeaways:
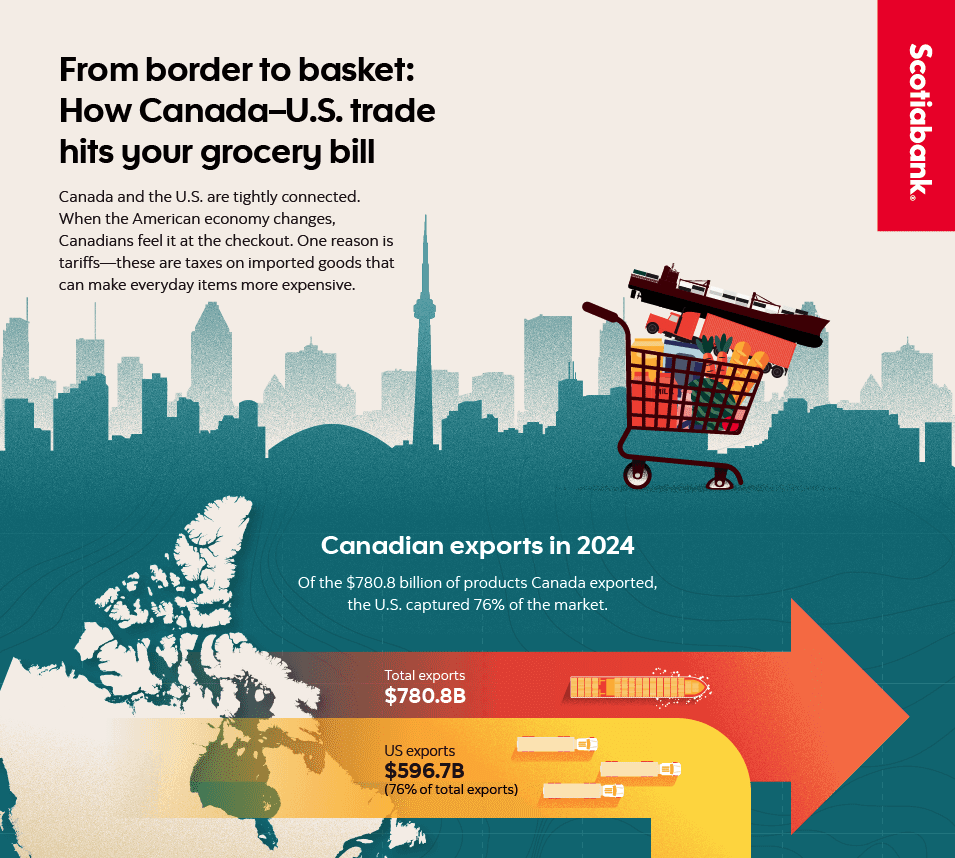
Canada’s economy is deeply connected to the world, but our biggest trade partner is the United States. In 2024, 76% of Canada’s exports went to the U.S., and 49% of our imports came across the southern border.1
Think of it like this: As neighbours, Canada and the U.S. have historically shared both finished products and raw materials. This means that if one neighbour raises prices or charges extra fees for an item, the other neighbor ends up paying more, too.
For instance, two bakeries on either side of the U.S.-Canada border might share egg and flour suppliers, and then also sell their specialty baked goods to each other. If the cost of a shared ingredient rises, they each pay more to produce their baked goods. They raise the cost of the finished product accordingly, so their customers — like you — end up paying more.
Title
Description
Although the U.S. is our top import and export partner, Canada trades heavily with countries around the world. Here’s a detailed look at what we import and where the products we export go.
Top Canadian exports ($780.8 billion in 2024)1
In 2024, Canadian exports amounted to $780.8 billion, with the U.S. being one of the largest players, capturing 76% of the Canadian export market. The tables below show the top Canadian exports and their percentage of total export value.
Top Canadian exports by country in 2024 (top 10)1
Rank |
Trade partner |
Export (billions CAD) |
% of total exports |
1 |
United States |
$596.7 |
76% |
2 |
China |
$29.9 |
3.8% |
3 |
United Kingdom |
$28.3 |
3.6% |
4 |
Japan |
$15 |
1.9% |
5 |
Mexico |
$8.7 |
1.1% |
6 |
South Korea |
$7.6 |
1% |
7 |
Netherlands |
$7.1 |
0.9% |
8 |
Germany |
$6.8 |
0.9% |
9 |
Switzerland |
$6.2 |
0.8% |
10 |
India |
$5.3 |
0.7% |
Canada's top exported products 2024 (top 10)4
HS Code |
Simplified Description |
Value (in millions CAD) |
% of total exports |
270900 |
Crude petroleum oils |
147,272 |
18.9% |
710812 |
Raw gold (non-monetary) |
38,505 |
4.9% |
870323 |
Cars (1,500–3,000 cc engines) |
19,811 |
2.5% |
271019 |
Refined petroleum oils |
14,267 |
1.8% |
270112 |
Bituminous coal |
9,649 |
1.2% |
300490 |
Packaged medicines (misc.) |
8,874 |
1.1% |
880240 |
Large aircraft (>15,000 kg) |
8,545 |
1.1% |
870340 |
Hybrid vehicles (non plug-in) |
8,462 |
1.1% |
271121 |
Natural gas (gaseous) |
8,301 |
1.1% |
100199 |
Wheat (non-durum, not for sowing) |
8,101 |
1.0% |
HS Code is a standardized international system used to classify traded goods for customs, tariffs, and trade statistics.
Note: Percentages are approximations based on available data.
In 2024, the Canadian imports amounted to $765.7 billion dollars, again with the U.S. leading the imports market, representing nearly 50% of total imports.
Canada's top 10 importing countries (2024)1
Rank |
Importing country |
Import value (Billions CAD) |
% of total imports |
1 |
U.S. |
377.0 |
49% |
2 |
China |
88.8 |
12% |
3 |
Mexico |
47.3 |
6.2% |
4 |
Germany |
23.8 |
3.1% |
5 |
Japan |
21.4 |
2.8% |
6 |
South Korea |
16.9 |
2.2% |
7 |
Viet Nam |
14.7 |
1.9% |
8 |
Italy |
12.5 |
1.6% |
9 |
Brazil |
10.2 |
1.3% |
10 |
France |
9.9 |
1.3% |
Canada's top 10 importing countries (2024)1
HS Code |
Simplified Description |
Value (in millions CAD) |
% of total exports |
870323 |
Cars (1,500–3,000 cc engines) |
22,624 |
2.94% |
270900 |
Crude petroleum oils |
20,730 |
2.71% |
271012 |
Light refined petroleum oils |
13,645 |
1.78% |
870431 |
Gas-powered trucks (GVW ≤ 5 tonnes) |
13,172 |
1.72% |
710812 |
Raw gold (non-monetary) |
12,925 |
1.69% |
300490 |
Packaged medicines (misc.) |
11,468 |
1.50% |
870380 |
Electric vehicles (fully electric) |
10,385 |
1.35% |
870324 |
Cars (>3,000 cc engines) |
9,509 |
1.25% |
851713 |
Smartphones |
9,462 |
1.24% |
271019 |
Refined petroleum oils |
8,023 |
1.05% |
HS Code is a standardized international system used to classify traded goods for customs, tariffs, and trade statistics.
Note: Percentages are approximations based on available data.
As you can see from the tables above, the U.S. plays a significant role in Canada's trade activities, both as a primary importer of Canadian goods and as a major exporter to Canada. Understanding this and other relationships is crucial for comprehending the dynamics of Canada's economy and its dependency on specific trade partners.
Trade isn’t just about finished products — it’s also about parts and raw materials that cross the border multiple times during the production process before turning into something we buy.
Examples of this back-and-forth trade:

Car Parts
Car parts made in Canada might be sent to the U.S. for processing, then back to Canada for additional assembly, then shipped to the U.S. for final vehicle production, and then returned to Canada as a finished car. On average, a vehicle or its parts crosses the Canada-U.S. border up to eight times2 before it’s sold.

Wheat
Wheat grown in Canada might be exported to the U.S. to be milled into flour, then sent back to Canada to be mixed with other ingredients, shipped to the U.S. again for further processing, and finally returned to Canada as packaged bread or cookies. Depending on the product, flour-based foods can cross the border three to five times before reaching store shelves.2

Crude oil
Crude oil extracted in Canada is often sent to the U.S. for refining, then shipped back to Canada as gasoline or other petroleum products. Some refined products are then sent back to the U.S. for further processing before returning to Canada for consumer use. Crude oil and refined petroleum products can cross the border up to four times2 before Canadians purchase them at gas stations.
If extra costs — like tariffs — are added each time a product crosses the border during production, the final product costs more for Canadians.
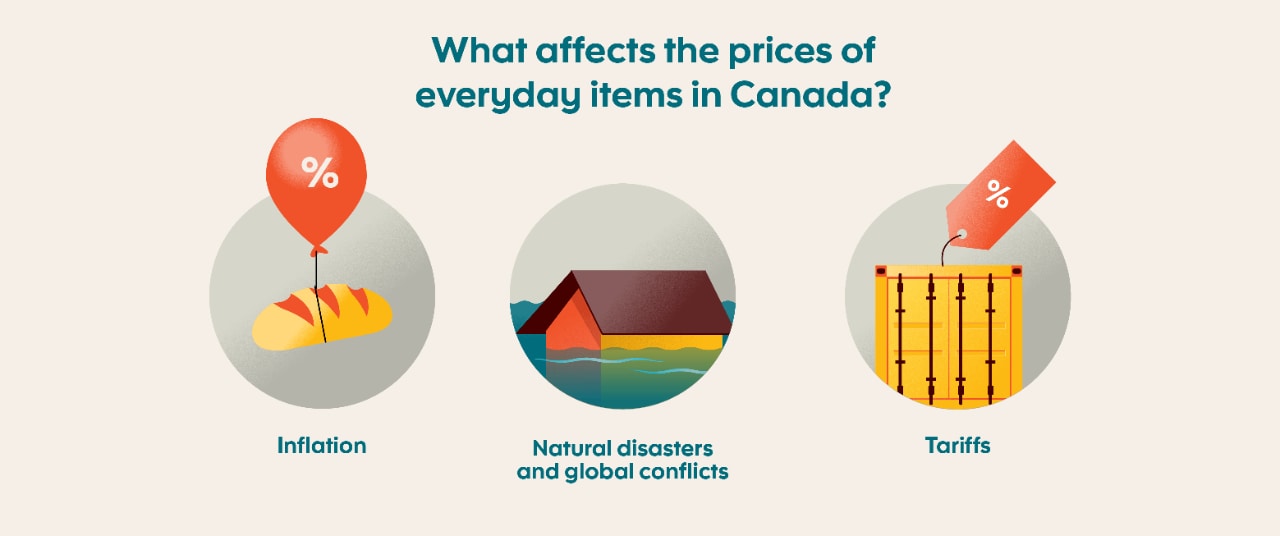
1. Tariffs: A tax that increases prices
A tariff is a tax on imported goods. If the U.S. or Canada adds tariffs, businesses pay extra fees to import products. They often pass these costs onto consumers, who end up with higher grocery bills, pricier electronics and more expensive cars.
2. Inflation: When everything gets more expensive
Inflation happens when prices rise over time, making goods and services more expensive. This can be caused by:
- Higher production costs (like energy and labor)
- Supply chain disruptions (COVID-19, natural disasters, wars)
- Increased demand (when too many people want the same product)
For example, a rise in grocery store prices impacts more than your dough. The cost of making a pizza went up dramatically in 20223 due to an increase in the cost of ingredients:
- Flour: +23.2%
- Cheese: +9.9%
- Vegetables: +11%
3. Natural disasters and global conflicts
Events like droughts, floods and conflicts in major exporting countries affect supply chains, also driving up costs. For example:
- Droughts in California have impacted the price of fruits and vegetables imported to Canada.
- Wars affecting oil-producing countries have caused gas prices to rise.
- Supply chain disruptions (like the 2021 typhoon in Malaysia) led to a worldwide semiconductor shortage.4


Tariff news has been fast and, at times, furious. Here are some key dates for what’s transpired this year:
- April 3 — The U.S. introduces a 25% tariff on Canadian imports. However, goods that meet USMCA rules (like sufficient North American content) are partially exempt.5
- April 9 — Canada responds with 25% retaliatory tariffs on U.S. vehicles that don’t meet USMCA standards, and on non-Canadian/Mexican content in otherwise compliant goods.6
- April 15 — Canada introduces a temporary 6-month exemption (until October 2025) for essential goods — including some food ingredients — to help ease the impact.7
- August 1 — The U.S. raises tariffs to 35% on non-USMCA imports from Canada and adds a 40% penalty for transshipped goods.8

When it comes to tariffs, they impact large-scale trade along with affect everyday grocery items. When multiple ingredients cross the border before a product is made, tariffs stack up, leading to higher grocery prices for Canadian consumers.
For illustrative purposes, let’s look at a box of cookies and a car to show the impact tariffs have on what goes into them and their final cost.
How the cookie crumbles**
Tariffs aren’t just trade policy. They can even affect the cost of a chocolate chip cookie in Canada. Let’s break down how recent tariff changes between Canada and the U.S. could impact what you pay at the checkout.
On the road again: Cookie ingredient border crossings
A simple box of cookies can have ingredients that cross the Canada-U.S. border multiple times before reaching store shelves. The table below shows how many times certain cookie ingredients could cross the border before you can enjoy the treat.
Ingredient |
Approx. # crossings |
Countries involved |
Reason for crossing |
Flour |
2 |
Canada → U.S. → Canada |
Milling or bleaching (U.S.), returned for packaging |
Sugar |
2 |
Canada → U.S. → Canada |
Refining (U.S.), returned for local baking |
Chocolate chips |
3 |
Mexico → U.S. → Mexico/Canada |
Tempering (U.S.), coating (Mexico), added to dough in Canada |
Nuts (almonds) |
2 |
U.S. → Mexico → Canada |
Roasting/cutting in Mexico, then used in Canada |
Butter/dairy |
2 |
Canada → U.S. → Canada |
Pasteurization (U.S.), returned for baking |
How much could a chocolate chip cookie cost under tariff rules?
Let’s turn those well-travelled ingredients into a box of 12 premium chocolate chip cookies typically sold in Canada for $5 to see what happens to that price if tariffs are applied under a few rules.
Some things to keep in mind:
- Ingredients make up about 35% of the retail price, or $1.75.
- Around half of those ingredients — chocolate chips, sugar, dairy and nuts — are vulnerable to U.S. cross-border tariffs.
- Tariffs only apply to the exposed portion.
Example: Decadent Chocolate Chip Cookies
Scenario 1: USMCA-compliant (what we have now)9 |
Scenario 2: 25% tariff on non-compliant U.S. ingredients5,10 | Scenario 3: 35% tariff (non-USMCA goods)8,10 |
|
|
|
Estimated retail price (CAD) |
||
$5 |
$5.25–$5.49 |
$5.40–$5.75 |
As you can see, even small tariffs on ingredients can ripple through to the final price of everyday products. Depending on how ingredients are sourced and how exposed they are to cross-border tariffs, the retail price of a single cookie could rise by 10 to 20%.10
While Canada has introduced temporary exemptions for essential goods to help soften the blow, the long-term impact will depend on how trade tensions evolve.7

Car manufacturing is highly dependent on cross-border supply chains — vehicles and their parts can cross the border as many as eight times before final assembly. Below is a table showing how car parts move through the manufacturing stage before the whole vehicle is assembled and ready to be sold.
Car part |
Approximate crossings |
Countries involved |
Reason (manufacturing stage) |
Engine block |
4 |
Mexico → U.S. → Canada → U.S. |
Casting (MX), machining (US), assembly (CA), QC/testing (US) |
Transmission |
3 |
U.S. → Mexico → U.S. |
Calibration (US), assembly (MX), integration/testing (US) |
Crankshaft |
4 |
U.S. → Canada → U.S. → Canada |
Forging (US), rough machining (CA), polishing (US), assembly (CA) |
Dashboard electronics |
5 |
Asia → U.S. → Mexico → U.S. → Canada |
Import (Asia), firmware install (US), casing (MX), QC (US), install (CA) |
Seats |
2 |
Mexico → U.S. → Canada |
Fabric cutting (MX), cushioning & stitching (US), vehicle install (CA) |
NOTE: As of July 2025, auto parts compliant with CUSMA are exempt from tariffs between the United States and Canada. This example is purely illustrative. We will continue to monitor the situation and update this source in a timely manner to reflect the latest developments.
Current auto industry tariff exception explained
For now, vehicles that meet USMCA requirements aren’t hit with the full 25% tariff when crossing into the U.S.
Here’s how that works:
- If a car is assembled in Canada, the U.S. or Mexico and meets the USMCA rules of origin11 (at least 75% North American content and certain labor standards), it’s mostly in the clear.
- Only vehicle parts that originate outside of North America are subject to tariffs.
- Automakers (OEMs) can use USMCA documentation to prove compliance and minimize tariff exposure.

But what if the exemption disappears?
Let’s imagine a scenario where the USMCA exemption doesn’t apply and a 25% tariff is slapped on every cross-border movement for a vehicle currently priced at $45,000:
- If 67% of its parts cross into the U.S. (roughly, $30,000 worth), that portion could be taxed each time. Engines, transmissions and body panels contribute the highest tariff costs because of how many times they cross the border.
- By some estimates,10 this could add between $5,800 and $7,500 to the final price — which would mean a 13 to 17% increase.12
That’s a big jump — and a strong reason why USMCA compliance matters.
Canadians can’t control global events, but we can take steps to minimize costs. Below are some steps you can take to lower the effect on your wallet — and don’t worry, they aren’t the usual suggestions to skip your morning latte.
1. Shop local and try to opt for Canadian products when possible
- Buying locally produced foods helps avoid tariffs on imported goods. And since these items travel less, you’re also getting the freshest possible produce.
- Supporting Canadian businesses keeps money in the economy and reduces our dependence on imports.

2. Take advantage of credit card perks
- Getting cash rewards, such as with the Scotia Momentum® Visa* Card, makes shopping for groceries and other essentials more rewarding. Study the perks and use them to your advantage.
- Collecting points on everyday purchases, like Scotiabank's cards offering Scene+™ rewards, can really add up. (If you’re curious about how much you could earn with rewards credit cards, take a look at Scotiabank's credit card rewards calculator.)

3. Buy in bulk and look for deals
- Buying in bulk can help offset price hikes, especially for non-perishables like pasta, rice and canned goods. When certain items, like milk, are bought in bulk, it can add up to some nice savings. For example, a $5 per week milk run will add up to a $240 per year savings — and that’s just one item on your shopping list.
- Using coupons and shopping sales lets you stock up on essentials at lower prices.

4. Reduce food waste and if you’re into it, grow your own food
- Growing vegetables and herbs at home can be a great way to cut grocery costs. If you lack space or a greenish thumb, shop farmers markets or purchase a CSA subscription direct from a farm near you. There are plenty of options available across Canada (especially if you’re in Quebec).
- Freezing or preserving, if you have the time and skill, allows you to use excess food later.

5. Consider transportation costs
- Gas prices fluctuate, so if you can, carpool or take public transit when possible.
- Seeking out fuel-efficient vehicles can save money over the life a car.
Understanding how Canada and the U.S. are economically tied can help you — and all Canadians — make wise financial decisions. While we can’t control tariffs, inflation or global crises, we can adjust our shopping and spending habits to protect our wallets.
By staying informed and adapting strategies you could try to manage the impact of rising prices.
Legal Disclaimer: This article is provided for information purposes only. It is not to be relied upon as financial, tax or investment advice or guarantees about the future, nor should it be considered a recommendation to buy or sell. Information contained in this article, including information relating to interest rates, market conditions, tax rules, and other investment factors are subject to change without notice and The Bank of Nova Scotia is not responsible to update this information. All third party sources are believed to be accurate and reliable as of the date of publication and The Bank of Nova Scotia does not guarantee its accuracy or reliability. Readers should consult their own professional advisor for specific financial, investment and/or tax advice tailored to their needs to ensure that individual circumstances are considered properly and action is taken based on the latest available information.
**This example is provided for illustrative purposes only and does not reflect current or actual tariff policies between the United States and Canada. It is not intended to represent real-world pricing or trade conditions and should not be interpreted as financial or legal advice.
1 Statistics Canada, The International Trade Explorer 2024, https://www150.statcan.gc.ca/n1/pub/71-607-x/71-607-x2019005-eng.html
2 Government of Canada, Minister of Small Business, Export Promotion and International Trade appearance before the Standing Committee on International Trade (CIIT) - Canada–United States relationship and its impacts on the electric vehicle, softwood lumber and other sectors, https://www.international.gc.ca/transparency-transparence/briefing-documents-information/parliamentary-committee-comite-parlementaire/2022-02-07-ciit.aspx?lang=eng
3 Statistics Canada, Behind the Numbers: What’s Causing Growth in Food Prices, https://www150.statcan.gc.ca/n1/pub/62f0014m/62f0014m2022014-eng.html
4 Z2Data, Why Natural Disasters Are Going to Roil Supply Chains Over the Next Decade, https://www.z2data.com/insights/why-natural-disasters-are-going-to-roil-supply-chains?_gl=1*19rdrpi*_up*MQ..*_ga*NTM4MTE4MzIzLjE3NTQ0MTIwMjI.*_ga_G08VPNMJWL*czE3NTQ0MTIwMjEkbzEkZzAkdDE3NTQ0MTIwMjEkajYwJGwwJGgxNTk5NzE1ODMy (May 2024)
5 The White House, Presidential Actions, Adjusting Imports of Automobiles and Automobile Parts into the United States, https://www.whitehouse.gov/presidential-actions/2025/03/adjusting-imports-of-automobiles-and-autombile-parts-into-the-united-states/
6 Department of Finance Canada, List of vehicle products from the United States subject to 25 per cent tariffs effective April 9, 2025, https://www.canada.ca/en/department-finance/news/2025/04/list-of-vehicle-products-from-the-united-states-subject-to-25-per-cent-tariffs-effective-april-9-2025.html
7 Department of Finance Canada, Canada announces new support for businesses affected by U.S. tariffs, https://www.canada.ca/en/department-finance/news/2025/04/canada-announces-new-support-for-canadian-businesses-affected-by-us-tariffs.html
8 The White House, Fact Sheet: President Donald J. Trump Amends Duties to Address the Flow of Illicit Drugs Across our Northern Border, https://www.whitehouse.gov/fact-sheets/2025/07/fact-sheet-president-donald-j-trump-amends-duties-to-address-the-flow-of-illicit-drugs-across-our-northern-border/#:~:text=ADDRESSING%20A%20NATIONAL%20EMERGENCY%3A%20Today,effect%20on%20August%201%2C%202025.
9 The Federal Reserve System, Trade Compliance at What Cost? Lessons from USMCA Automotive Trade, https://www.federalreserve.gov/econres/notes/feds-notes/trade-compliance-at-what-cost-lessons-from-usmca-automotive-trade-20250718.html
10 Brookings, The impact of US tariffs on North American Auto Manufacturing and implications for USMCA, https://www.brookings.edu/articles/the-impact-of-us-tariffs-on-north-american-auto-manufacturing-and-implications-for-usmca/
11 Government of Canada, Understanding CUSMA Compliance, https://www.tradecommissioner.gc.ca/en/market-industry-info/search-country-region/country/canada-united-states-export/us-tariffs/understanding-cusma-compliance.html
12 Center for Strategic and International Studies (CSIS), The Stacking Effect of the Trump Administration's Auto Tariffs, https://www.csis.org/analysis/stacking-effect-trump-administrations-auto-tariffs
* Visa Int. / Licensed User
® Registered Trademark of The Bank of Nova Scotia
™ Scene+ and the Icon Design are trademarks of Scene Plus IP Corporation, used under license.
