Next Week's Risk Dashboard
- Markets on edge as governments and central banks collide
- Italians head to the polls…
- …as the next potential market shock
- Should Canada’s bond market be an anomaly?
- Eurozone CPI could be another doozie
- Canada’s economy is softening in Q3…
- …but consumers are doing better than portrayed
- Fed’s preferred inflation gauge to follow CPI
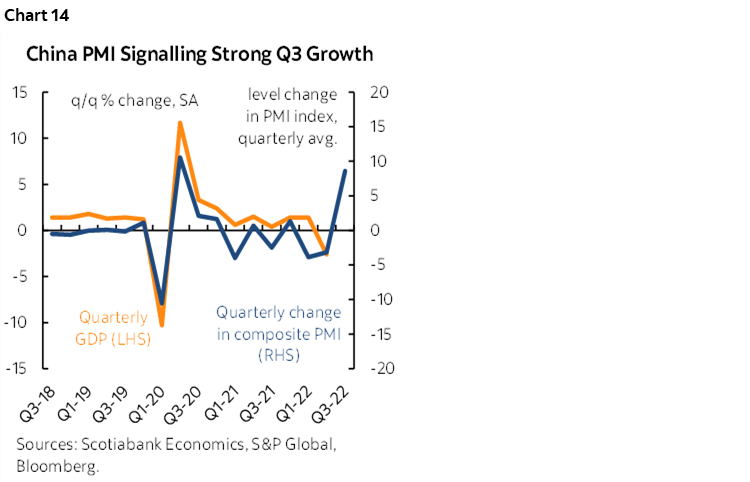
- China PMIs could indicate firmer Q3 growth
- Banxico: Following the Fed, sort of
- BanRep: Another big hike coming
- RBI might deliver a big hike to counter a softer rupee
- BoT to hike again as inflation surges
Chart of the Week
Clearly bond markets are on edge and when they’re angry, all asset classes suffer as we’ve seen this past week. Competition between monetary policy tightening and fiscal policy easing is roiling markets and has been demonstrated in each of the US, UK and Canada. Governments are getting stern warnings from financial markets about the risks surrounding their policy actions as the politics and economics of battling inflation are at a still nascent stage of development. Next it may be Italy’s turn to upset the apple cart as Italians head to the polls this week. An outlier to all of this has been Canada’s bond market, which has recently outperformed others on debatable grounds as explored in this issue. A significant line-up of regional central bank decisions and global macro releases also lies ahead.
ITALY’S ELECTION COULD CHALLENGE EUROPEAN UNITY
This is no time to be adding to concerns over European unity and fiscal policy. Enter Italy’s turn!
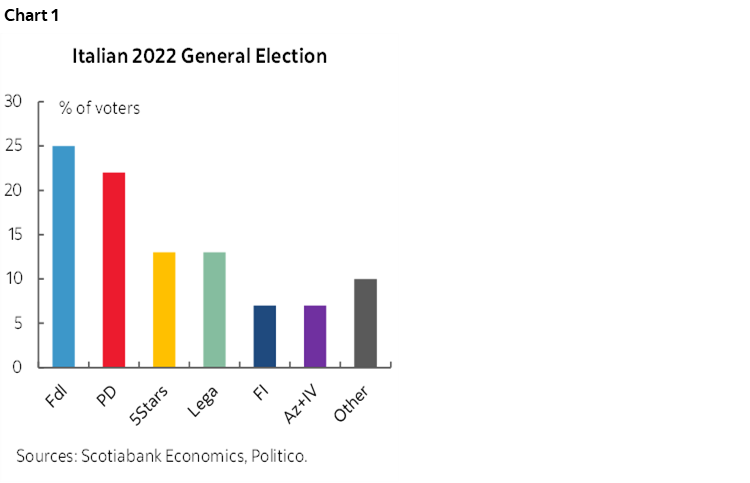
Italians head to the polls on Sunday. A right-wing coalition is widely expected to win (chart 1). It is led by Giorgia Meloni’s Brothers of Italy (light blue bar) and includes Matteo Salvini’s League (green bar) and former PM Silvio Berlusconi’s Forza Italia (dark blue bar). Berlusconi recently threw support behind Vladimir Putin’s war against Ukraine. Meloni has campaigned by using the tricolour flame symbol that evokes memories of Italian dictator Benito Mussolini while saying “I have taken up the baton of a 70-year long history.” She has expressed socially conservative views and opposition to the European Union’s policies when she said “The party for Europe is over.”
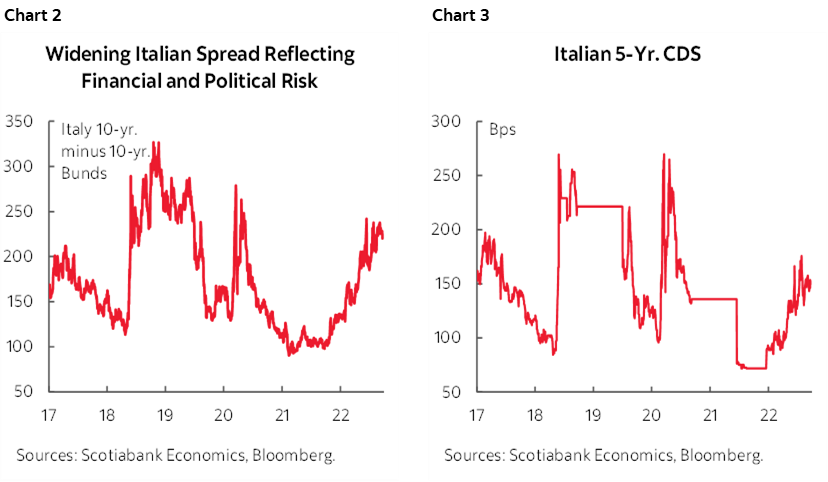
Apart from the risk of a more divided Europe in the wake of this election, the fiscal policy implications are unclear. As elsewhere, one controversial issue involves whether to maintain the so-called ‘citizens’ income’ that costs about €7 billion and that the leading coalition has pledged to eliminate because of its distorting effects on the labour market. Meloni has sounded fiscally responsible, but markets are highly skeptical. Charts 2–3 show the rising premium Italy has had to pay to borrow over comparable maturity bunds and rising credit default risk. One reason for this concerns the demands of her coalition partners including reductions to sales taxes and a flat tax for self-employed workers. If there is one constant through developments in Italian politics over the years, it is to never underestimate Italy’s capacity to challenge Brussels’ fiscal policy rules and guidance.
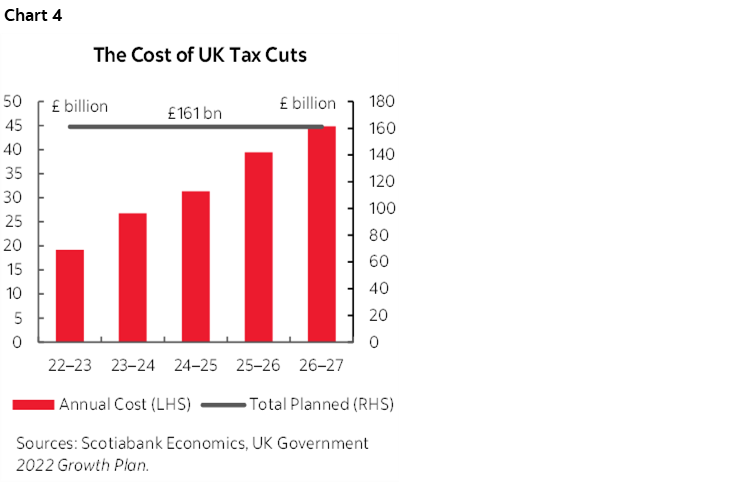
The election also matters because it arrives on the heels of the UK government’s fiscal policy plans. See here for a reminder of what they included and chart 4 for a reminder of the price tag associated with the UK government’s announced tax cuts that blew up the gilts market.
DOES THE BOND MARKET HAVE CANADA RIGHT?
Markets are pricing a lower peak for the Bank of Canada (4%) than the Federal Reserve (4¾%), and negative Canadian yield spreads to the US across the government bond yield curve. In fact, while many global bond yield benchmarks climbed sharply this past week, Canada bucked the trend and saw lower yields. Does this make sense?
Buying of Canadian government bonds can at times be subject to concentrated activity and investor-specific narratives that can swamp a relatively small boat. Such swings can be influenced at times by factors like hedging costs between currencies, but in debating whether such developments make durable sense we need a solid macro thesis to help inform relative rates. In my view there is a stronger case for Canada’s yields to trade above the US.
The case for current market pricing seems to depend upon three main selective understandings of developments and risks facing the Canadian economy and financial system. It includes observations like the following that are rebutted:
1. The consumer is flat on its back and driving the economy into recession. This seems to rely upon pointing to recently weak retail sales. Retail sales, however, miss over $1 out of every $2 spent by Canadian consumers because they don’t capture services. Services boomed this summer through spending at restaurants, bars, hotels, airlines, movie theaters, tourism venues etc. Services spending by consumers in the GDP accounts went up by 16% q/q in Q2 at an annualized rate. Higher frequency gauges such as restaurant attendance and flights point to ongoing strengths into Q3. You cannot judge the Canadian consumer by only looking at retail sales when a) retail inventories relative to sales point to ongoing challenges around product availability, and b) spending is shifting to services.
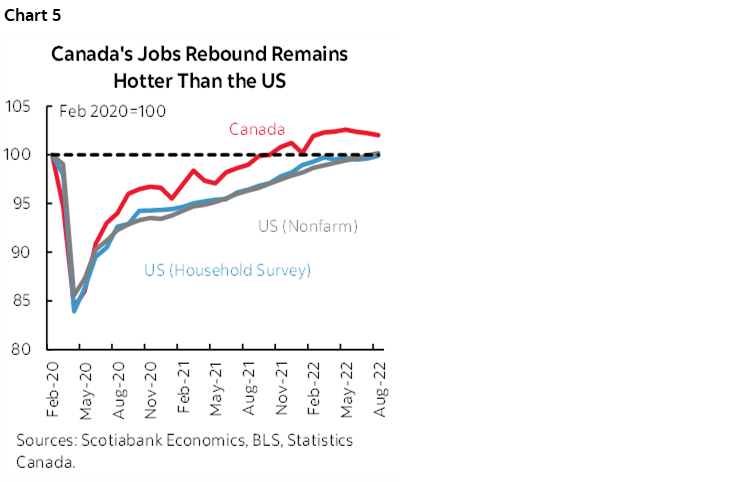
2. Jobs are being lost while they are still rising in the US which means more downside to Canada’s economy and more labour slack. Chart 5 shows that Canada’s jobs rebound remains hotter than the US. Further, at least some of the recent mild decline in Canadian jobs appears to be unreliable distortions to us.
3. Housing is more vulnerable to rising rates in Canada than the US. Actually, it’s probably the opposite. Many folks still have either never heard of B20 or don’t understand it, but it’s vital to consider its effects in lowering the incremental rate shock to Canadian mortgage borrowers compared to before the pandemic. Relative to the adjustment to the 5¼% qualifying rate within B20 to which the originations market had already adjusted, Canada is getting half the rate shock to the 5-year best offer mortgage rate plus the stress test’s 200bps increase that the US is getting via the run up in the 30 year mortgage rate this year. Plus, Canada is the only G7 country with accelerating population growth as higher immigration targets add a city of Ottawa or Edmonton every couple of years which requires an increasing housing stock and hence homebuilding. The drivers of the homebuilding segment are not the same as the drivers of the resales. The US is going the other way with population growth that has plunged to being right down there with the Eurozone now.
4. Inflation is cooling earlier than in the US. This is based upon the latest single month’s evidence out of Canada relative to the sticker shock that US CPI represented for the same month. It’s highly premature to make this argument as argued here and given arguments below.
What market pricing and the market narrative are not appreciating in my view are the following points.
1. The terms of trade lift. Canada is benefiting from commodities much more so than the US. This is an imported positive income shock that trickles down from national income through improved fiscal balances, retained earnings, household incomes.
2. Fiscal pump priming. The US faces two years of fiscal gridlock after November. Canada faces Trudeau bucks equal to 8% of retail sales into the holiday season and probably another expansionary Winter budget if not Fall statement.
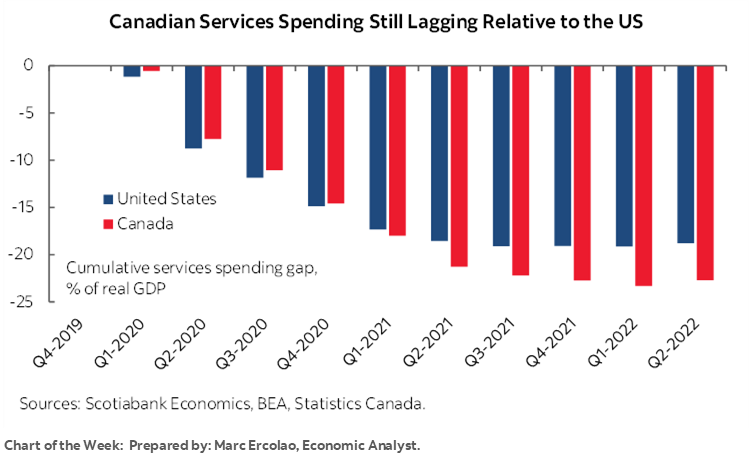
3. Canada has more pent-up demand for services. Restrictions lasted longer and deeper than in the US and Canadians have more catching up to do. Marc Ercolao’s chart of the week (see front cover) shows more as-yet unspent pent-up demand in Canadian consumer spending on services than in the US.
4. The C$ acts as a big export shock absorber against Canada's rising competitiveness problems. The USD is tightening conditions stateside.
5. I don't think the BoC can ignore the passthrough effects of C$ weakening as they would typically have done in the past. It's yet another upside to inflation that risks unmooring inflation expectations even further. It's not like mainstreet will be able to tell how much of inflation is due to supply side (some) versus demand side (some) versus CAD pass through (some). They'll just say prices are rising and extrapolate.
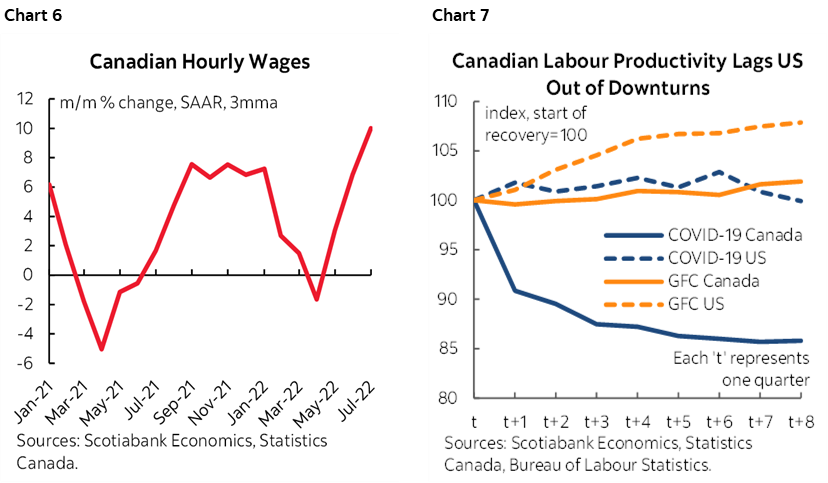
6. Canadian wage growth is exceeding inflation and running at 10% on a m/m annualized basis over the past three months which is double that of the US pace of wage gains (chart 6). Further, Canadian labour productivity is tanking relative to the US (chart 7). Canadians are getting paid more to produce less at a much quicker pace than Americans and that's inflationary. Canada's labour market—even with 3 months of mild declines—remains considerably tighter than the US. The combined effects drive more wage-price spiral concerns north of the border than south.
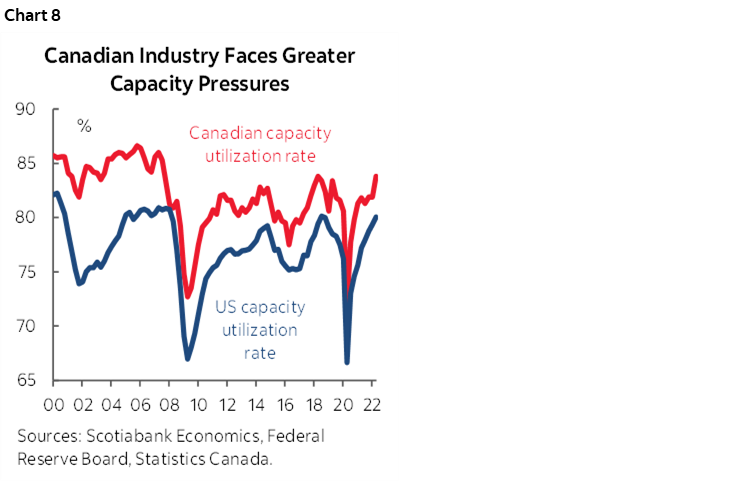
7. Canada has tighter capacity constraints than the US. The economy’s massive outperformance of the US during the first half of this year pushed the economy further into excess aggregate demand while the US contracted. Even Canada's industrial capacity utilization rate is several percentage points higher than the US (chart 8).
In short, I really struggle with this narrative that Canada should have lower yields across the curve than the US. It seems to be based upon flawed portrayals of what’s happening to the household sector while ignoring other risk mitigants and sources of support. Canada is a net commodity producing and exporting country whose governments keep spending riches on current consumption while workers are getting paid more to do less and the tumbling currency is masking competitiveness challenges while fanning inflation risk. This is occurring while the central bank is ditching bonds at a faster relative pace than the Federal Reserve. And Canadian yields are below US yields?
One way in which the possible conundrum might be explained is by arguing that the Federal Reserve is overdoing it and the BoC is smarter or the market perceives it to be. We’ll see. Let’s just say that to claim one central bank to be more on the ball than another in our times is probably a tad rich.
CANADA’S ECONOMY IN Q3
July GDP and the preliminary ‘flash’ estimate for August GDP will arrive on Thursday. They will inform tracking for Q3 growth.
Statcan had guided on August 31st that the economy contracted by 0.1% m/m in July. That preliminary guidance may be a touch high. A contraction of -0.2% m/m has been estimated for July and so far it’s not looking great for August based upon limited information available thus far. Key is that limited readings for August show that hours worked were flat and since GDP is hours worked times labour productivity, soft hours worked point to no growth. Weakness in activity readings across parts of the goods producing sector are weighed against upside strength in services.
If our tracking is on the mark then the early evidence points to a small –½% q/q annualized contraction in the economy in Q3. At this point we wouldn’t treat that as terribly material after the economy grew as strongly as it did during H1. Another caution is that this tracking estimate uses monthly production-side GDP accounts whereas the BoC’s forecast of 2% Q3 annualized GDP growth was based upon expenditure-based GDP accounts that do a better job at capturing drivers like inventory and import swings.
CENTRAL BANKS—FED-SPEAK RETURNS
The Federal Reserve’s speaker calendar lights up again as the FOMC comes out of blackout, but there will only be decisions offered by four regional central banks. Multiple regional Fed district bank Presidents will give their interpretations of the Fed’s recent actions that were explained here.
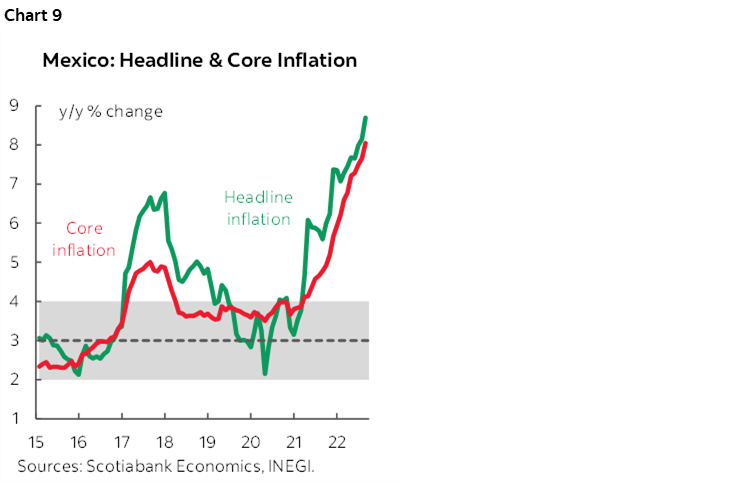
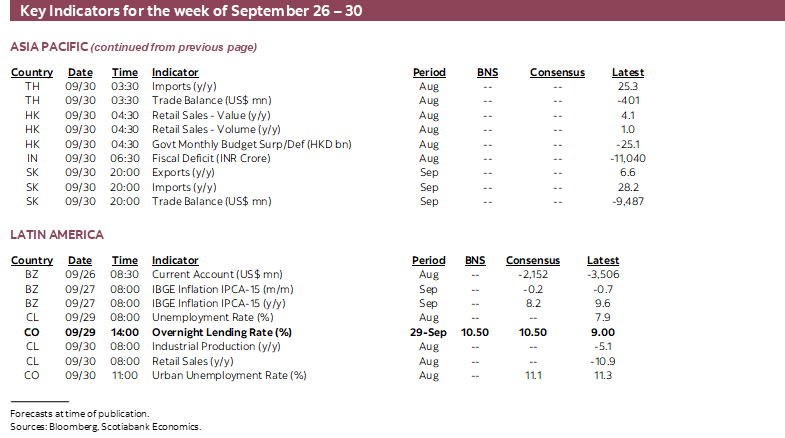
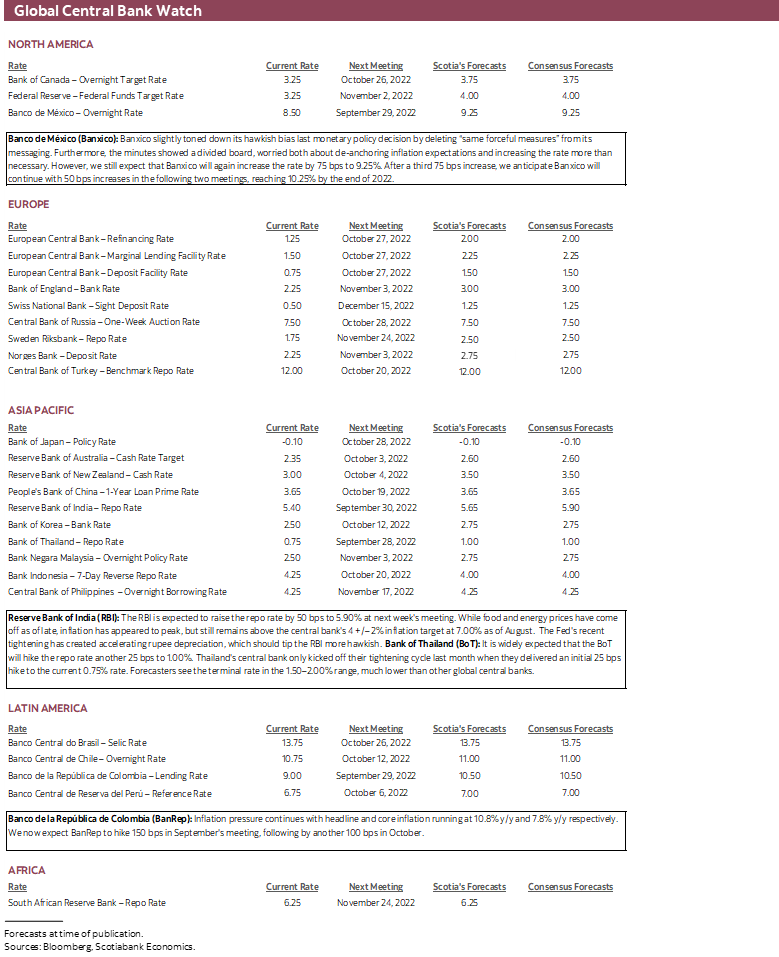
- Banxico (Thursday): Economists unanimously expect Mexico’s central bank to mirror the Fed’s recent 75bps hike and take its overnight rate up to 9.25%. The bias will probably indicate that it will continue to follow the Fed’s hiking campaign. Banxico officials have appeared to be somewhat in conflict with respect to signalling the degree to which their moves depend upon what the Fed is doing. Deputy Governor Heath has said that what the Fed is doing is “the number one indicator” of relevance to their decisions and that “we’ll probably go for what the Fed does,” while others including Deputy Governor Espinosa have stressed that this need not be the case and there are independent policy considerations perhaps like chart 9!
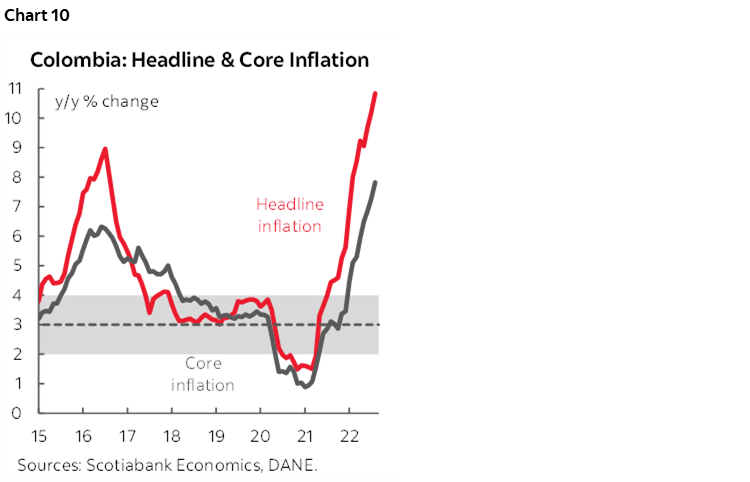
- BanRep (Thursday): Consensus is somewhat divided between expected Colombia’s central bank to hike by 100bps or 150bps. Core inflation recently spiked 0.8% m/m higher in August and took the year-over-year rate up by about ½% to 7.8% and with total CPI up 10.8% y/y for the hottest reading since April 1999 (chart 10)
- Reserve Bank of India (Friday): Consensus is split between expecting the RBI to hike by 35 or 50bps. A factor that may tip the balance toward going bigger is the resumption of currency weakness. The rupee depreciated over the past week as the Fed pivoted more hawkishly.
- Bank of Thailand (Wednesday): A second quarter-point rate hike is expected to lift the benchmark rate to 1%. August inflation climbed to 7.9% y/y and core CPI accelerated to 3.2% for the highest reading since 2008.
OTHER GEMS
Other top shelf global releases will primarily focus upon a series of US readings across the industrial, consumer and housing sectors, China’s PMIs and Eurozone inflation. The OECD is also expected to update its global forecasts on Monday.
A lighter US calendar than what we’ve become accustomed to of late will focus upon the following macro reports:
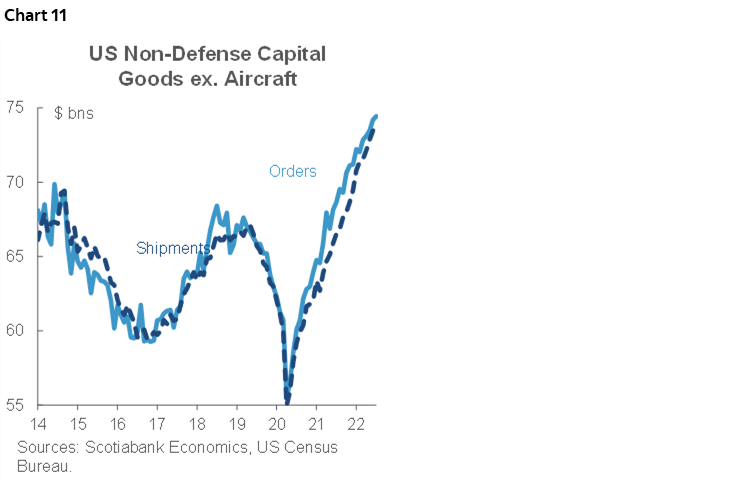
- Durable goods orders (Tuesday): August’s reading will probably see a soft headline weighed down by weaker plane orders, but key will be expectations for a sixth consecutive rise in core capital goods orders as a proxy for underlying business equipment investment. They exclude defence and aircraft and have been an often-understated area of strength in the US economy as it addresses supply chain challenges (chart 11).
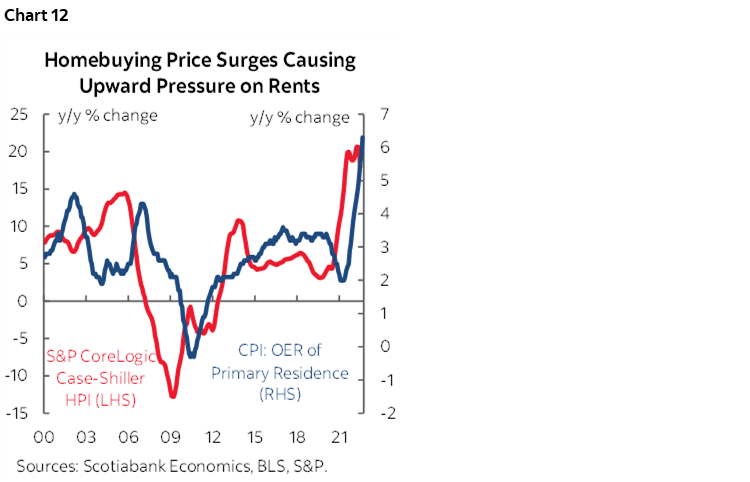
- S&P repeat-sale house prices (Tuesday): July’s lagging tally nevertheless matters because this reading can serve as a leading indicator of what to expect for owners’ equivalent rent in US CPI. As chart 12 demonstrates, we need to see compelling evidence of a turn lower by this measure of house prices before OER’s contributions to overall US inflation begin to ebb and that’s probably well down the read.
- Consumer confidence (Tuesday): September’s reading could post another gain as gasoline prices decline and labour market conditions remain tight. Markets will have an eye on how consumers view inflation over the coming year although it can just be driven by what consumers observe happening to current gasoline prices!
- Home sales (Tuesday & Wednesday): August’s new home sales tally (Tuesday) probably fell again because we know that model home foot traffic serves as an advance guide and it continues to soften. Pending home sales (Wednesday) will inform expectations for lagging completed resales that close 30–90 days after contracts are inked, but rising mortgage rates have put sharp downward pressure upon mortgage purchase applications.
- Jobless claims (Thursday): Weekly jobless claims continue to indicate a robust job market as an earlier rise has ebbed over recent weeks.
- Q2 GDP-r (Thursday): The initial print for Q2 GDP showed an annualized contraction of -0.9% q/q on July 28th that was then revised a touch to -0.6% on August 25th. This estimate more fully incorporates services spending and might see a slightly better reading.
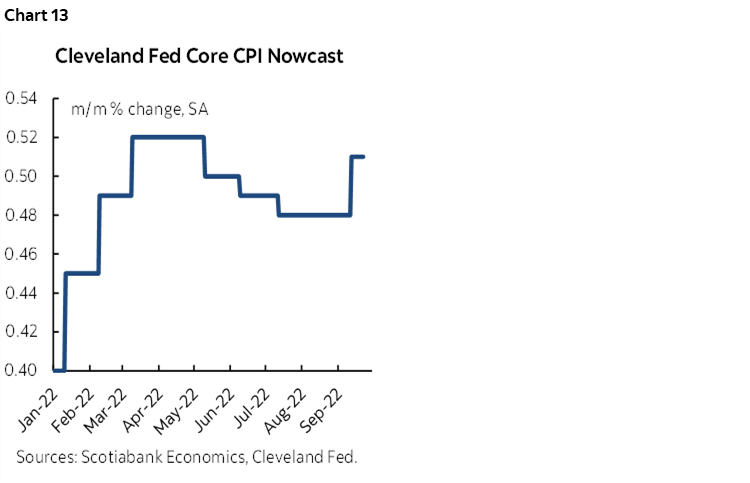
- Core PCE inflation (Friday): August’s reading for the Fed’s preferred inflation gauge is likely to closely follow the surge in core CPI after its 0.6% gain. It’s worth repeating that the Cleveland Fed’s ‘nowcast’ reading for core CPI in September is pointing toward another strong gain (chart 13).
- Personal income/spending (Friday): and finally, we’ll probably get solid income growth that I’ve estimated at +0.5% m/m but total consumer spending will need a lift from services to offset the soft retail sales report for the month.
China will update the state’s versions of its purchasing managers’ indices on Thursday night (eastern time as always in this report). They will likely show continued moderate expansion in the non-manufacturing sector but no growth in manufacturing. Still, the improvements at the margin may be a positive signal for Q3 GDP growth (chart 14).
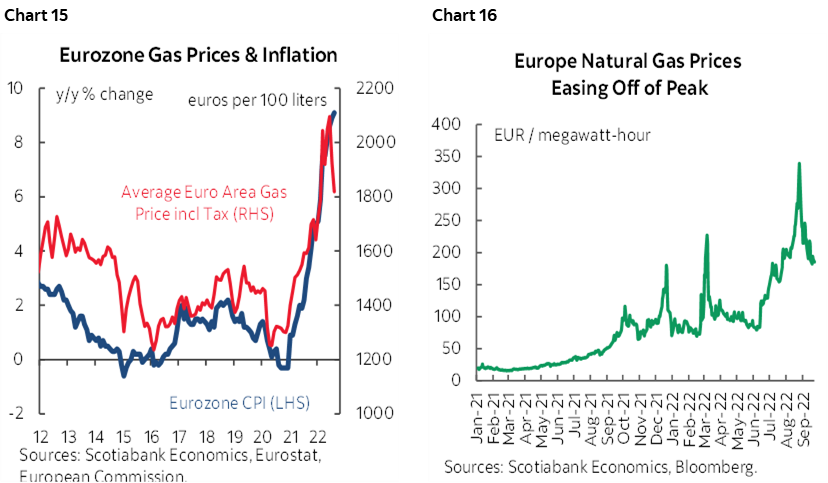
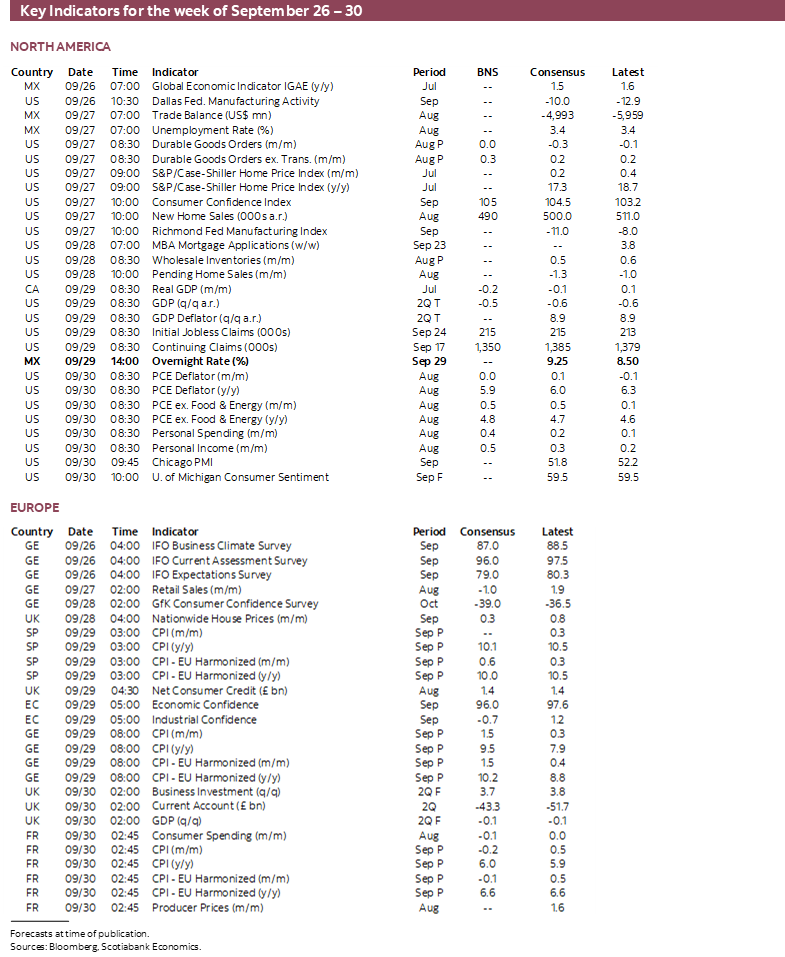
Eurozone CPI will be updated with September’s reading and another hot one is expected with many estimates hovering around 1% m/m. Even as gasoline (chart 15) and natural gas (chart 16) prices have ebbed, administered energy prices are expected to spike higher in Germany as mitigating supports expire such as a sales tax cut. More important will be core CPI that the initial flash is expected to show a further acceleration to 4.7% y/y (4.3% prior). Germany and Spain update CPI on Thursday followed by France and Italy on Friday.
Japan’s monthly data dump occurs toward the end of the week and updates the jobless rate, retail sales, industrial output and housing starts.


DISCLAIMER
This report has been prepared by Scotiabank Economics as a resource for the clients of Scotiabank. Opinions, estimates and projections contained herein are our own as of the date hereof and are subject to change without notice. The information and opinions contained herein have been compiled or arrived at from sources believed reliable but no representation or warranty, express or implied, is made as to their accuracy or completeness. Neither Scotiabank nor any of its officers, directors, partners, employees or affiliates accepts any liability whatsoever for any direct or consequential loss arising from any use of this report or its contents.
These reports are provided to you for informational purposes only. This report is not, and is not constructed as, an offer to sell or solicitation of any offer to buy any financial instrument, nor shall this report be construed as an opinion as to whether you should enter into any swap or trading strategy involving a swap or any other transaction. The information contained in this report is not intended to be, and does not constitute, a recommendation of a swap or trading strategy involving a swap within the meaning of U.S. Commodity Futures Trading Commission Regulation 23.434 and Appendix A thereto. This material is not intended to be individually tailored to your needs or characteristics and should not be viewed as a “call to action” or suggestion that you enter into a swap or trading strategy involving a swap or any other transaction. Scotiabank may engage in transactions in a manner inconsistent with the views discussed this report and may have positions, or be in the process of acquiring or disposing of positions, referred to in this report.
Scotiabank, its affiliates and any of their respective officers, directors and employees may from time to time take positions in currencies, act as managers, co-managers or underwriters of a public offering or act as principals or agents, deal in, own or act as market makers or advisors, brokers or commercial and/or investment bankers in relation to securities or related derivatives. As a result of these actions, Scotiabank may receive remuneration. All Scotiabank products and services are subject to the terms of applicable agreements and local regulations. Officers, directors and employees of Scotiabank and its affiliates may serve as directors of corporations.
Any securities discussed in this report may not be suitable for all investors. Scotiabank recommends that investors independently evaluate any issuer and security discussed in this report, and consult with any advisors they deem necessary prior to making any investment.
This report and all information, opinions and conclusions contained in it are protected by copyright. This information may not be reproduced without the prior express written consent of Scotiabank.
™ Trademark of The Bank of Nova Scotia. Used under license, where applicable.
Scotiabank, together with “Global Banking and Markets”, is a marketing name for the global corporate and investment banking and capital markets businesses of The Bank of Nova Scotia and certain of its affiliates in the countries where they operate, including; Scotiabank Europe plc; Scotiabank (Ireland) Designated Activity Company; Scotiabank Inverlat S.A., Institución de Banca Múltiple, Grupo Financiero Scotiabank Inverlat, Scotia Inverlat Casa de Bolsa, S.A. de C.V., Grupo Financiero Scotiabank Inverlat, Scotia Inverlat Derivados S.A. de C.V. – all members of the Scotiabank group and authorized users of the Scotiabank mark. The Bank of Nova Scotia is incorporated in Canada with limited liability and is authorised and regulated by the Office of the Superintendent of Financial Institutions Canada. The Bank of Nova Scotia is authorized by the UK Prudential Regulation Authority and is subject to regulation by the UK Financial Conduct Authority and limited regulation by the UK Prudential Regulation Authority. Details about the extent of The Bank of Nova Scotia's regulation by the UK Prudential Regulation Authority are available from us on request. Scotiabank Europe plc is authorized by the UK Prudential Regulation Authority and regulated by the UK Financial Conduct Authority and the UK Prudential Regulation Authority.
Scotiabank Inverlat, S.A., Scotia Inverlat Casa de Bolsa, S.A. de C.V, Grupo Financiero Scotiabank Inverlat, and Scotia Inverlat Derivados, S.A. de C.V., are each authorized and regulated by the Mexican financial authorities.
Not all products and services are offered in all jurisdictions. Services described are available in jurisdictions where permitted by law.