Next Week's Risk Dashboard
- BoC preview
- GenAI applied to the BoC
- Taylor Rule scenarios point to BoC hiking
- Spitballing the BoC’s balance sheet…
- … to assess its future role in the domestic bond market
- FOMC to cut with similar dot plot to the prior one…
- …amid reasons to cut and keep cutting…
- …alongside a case for caution
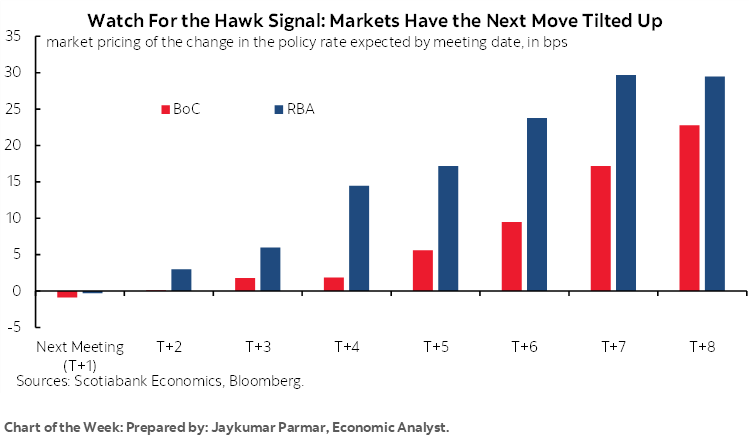
- RBA — Ho Ho Hum
- BSP likely to cut, but surprise risk is always high
- Turkey’s central bank to cut again
- SNB to stand pat for now
- BCB still faces an inflation problem
- BCRP — hold with cut risk
- Aussie jobs — three in a row?
- UK data dump
- China — waning trade, no inflation
- Inflation updates from Mexico, India, Norway
- Global macro
Chart of the Week
Central bankers will be clearing the decks ahead of the holiday season as eight of them deliver policy decisions this week including two that are particularly near and dear to our hearts here in North America. Data risk will play a back seat role this week but quickly escalate thereafter. The lack of a peaceful end to 2025 would be merely an extension to how it all began.
BANK OF CANADA—HAPPY HOLIDAYS
The Bank of Canada issues a statement-only decision at 9:45amET on Wednesday morning. Governor Macklem’s opening remarks to his press conference will be published at that same time. Then there will be a press conference 45 minutes later for around 45 minutes or so. The next full forecast update will be provided on January 28th at the next policy decision.
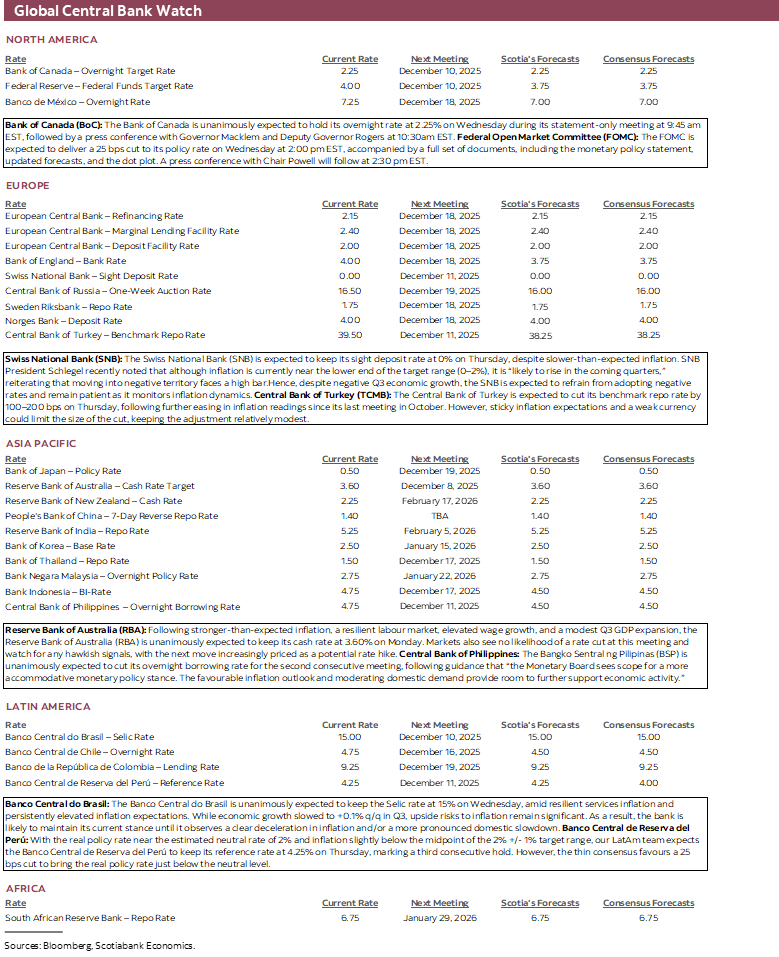
No policy changes are expected at this meeting. The overnight rate is expected to stay at 2.25%. No change is expected for the next several meetings at a minimum. Expect a guarded approach to funding market pressures given their sudden re-emergence in the US. Expect more talk around balance sheet plans with this one and I’ll provide updated balance sheet projections including implications for Government of Canada bonds later in this note.
The communications will then tee-up Governor Macklem’s traditional pre-holiday speech on December 16th. Expect some tough love but also encouraging words in keeping with the festive spirit, maybe even a joke or two. Go on, don the Christmas socks, Governor! Macklem won’t spit in your ’nog at that event barring extreme circumstances as the key to success will be to walkaway from it all without rocking the boat.
Key to expectations for a policy rate hold at this meeting is that they told us so at the last meeting. Recall the key line in the October 29th statement with emphasis added:
“If inflation and economic activity evolve broadly in line with the October projection, Governing Council sees the current policy rate at about the right level to keep inflation close to 2% while helping the economy through this period of structural adjustment.”
That was about as clear a sign that the BoC has shifted to the sidelines as one could imagine.
What has changed since that statement is a blend of factors that probably reinforce a protracted hold:
- GDP revisions from 2022–24 probably mean there was less slack in the economy up to the middle of this year than the BoC had previously anticipated. How much less depends upon how they interpret those revisions to mean less demand as well as more supply side contributions. Chart 1 shows our updated estimates of the size of the output gap which points to less than the October MPR estimate of a 1.1% negative output gap and closure by the end of next year. Less slack means somewhat less downward pressure on inflation going forward.
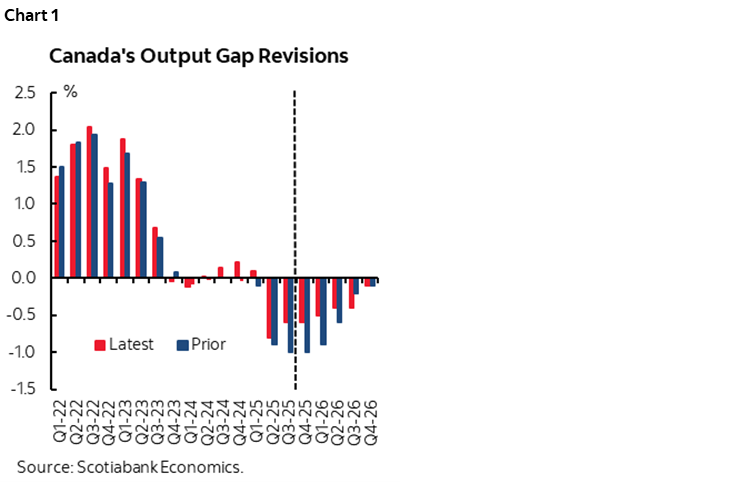
- It’s unclear that the economy was materially weaker than the BoC had expected for Q3. The October MPR had forecast GDP growth of 0.5% q/q SAAR and instead we got 2.6%. That said, the strong 2.1 percentage point beat was entirely due to less of an import leakage effect and driven by imperfect data due to deficiencies on the US side given the government shutdown. Expect revisions. Final Domestic Demand was flat (-0.1% q/q SAAR) with consumption down a touch but following a torrid rate of growth in Q2. It’s therefore unclear how the BoC may estimate slack in Q3 but I still think they’d wind up with less than previously judged on balance and mainly because the economy wasn’t as bad as previously judged over prior years.
- Core inflation remained warm in October. Trimmed mean was up 2.8% m/m SAAR, weighted median CPI was up 1.6%, traditional core CPI ex-food and energy was up 3.1% and CPI excluding the eight most volatile items was up by 3.8%. On balance, the suite of such readings and their smoothed trends suggest some inflation persistence above the BoC’s 2% inflation target.
- Jobs have ripped. 181,000 jobs were created over September, October and November and the unemployment rate fell by six-tenths to 6.5%. Yes, we’re in a trade war the Trump administration started but a possible explanation for job market resilience includes a) services resilience, b) a shift away from cap-ex toward labour with shorter planning horizons given uncertainty, c) labour hoarding amid essentially no population growth due to tightened immigration policy, and d) a greater cost to the US job market from uncertainty caused by the Trump administration than in Canada.
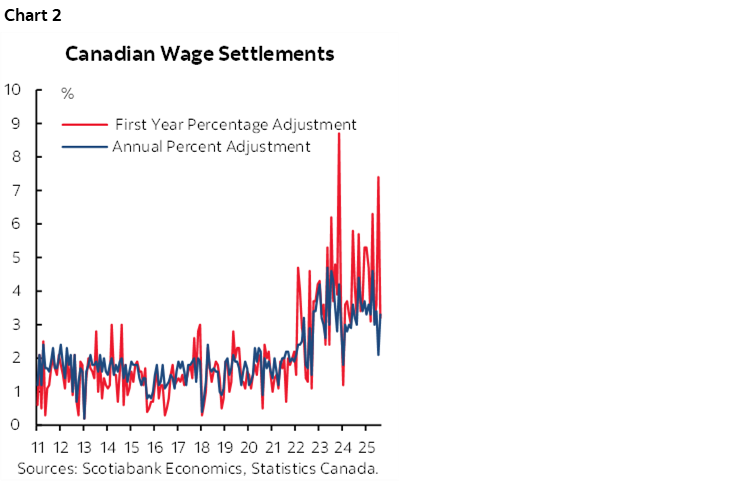
- wage growth has accelerated on a trend basis with the three-month moving average of was gains at nearly 4% m/m SAAR. Wage settlements data lags but continues to point toward gains in the first year and full 4–5 year contract period well above the BoC’s 2% inflation target (chart 2). One-third of Canada’s workforce is governed by collective bargaining exercises through union membership (10% in the US) and so there is greater stickiness to wage gains north of the border.
- productivity picked up to 3.7% q/q SAAR in Q3.
- the Federal budget offered somewhat less near-term stimulus and lower deficit projections than some expected which means less substitution of fiscal easing for monetary easing. It’s still a substitution though.
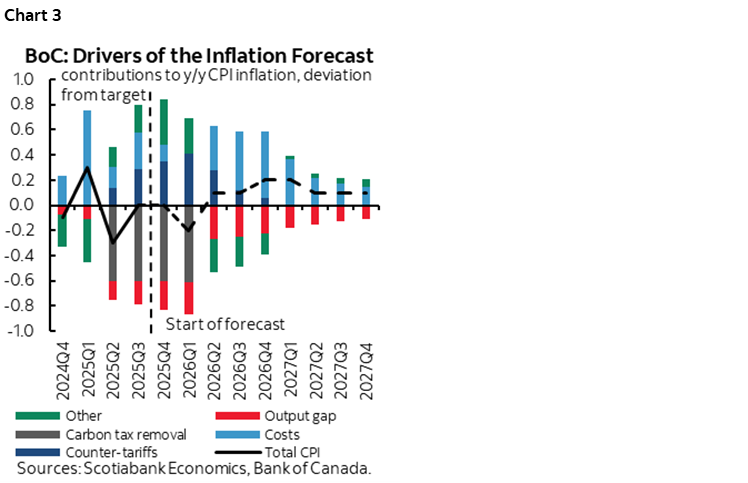
Beyond what’s changed, there is also what hasn’t. The BoC’s concerns about underlying cost pressures as a driver of inflation independent of slack drivers probably remain on track (chart 3). In fact, the balance may have shifted toward more upside to inflation by weighting cost drivers more highly than lessened slack estimates now because of the GDP revisions.
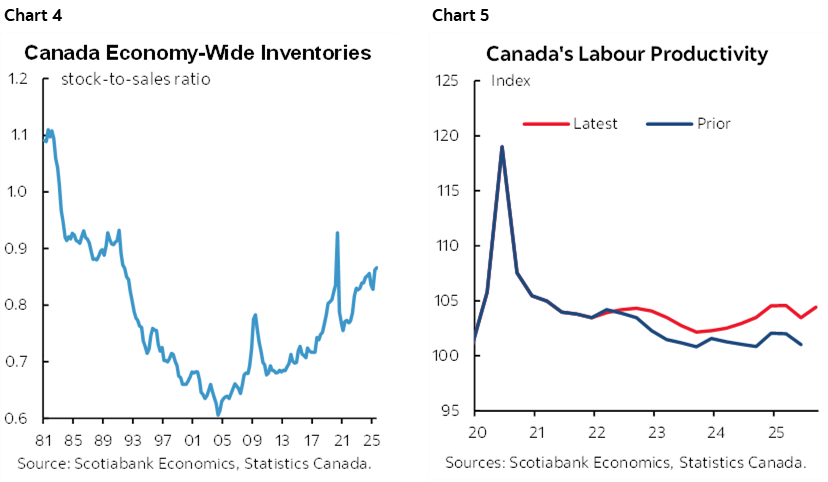
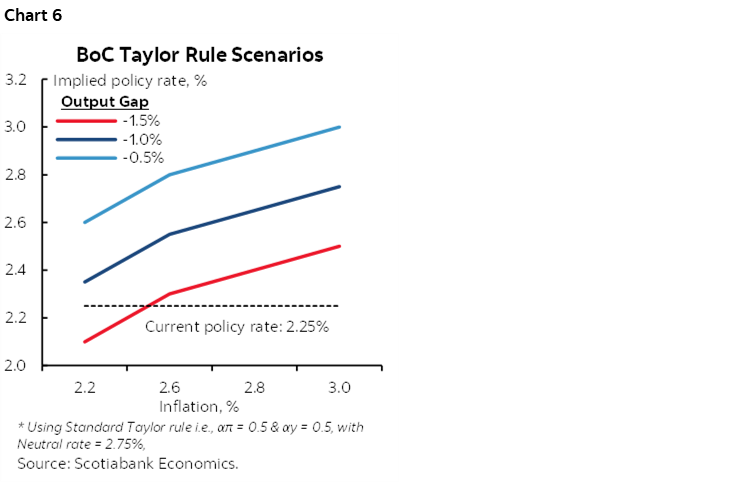
Regarding those cost pressures, companies are holding more inventories relative to sales than since the 1990s with storage and financing costs at risk of pass through to end consumers among other stakeholders (chart 4). For years now, wage growth has been unjustified in relation to morbid trend productivity figures—even after recent revisions—which nets out to upside to cost-push inflation (chart 5). Both the world and Canada are at a highly nascent stage of evaluating how supply chains will evolve in ways that may result in significant cost pass through to consumer prices. And, of course, the BoC’s real (inflation adjusted) policy rate is already at roughly zero alongside a still undervalued currency with lagging effects of rate cuts on the economy.
Taylor Rule Scenarios Say Policy is Too Easy
One way of assessing the current policy stance and where it may go is by utilizing the Taylor Rule. Recall that this ‘rule’ posits that the policy rate should be directly related to estimates of the real policy rate plus some coefficient applied against the deviation of inflation from the 2% inflation target, plus some coefficient applied against the estimated size of the output gap. All of these variables are highly uncertain at present and going forward, but we can still do some scenarios that yield useful insight.
Don’t have a large macroeconometric model with hundreds of equations and an embedded Taylor Rule framework of your own to run? Fear not. Now you do.
Enter generative AI. Now everybody has sophisticated modelling in their pockets. Gone is the black box nature of big models you can’t access and whatever assumptions their creators choose not to share with you as economics gets democratized. Now everybody has the ability to do umpteen scenarios for what should be the present and future policy rate using different measures of core inflation, output gaps, real neutral policy rates and sensitivities to deviations from the inflation target and capacity deviations. Information costs and barriers are falling. In addition to my own fiddling with Taylor Rule estimates I asked ChatGPT to help.
It all starts with “please provide Taylor rule estimates for what the bank of Canada's policy rate should be now.” ChatGPT then goes to work, scouring the web for data, for various estimates of the gap and inflation and real neutral policy rates, devises a model in accordance with the Taylor Rule framework, and within around 20–30 seconds presto here’s your answer.
Chart 6 is the outcome. It shows what the policy rate should be under differing scenarios for the inflation rate and size of the output gap at reasonable estimates for the coefficients and assuming that the neutral policy rate is about 2.75% which is in the middle of the BoC’s estimated range. Present inflation is 2.2% y/y with the BoC’s core measures at 2.9% (weighted median), 3.0% (trimmed mean) and 2.7% (traditional core ex-food and energy). We estimate the output gap at about -0.6% now. This combination shows the policy rate is presently around 25–50bps too low.
In other words, there is an insurance premium that is already built into the policy rate in recognition of forward-looking risks, or because the BoC shouldn’t have cut. We did forecast they would cut based on the BoC’s reaction function and our assessment of the insurance argument as Canada eliminated most reciprocal tariffs, as the US labour market sheds somewhat disturbing signals, as trade negotiations stalled and while awaiting fiscal stimulus.
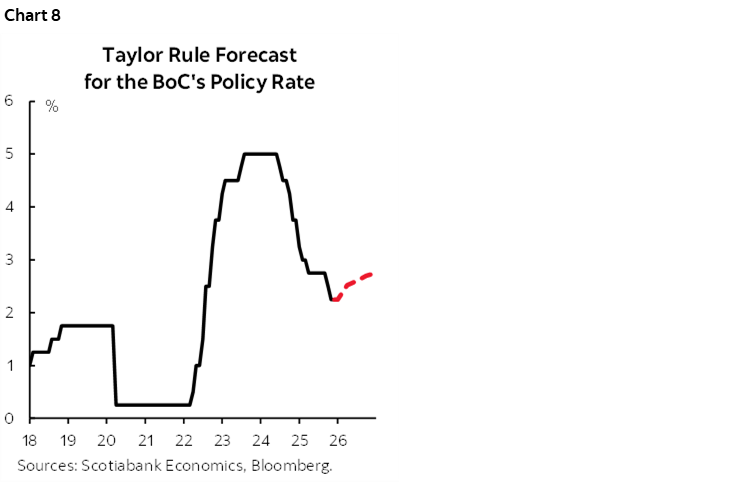
I also ran lots of other scenarios with different measures of inflation, different measures of the nominal neutral rate, different measures of the size of the output gap, and varying coefficients. I can’t run through all of them here but chart 7 shows the three dozen estimates of what the policy rate should be in repeated modelling and compares them to the actual policy rate at present. In the overwhelming majority of those estimates what jumps out is that the policy rate is lower than the Taylor Rule predicts it should be.
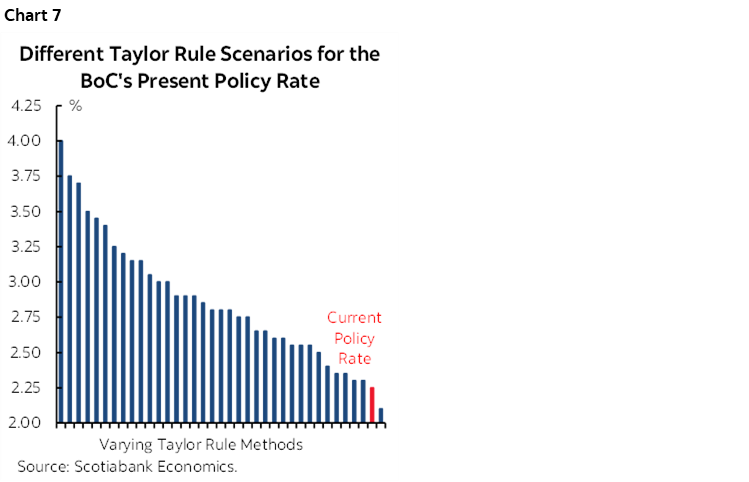
If there is such an insurance premium, then it counsels against cutting further at least for some time.
What the Taylor Rule Says About Next Year
I then asked ChatGPT to produce a forecast for the BoC’s policy rate going forward and did multiple scenarios for the various inputs. The most reasonable base case outlook is provided in chart 8. It shows 50bps of hikes next year starting in 2026Q3.
This view is consistent with expecting the output gap to roughly close by the end of 2026 from a lower starting point now than previously estimated and because soft demand conditions are accompanied by supply constraints such as tighter immigration policy and weakened supply chains.
There is a lot that the Taylor Rule does not take into consideration, some of which can be accommodated by the differing assumptions I used as inputs, such as how strongly the BoC may react to deviations in inflation from the target and output gaps from imbalances (ie: the coefficients).
Updated Balance Sheet Projections
How much of a role might the Bank of Canada play in the bond market beyond traditional tools applied at the front-end?
On that note, watch for any further discussion around balance sheet policy and next steps in 2026. They ended Quantitative Tightening back in the January statement. The first progression toward stabilizing and then expanding the balance sheet was to return to repo activity. The next step is to start buying treasury bills. They recently announced that buying will start on December 16th and will disclose specific intended purchase amounts on December 9th (here).
What next and when? It might be reasonable to expect another annual speech by Deputy Governor Gravelle in January as per last year (here), but in 2024 he delivered such a speech in March. An annual update is useful to markets and a fair amount has changed since his last one.
Key is timing when the BoC may return to gross purchases of Government of Canada bonds given the speech’s guidance this would occur “no earlier than late 2026” and then the updated recent guidance on how they will “likely not need to start until 2027.”
Charts 9–12 provide my updated attempts at spitballing the evolution of the BoC’s balance sheet. By my math, the BoC should be in no great rush to purchase GoC bonds until well into 2027. Only a modest amount of GoC bond buying is projected over the next several years. This is the outcome from a set of assumptions and Gravelle’s guidance.
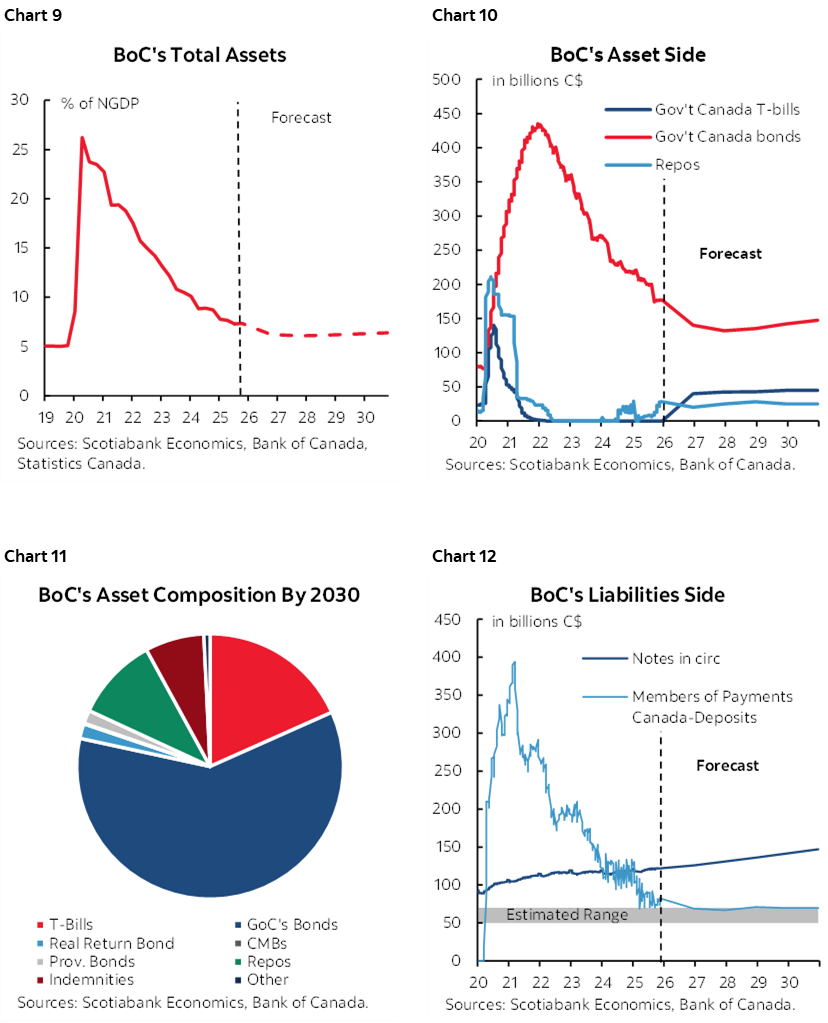
On the liability side:
- settlement balances (ie: the BoC’s version of the Fed’s reserves) are targeted at between C$50–70 billion. What drops out of my math and intuition is that the BoC is likely to lean toward the higher end of this target range. Persistent bouts of funding market challenges probably make it prudent to lean toward the higher end and possibly higher yet. The BoC previously underestimated the amount of settlement balances targeted at C$20–60B.
- Government of Canada deposits temporarily pick up as stimulus is deposited and then redeployed but then these balances return to a lower steady state.
- notes in circulation grow at a pace equal to nominal GDP over time.
- ‘other’ deposits, ‘other liabilities, and equity are relatively stable.
On the asset side:
- CMB, provincial bond and RRB holdings continue to decline as maturing holdings drop off. CMB holdings are basically eliminated by 2030.
- short-term interest-bearing assets (bills, repo) roughly equate to short-term interest-bearing liabilities (settlement balances). The split between bills and repos is unclear but I’ve assumed there to be a natural progression more toward bills than repos.
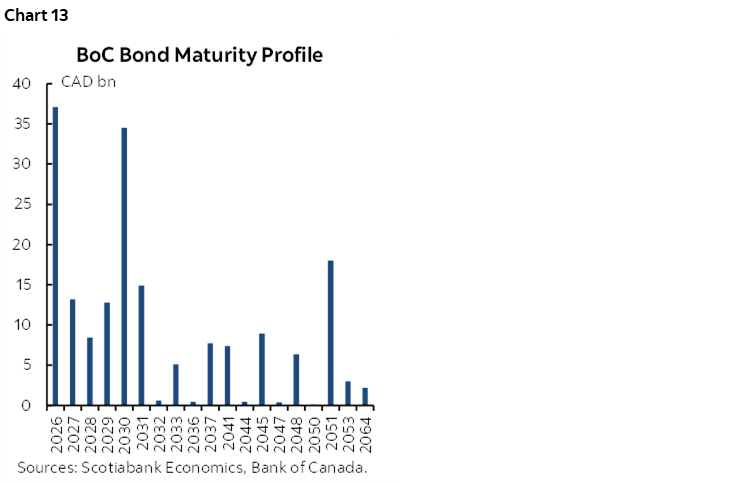
- GoC bond holdings grow roughly in line with notes in circulation as gross purchases return starting in 2027 and in the secondary market as per BoC guidance and come to offset bond maturities (chart 13).
The implied challenge to market participants is that—barring a crisis that would generate debate about returning to Quantitative Easing—the BoC won’t be providing much support to the bond market as government debt rises.
As for funding market pressures, they’ve largely settled themselves but expect guidance to emphasize preparedness to act should conditions flare again. The CORRA spread over the overnight rate has been largely eliminated (chart 14). The clear signal that the BoC is done cutting for the foreseeable future mitigated the pattern of hedge fund demand for repo funding to finance going long on shorter-dated bonds in anticipation of future easing. This signal helped to normalize repo funding pressures. So did the BoC’s repo funding operations. So did communications.
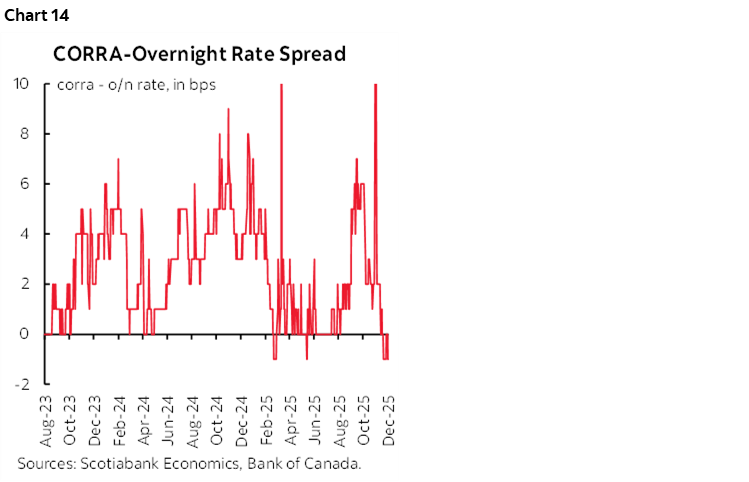
That said, funding pressures remain volatile in the US and this could spill back into Canada again given the tight integration of US-Canadian markets.
FOMC—TAYLOR RULE HELPS TO EXPLAIN DIVISIONS
The two-day FOMC meeting culminates in a full suite of communications and forecasts on Wednesday afternoon after the Bank of Canada. The statement (2pmET) will be accompanied by a freshened Summary of Economic Projections including a revised ‘dot plot’ of rate projections. Chair Powell’s press conference follows at 2:30pmET for around 45–60 minutes or so.
A 25bps cut to a new target range of 3.5–3.75% is expected. In fairness, we have stood rock solid behind that call throughout the whole period in which market pricing gyrated and Wall Street shops flipped back and forth on their calls.
At this point, the most powerful arguments to cut at this meeting are:
- To not cut now that it’s almost entirely priced in OIS and fed fund futures would risk severe market dislocation effects especially since the top of the house has done nothing to lean against market pricing. The Committee usually prefers to avoid major surprises on game day.
- To not cut could also expose the FOMC to great vulnerabilities shortly thereafter when nonfarm payrolls for October and November arrive on December 16th, CPI gets updated on December 16th, other data catches up, and year-end funding developments are digested.
- There is a low cost option to ease now rather than hold and cross your fingers on the ensuing developments until the next FOMC decision that isn’t until January 28th. Let’s say you hold and then everything goes south and markets are in turmoil for a month and a half. Why chance that from a risk management perspective?
It’s All in the Forward Guidance
Forward guidance is likely to matter more. It is expected to be highly scattered with a central tendency supporting modest additional easing in 2026 as implied by the range of views behind policy rate expectations.
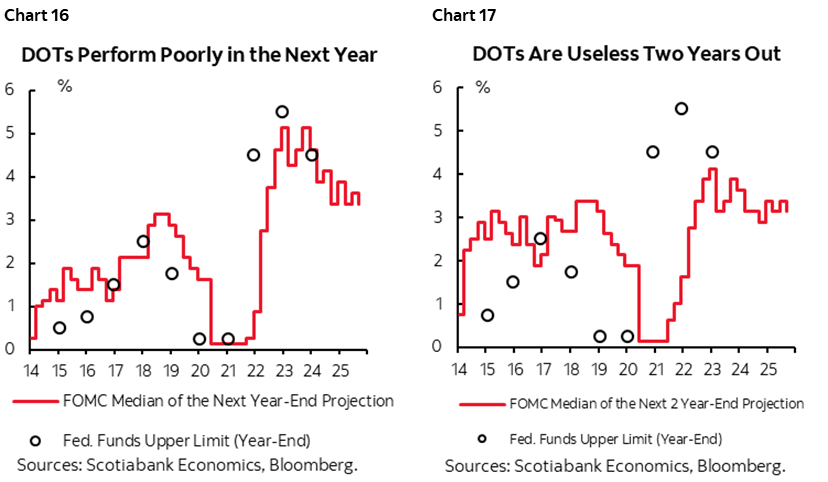
Regarding forward guidance, I think folks forget that the volatility in Fed-speak isn’t as distinct from the prior ‘dot plot’ as one might think. Back in September, the median FOMC participant indicated openness toward cutting to an upper limit of 3.75% by year-end and then only one more cut in all of 2026 followed by one more in 2027 and then holding.
In other words, it was already a Committee that was reticent to do much by way of easing going forward. It was already a highly divided Committee as evidenced by the dot plot published at that meeting (chart 15). Back then, participants were scattered across cutting down to 2.75% and not cutting at all by sticking at September’s 4% rate throughout the coming year.
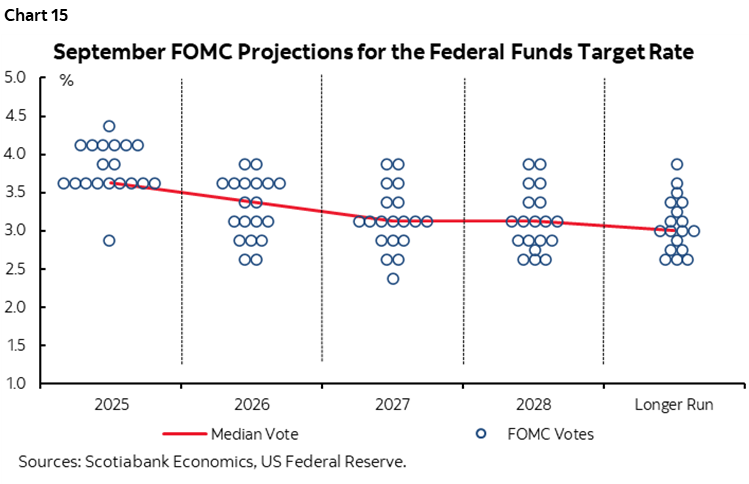
Something similar is expected at this meeting. It would be very surprising if they showed any greater collective conviction on the path forward than they did in September.
And recall that whatever they show by way of the dots faces a bleak track record. The dots are a useful guide to what actually happens to the policy rate only when they are issued late in the year for where the policy rate ultimately winds up. Out one or two or more years they perform poorly as a guide (charts 16–17).
Forecast Changes
Charts 18–19 compare the fresh US forecasts by Scotiabank Economics to the Committee’s median projections provided back in September in order to give a sense of how we think the Committee may changes its views.
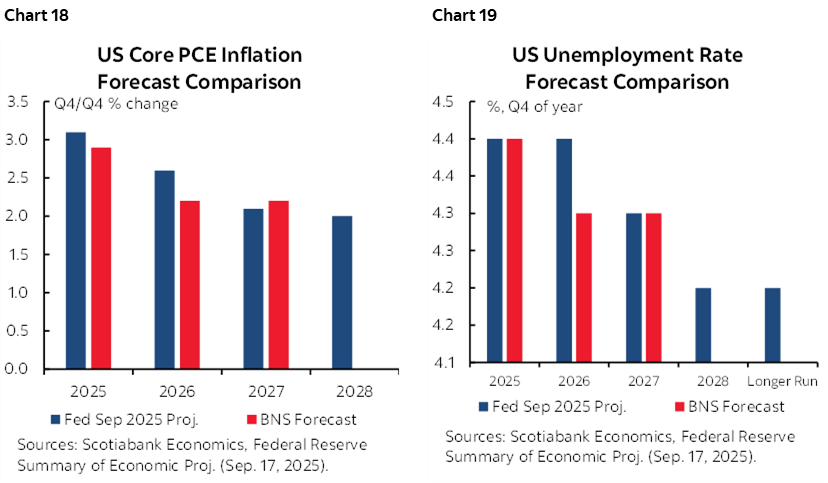
That said, what the Committee offers is not necessarily a pure forecast and can differ sometimes significantly from Board staff projections.
Fundamental Argument for Easing
There is a case for material easing which is behind our call for 100bps of cumulative easing by Spring down to a 3% fed funds upper limit.
- One argument concerns risks facing the dual mandate into 2026 and a need to get ahead of them.
- Another is that recent data provides a bit of an opening for further easing as evidenced by three months in a row of mild 0.2% m/m SA gains core PCE inflation and an array of job market readings that point toward material slowing.
- growth is likely to soften. Catalysts include tighter immigration policy. Added to that are lagging effects of dollar strength. A diminishing wealth effect as real house prices turn flat to lower is being accompanied by the sharp destruction of wealth in cybercurrencies since October that has outweighed the rise in equity market capitalization since then. Policy uncertainty is likely to weigh on non-AI related activity. AI-related investments are masking underlying softness but with valuations and free cash flow going into AI likely to slow from exponential gains over the past couple of years.
- with cooler growth should be a cooler job market.
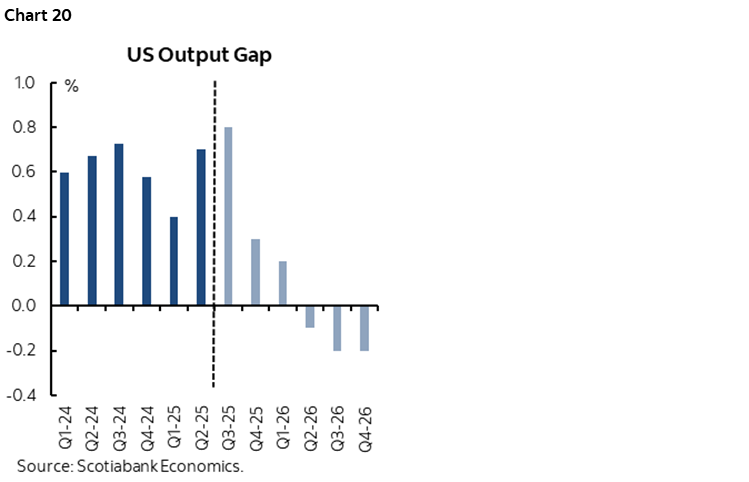
- We forecast the output gap to gradually turn toward excess capacity as cooling growth underperforms potential growth (chart 20).
- the result could moderate inflationary pressures but subject to high nearer term risk as well as longer wave uncertainty that remains pointed higher.
The FOMC’s reaction function could emerge to be added reason to expect material easing as markets await the formal announcement of who will be the next Fed Chair and as the five-year review of regional Presidents lies ahead.
Arguments Against Easing
None of this is a certainty of course.
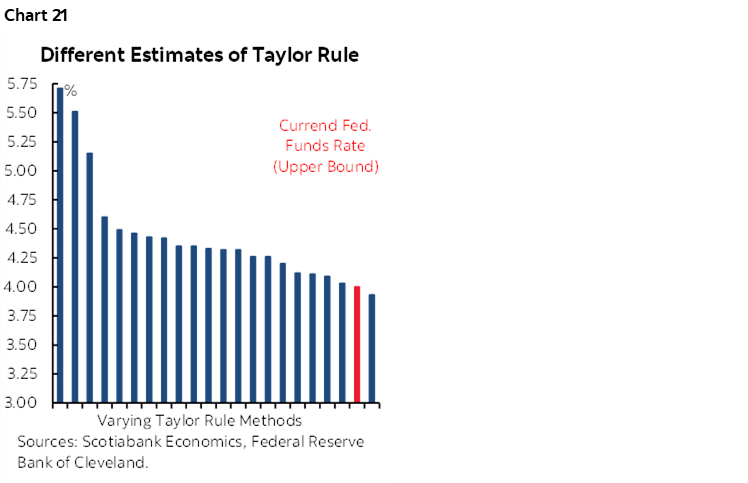
Taylor Rule approximations, for example, have not been showing much of a need for policy easing at all ever since Summer (here, chart 21). Various versions and iterations are shown and they all show the current policy rate to be either about right or too low.
Fed communications have not been helping. In the summer, we heard Chair Powell say that upside risk to inflation and downside risk to jobs would mean that the policy response would depend upon which one deteriorated the most relative to the 2% inflation target and 4% full employment rate of unemployment. Then Powell seemed to tilt more toward concern over downside risk to the job market while dismissing potential upside risk to inflation as likely to be temporary. That still appears to be Powell’s bias, but the Committee is more divided based upon public comments.
The present situation is unclear in the absence of fresh data such as nonfarm payrolls and inflation data that arrives after this meeting. Payrolls are two months behind because of the Trump administration’s government shutdown.
The outlook is also highly uncertain. Valuations are high, AI-related activity faces uncertain sustainability, trade policy uncertainty remains very high and there may be further fiscal policy developments next year.
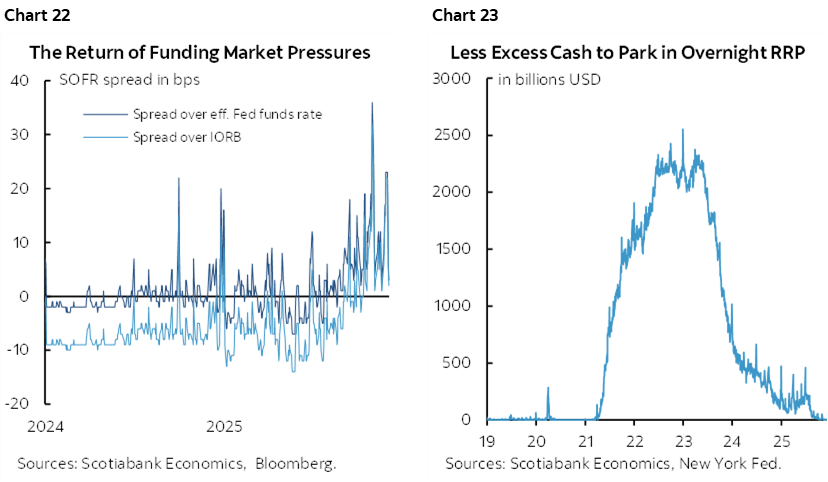
Added to the list are market frailties around funding market pressures. Money market rates have been volatile relative to fed funds (chart 22). Excess cash has been depleted (chart 23). Potential pressures could easily lie ahead into year-end and with uncertainty over how ‘ample’ reserves are.
Jay Parmar and I offer lighter previews for the rest of the central banks to follow.
RBA—HO HO HUM
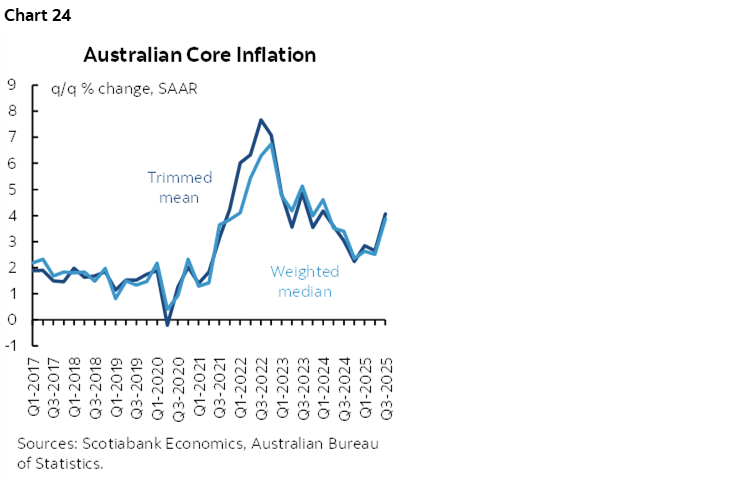
Following stronger-than-expected inflation, a resilient labour market, elevated wage growth, and a modest Q3 GDP expansion, the Reserve Bank of Australia (RBA) is unanimously expected to keep its cash rate at 3.60% for a third consecutive meeting on Monday. Markets also see no likelihood of a rate cut at this meeting or in the near term. Both of the RBA’s core inflation measures remain above the 3% upper bound of the target range (chart 24), while the labour market continues to show resilience with solid job gains and elevated wage growth. Governor Bullock recently noted that inflation has surprised to the upside and warned that persistent price pressures could influence the future policy path. Hence, the bank is expected to hold firm as markets watch for any hawkish signals, with the next move increasingly priced as a potential rate hike.
SNB—STANDING PAT FOR NOW
The Swiss National Bank (SNB) is expected to keep its sight deposit rate at 0% on Thursday, despite slower-than-expected inflation. Markets have also fully priced in no change for this meeting. Since the September meeting, headline inflation has eased to 0% in November, with core inflation at 0.4%. However, SNB President Schlegel recently noted that although inflation is currently near the lower end of the target range (0–2%), it is “likely to rise in the coming quarters,” reiterating that moving into negative territory faces a high bar. In addition, the recent trade deal with the US, which reduced tariff rates from 39% to 15%, should provide some relief to the economy and reduce uncertainty. Hence, despite negative Q3 economic growth, the SNB is expected to refrain from adopting negative rates and remain patient as it monitors inflation dynamics.
A key risk, however, is what happens to the franc. It dramatically strengthened after ‘Liberation Day’ which challenges the inflation outlook through import prices. If the FOMC eases as we expect and the dollar softens over 2026 then renewed appreciation of the franc could pose fresh challenges.
BCB—TOO HOT
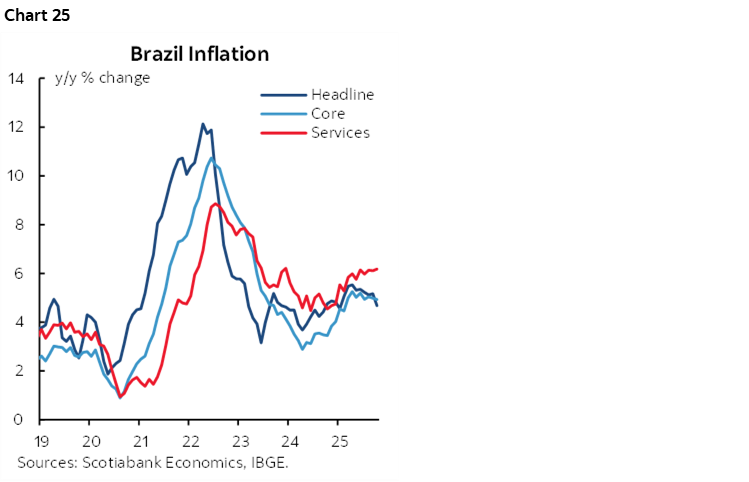
The Banco Central do Brasil is unanimously expected to keep the Selic rate at 15% on Wednesday, amid resilient services inflation and persistently elevated inflation expectations. While economic growth slowed to +0.1% q/q in Q3, upside risks to inflation remain significant, driven by sticky services prices (chart 25). As a result, the bank is likely to maintain its current stance until it observes a clear deceleration in inflation and/or a more pronounced domestic slowdown.
BCRP—HOLD WITH CUT RISK
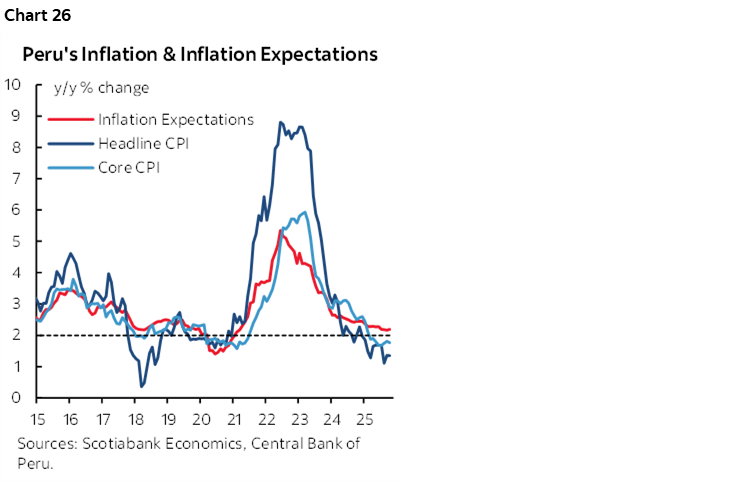
With the real policy rate near the estimated neutral rate of 2% and inflation slightly below the midpoint of the 2% +/- 1% target range, our LatAm team expects Banco Central de Reserva del Perú to keep its reference rate at 4.25% on Thursday, marking a third consecutive hold. Economic activity continues to hover around potential, supported by resilient three-month and twelve-month economic expectations, signaling sustained robustness. Inflation continues to ebb (chart 26). However, the thin consensus favours a 25bps cut to bring the real policy rate just below the neutral level.
BSP—CUT GUIDANCE VERSUS HIGH SURPRISE RISK
The Bangko Sentral ng Pilipinas (BSP) is unanimously expected to cut its overnight borrowing rate for the second consecutive meeting to support domestic economic growth. At its October meeting, the bank surprised markets with a 25bps cut, citing a weak outlook for domestic activity. Furthermore, it guided that “the Monetary Board sees scope for a more accommodative monetary policy stance. The favourable inflation outlook and moderating domestic demand provide room to further support economic activity.” Hence, considering the current inflation well within the target range and Q3 GDP came in below expectations, the bank is expected to deliver another 25bps cut.
Having said that, this central bank loves a good surprise every now and then.
TURKEY—STILL INCHING LOWER
The Central Bank of Turkey is expected to cut its benchmark repo rate by 75–150bps on Thursday, following a further easing of inflation readings since its last meeting in October. However, sticky inflation expectations and a weak currency could limit the size of the cut, keeping the adjustment relatively modest.
GLOBAL MACRO—THANKFULLY LIGHT INDICATORS
Thankfully the line-up of global macro readings will be light. There will be enough to noodle given the line-up of global central bank decisions.
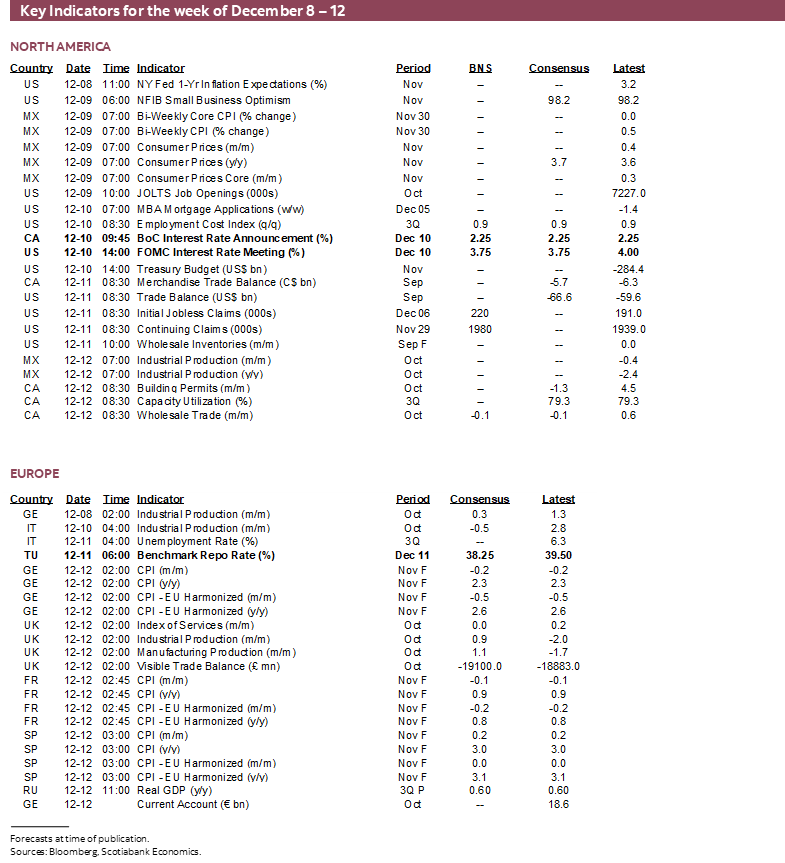
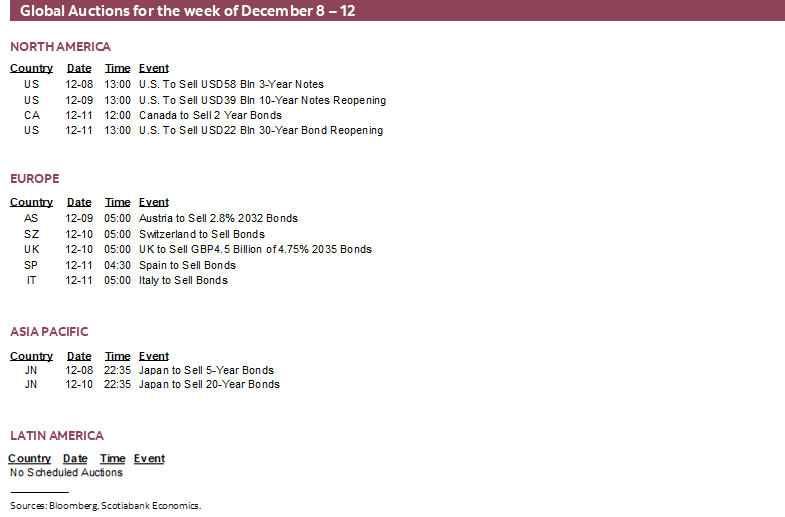
US markets will be treated to major releases the following week. This coming week only brings out JOLTS job vacancies for October (Tuesday), the Employment Cost Index for Q3 (Wednesday), another batch of weekly jobless claims (Thursday), and trade figures for September (Thursday).
Canada will release Q3 figures for national balance sheet accounts (Thursday). It’s this set of numbers that updates everything you wanted to know about household, business, and government balance sheets from net worth to debt service measures and the composition of assets and liabilities. Wholesale trade for October (Friday) is likely to be soft.
The monthly UK data dump at the end of the week will improve our understanding of economic momentum into Q4. GDP for October is expected to post very little growth. The index of services activity has been carrying much of the momentum as manufacturing has stumbled. Fresh figures for trade will help inform how the UK is holding up to trade tensions.
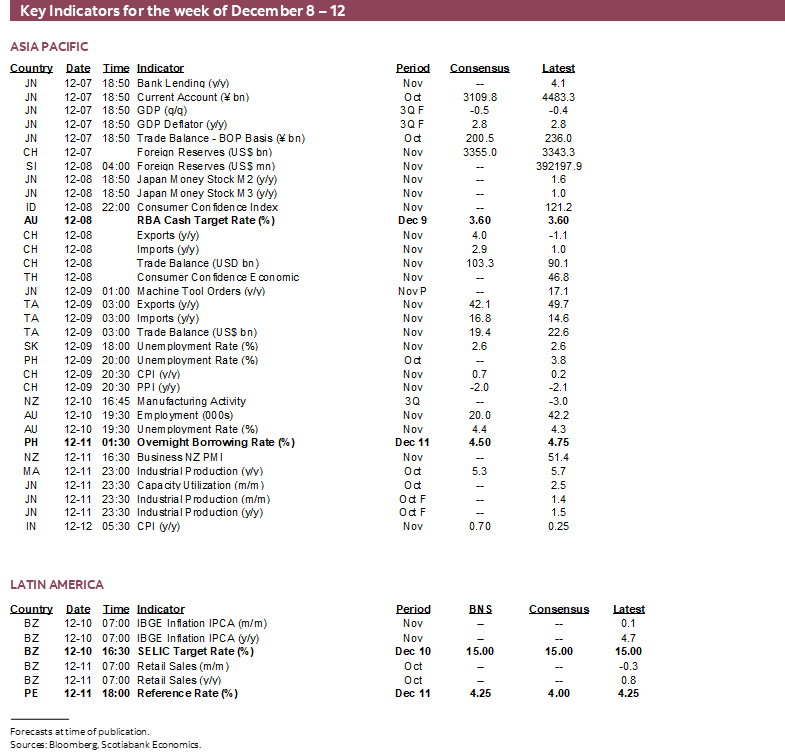
Australian job figures for November (Wednesday) will strive to make it three gains in a row after about 50k jobs were created over the combined two prior months. The RBA has been signalling it’s going to be patient with markets pricing no action over the next several meetings.
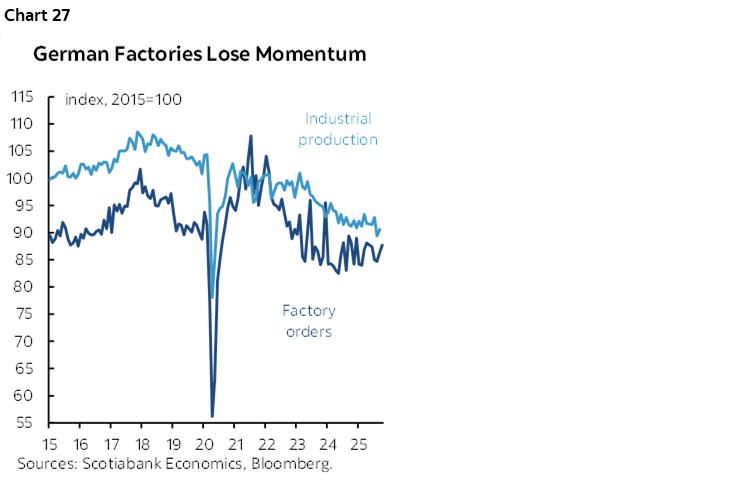
How Germany’s important industrial complex is faring will be the focal point as industrial production figures for October (Monday) and exports (Tuesday) arrive. Amidst the monthly gyrations lies the fact that both readings have been flatlining or slightly worse for an extended period and not just when Trump came along (chart 27). A recent pick-up in factory orders might buoy other readings.
China’s own trade resilience will be in question when it refreshes trade figures for November at the start of the week. They’ve been weak. Exports have been tracking about -1% y/y with imports at +1% y/y. CPI figures for November (Tuesday) are likely to show no real inflation with CPI just above 0% y/y with core CPI at about 1¼% y/y. China might also refresh credit figures this week, or the next.
Each of India (Friday), Mexico (Tuesday) and Norway (Wednesday) also update CPI for November. India’s CPI is barely above 0% y/y with core inflation running at 4½% y/y. Market pricing for a prolonged Norges Bank hold is unlikely to be swayed by CPI. Mexico’s monthly CPI numbers usually offer little shock value given the bi-weekly release pattern.

DISCLAIMER
This report has been prepared by Scotiabank Economics as a resource for the clients of Scotiabank. Opinions, estimates and projections contained herein are our own as of the date hereof and are subject to change without notice. The information and opinions contained herein have been compiled or arrived at from sources believed reliable but no representation or warranty, express or implied, is made as to their accuracy or completeness. Neither Scotiabank nor any of its officers, directors, partners, employees or affiliates accepts any liability whatsoever for any direct or consequential loss arising from any use of this report or its contents.
These reports are provided to you for informational purposes only. This report is not, and is not constructed as, an offer to sell or solicitation of any offer to buy any financial instrument, nor shall this report be construed as an opinion as to whether you should enter into any swap or trading strategy involving a swap or any other transaction. The information contained in this report is not intended to be, and does not constitute, a recommendation of a swap or trading strategy involving a swap within the meaning of U.S. Commodity Futures Trading Commission Regulation 23.434 and Appendix A thereto. This material is not intended to be individually tailored to your needs or characteristics and should not be viewed as a “call to action” or suggestion that you enter into a swap or trading strategy involving a swap or any other transaction. Scotiabank may engage in transactions in a manner inconsistent with the views discussed this report and may have positions, or be in the process of acquiring or disposing of positions, referred to in this report.
Scotiabank, its affiliates and any of their respective officers, directors and employees may from time to time take positions in currencies, act as managers, co-managers or underwriters of a public offering or act as principals or agents, deal in, own or act as market makers or advisors, brokers or commercial and/or investment bankers in relation to securities or related derivatives. As a result of these actions, Scotiabank may receive remuneration. All Scotiabank products and services are subject to the terms of applicable agreements and local regulations. Officers, directors and employees of Scotiabank and its affiliates may serve as directors of corporations.
Any securities discussed in this report may not be suitable for all investors. Scotiabank recommends that investors independently evaluate any issuer and security discussed in this report, and consult with any advisors they deem necessary prior to making any investment.
This report and all information, opinions and conclusions contained in it are protected by copyright. This information may not be reproduced without the prior express written consent of Scotiabank.
™ Trademark of The Bank of Nova Scotia. Used under license, where applicable.
Scotiabank, together with “Global Banking and Markets”, is a marketing name for the global corporate and investment banking and capital markets businesses of The Bank of Nova Scotia and certain of its affiliates in the countries where they operate, including; Scotiabank Europe plc; Scotiabank (Ireland) Designated Activity Company; Scotiabank Inverlat S.A., Institución de Banca Múltiple, Grupo Financiero Scotiabank Inverlat, Scotia Inverlat Casa de Bolsa, S.A. de C.V., Grupo Financiero Scotiabank Inverlat, Scotia Inverlat Derivados S.A. de C.V. – all members of the Scotiabank group and authorized users of the Scotiabank mark. The Bank of Nova Scotia is incorporated in Canada with limited liability and is authorised and regulated by the Office of the Superintendent of Financial Institutions Canada. The Bank of Nova Scotia is authorized by the UK Prudential Regulation Authority and is subject to regulation by the UK Financial Conduct Authority and limited regulation by the UK Prudential Regulation Authority. Details about the extent of The Bank of Nova Scotia's regulation by the UK Prudential Regulation Authority are available from us on request. Scotiabank Europe plc is authorized by the UK Prudential Regulation Authority and regulated by the UK Financial Conduct Authority and the UK Prudential Regulation Authority.
Scotiabank Inverlat, S.A., Scotia Inverlat Casa de Bolsa, S.A. de C.V, Grupo Financiero Scotiabank Inverlat, and Scotia Inverlat Derivados, S.A. de C.V., are each authorized and regulated by the Mexican financial authorities.
Not all products and services are offered in all jurisdictions. Services described are available in jurisdictions where permitted by law.