Next Week's Risk Dashboard
- US Q4 GDP growth is likely to be solid again…
- …but sustainability cracks are appearing
- What tax cut?? Most American households face a net tax hike this year
- Five studies all say the same thing about who is paying for Trump’s tariffs
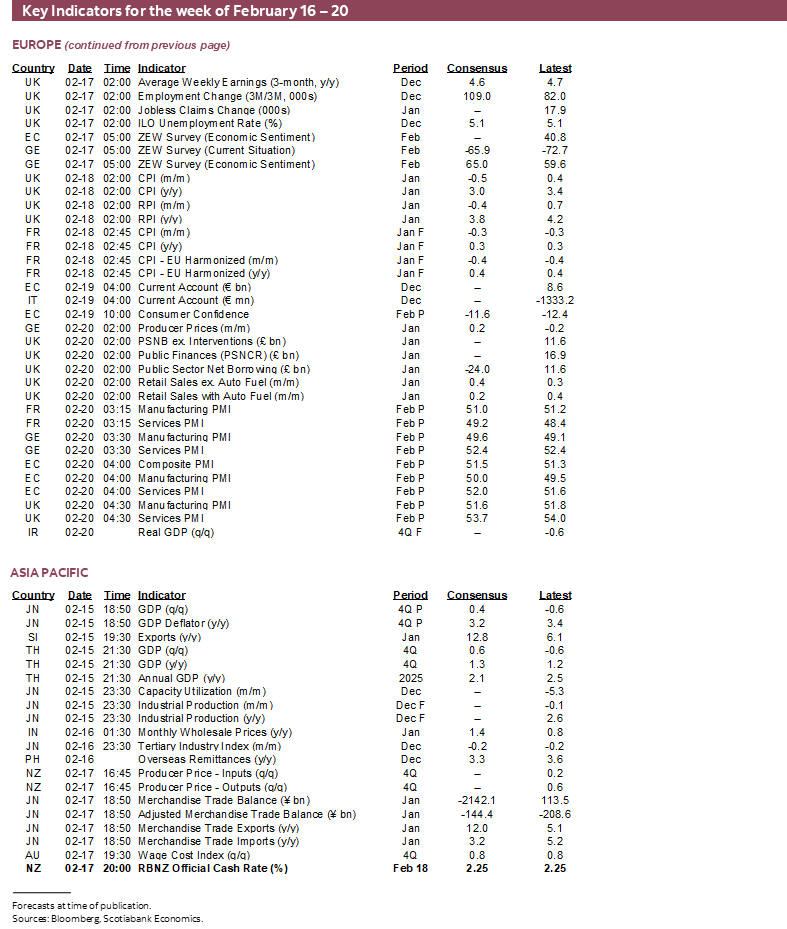
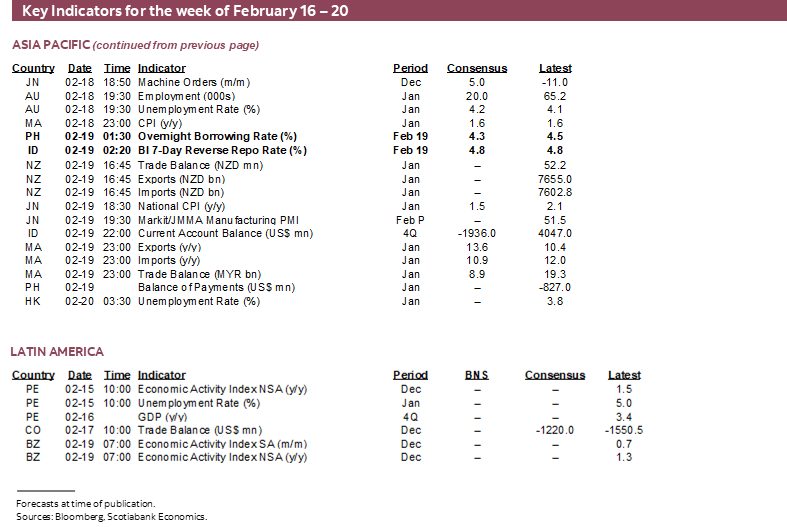
- Canadian CPI — sit this one out
- RBNZ to hold but watch forecasts
- BSP might cut after soft GDP
- Will BI surprise again?
- US PCE
- Global PMIs to inform early 2026 momentum
- Australian jobs & wages to inform RBA hike pricing
- A big Friday for UK macro
- SCOTUS watch returns, but don’t hold your breath about IEEPA
- Canadian, US markets shut Monday
- Global macro
Chart of the Week
US GROWTH IS STRONG—DON’T BLOW IT!
A shortened week for markets in Canada (Family Day) and the US (Presidents Day, note plural) on Monday will give way to a number of sources of global market risk. There will also be time for fun as we wish everyone a Happy Lunar New Year on Tuesday.
Friday brings the earliest possible day for SCOTUS to insert an opinion day for case decisions that may include IEEPA tariffs. Don’t hold your breath though. This piece notes that SCOTUS decisions are increasingly getting crunched toward the end of the court’s calendar in June before breaking.
Three regional central banks will weigh in. A wave of key macro reports will cover multiple regions of the world economy—including key reports on the health of the US economy which is where this weekly starts.
WHO’S PAYING FOR TRUMP’S TARIFFS?
Do Americans truly get a tax cut this year? Will tax refunds stemming from the continued aftermath of the ‘big beautiful bill’ in 2025 propel the consumer in 2026? This requires netting out the effects of tariffs and tax changes which is complicated but we can draw upon several estimates in doing so.
First up is who is paying for Trump’s tariffs. Five studies. Five separate, reputable groups. Different data sets. Different methodologies. All saying the same thing—that American businesses and consumers are paying for the Trump administration’s tariffs.
- Here’s one produced by the New York Federal Reserve’s economists.
- Here’s another produced by the Tax Foundation in the US; this one also links to prior studies dating back to Trump 1.0.
- Here’s another from the Kiel Institute for the World Economy (a German think tank).
- Here’s the analysis of the budget lab at Yale.
- Here’s the US Congressional Budget Office’s take. The CBO’s forecasts and analysis include Box 2–1 which says 70% of tariffs will be paid by consumers, 30% by US businesses and 5% by foreign exporters.
The estimates across the studies vary a little but are all generally in the same ballpark. And nobody needed these groups to tell you this. Economics 101 would have done so. Scotiabank Economics has long argued that the burden would be borne by Americans especially given little foreign appetite for retaliation.
Tariffs are a tax on Americans paid for by Americans and they negate the advantages of last year’s tax reductions through the ‘big beautiful bill’ that will positively impact this year’s tax refund season once more; refunds might be saved to implicitly pay for tariffs. Chart 1 shows that the estimated impact of higher tariffs swamps the estimated impact of the OBBBA tax cuts for the average household while chart 2 compares the impact of the two effects—higher taxes from tariffs and lower income taxes—upon individual income cohorts using the Tax Foundation’s modeling of how tariffs raise taxes as previously referenced, versus the effects of the BBB’s tax cuts (here).
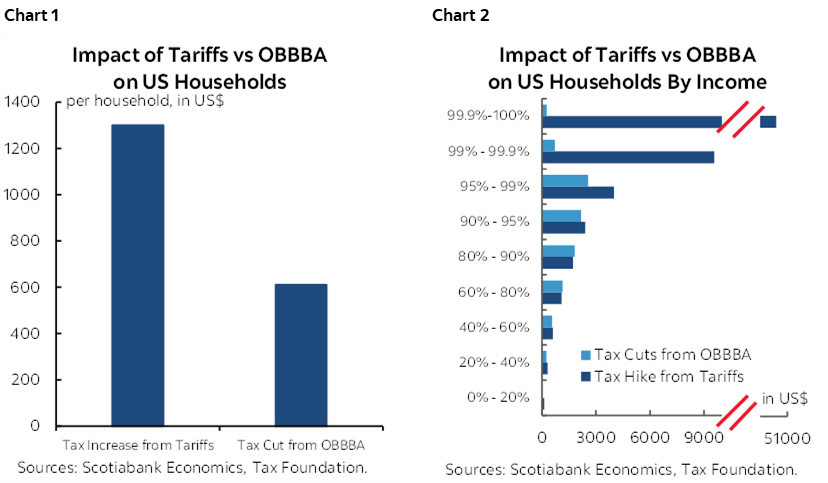
In short, fiscal policy including tariffs leaves most households worse off this year. Tariff revenues are being used to fund income tax cuts with no net welfare gain to the US economy. This does not even include the impact of reduced ACA health care subsidies on coverage.
THE US ECONOMY—STRONG GROWTH, QUESTIONABLE MOMENTUM AND BREADTH
We all benefit from a strong US economy. A strong dollar too. So don’t blow it. To that effect, what’s the current state of the US economy? Pretty darn good so far, but with some warning signs under the hood.
Q4 GDP is unlikely to blow it on Friday. I’ve loosely estimated growth of about 3½% q/q SAAR. Consensus is at 2.8% at the time of writing with estimates from 2½% to the upper 3s. The Atlanta Fed’s ‘nowcast’ sits at 3.7%. Unless revised, then the previous quarter’s growth rate was 4.4%.
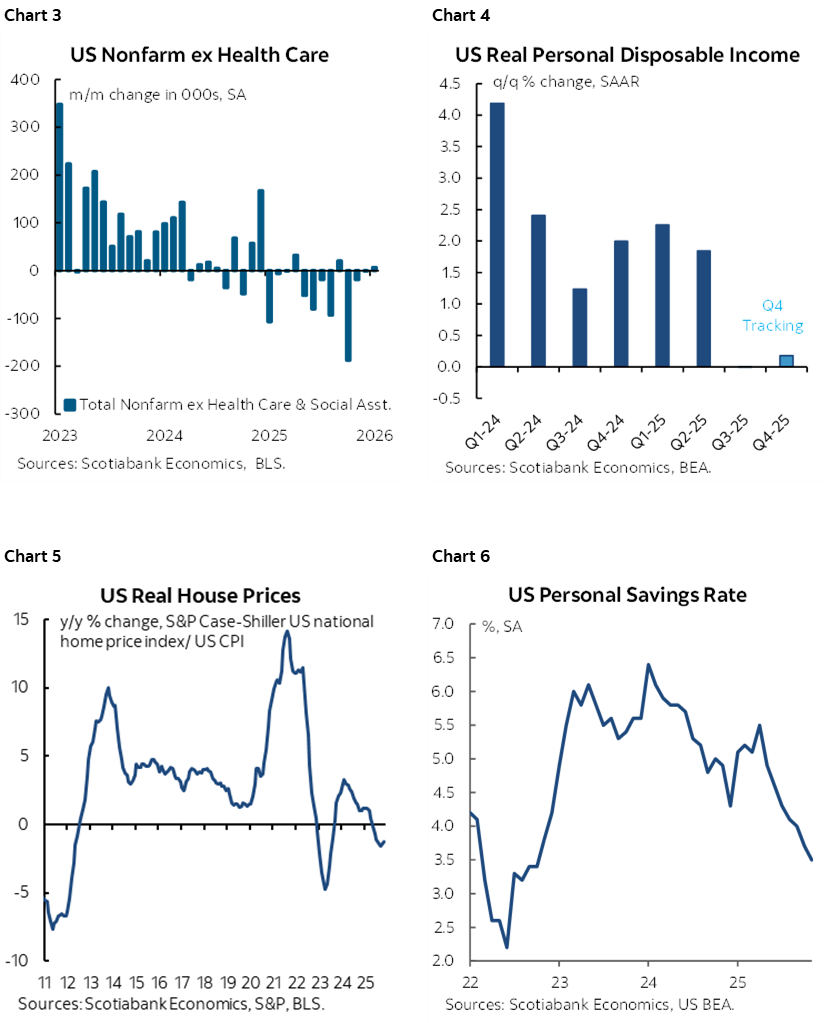
Consumption is tracking growth of around 2.9% q/q SAAR which is slower than the prior quarter’s 3½% but should still add just shy of 2% to GDP growth in weighted terms, down from 2.4% in Q3. Peak consumption growth was likely driven by a combination of factors such as tariff front-running, tax cuts and to buy e-vehicles before subsidies expired at the end of September. Now jobs (chart 3) and incomes (chart 4) have both slowed while the housing wealth effect is negative as indicated by falling real house prices (chart 5) that matter more to most Americans than equities. The personal saving rate has been falling (chart 6) as Americans attempt to smooth consumption by saving close to nothing in inflation-adjusted terms. A caveat is that we don’t have December total consumption yet and so we’re going off an estimate for services spending and the weakness in retail sales despite Cyber Monday landing in December this year.
Exports are tracking quarterly growth in the upper single digits during Q4 at an annualized pace over Q3. Imports are tracking an annualized contraction of a similar magnitude. Both should have the effect of raising net trade contributions to growth. Whether a narrower US trade deficit is a good thing or not depends upon why; export growth to front-run uncertainty and peak tariff pass through could be temporary and curtailing imports via higher prices is likely to crimp related consumption and investment activity. The US runs large current account deficits because a) it spends too much including governments and consumers, and b) it has attractive investment opportunities.
Residential investment is not expected to be a significant contributor to GDP growth. Business investment should be a modest contributor to growth base on readings like core durable goods shipments. Government spending is expected to be a drag partly because of the impact of the record-long government shutdown.
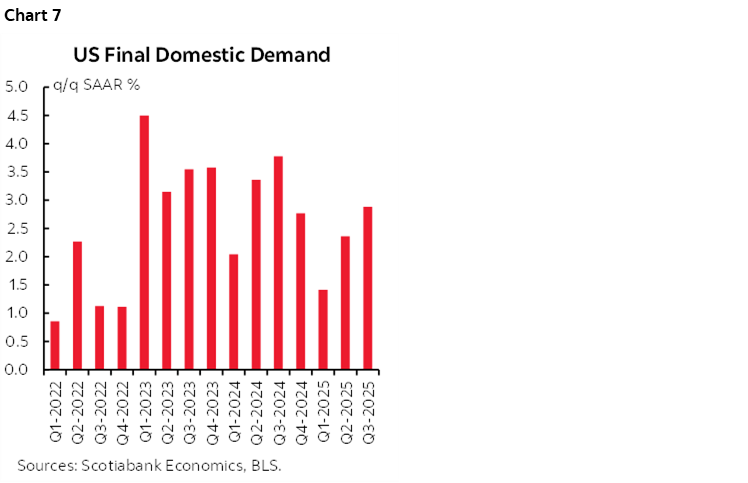
In all, the conditions for another solid gain in final domestic demand (consumption plus investment plus government spending) appear to be in place along with another solid net trade contribution Final domestic demand—a bellwether gauge of the domestic economy excluding inventories and trade—has been solid for an extended period (chart 7).
Most of this is an impressive performance compared to many other economies.
It’s encouraging that the US economy is posting stronger productivity growth as a key driver of GDP growth (chart 8). The second and third quarters both posted productivity gains of over 4% q/q SAAR. If the business sector component of GDP lands in the right ballpark of estimates, then when paired with modest 0.8% q/q SAAR growth in hours worked it should mean productivity growth was solid again in Q4.
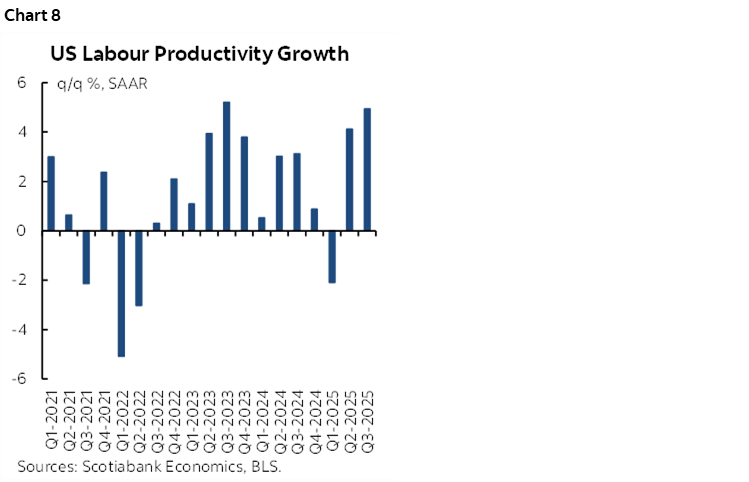
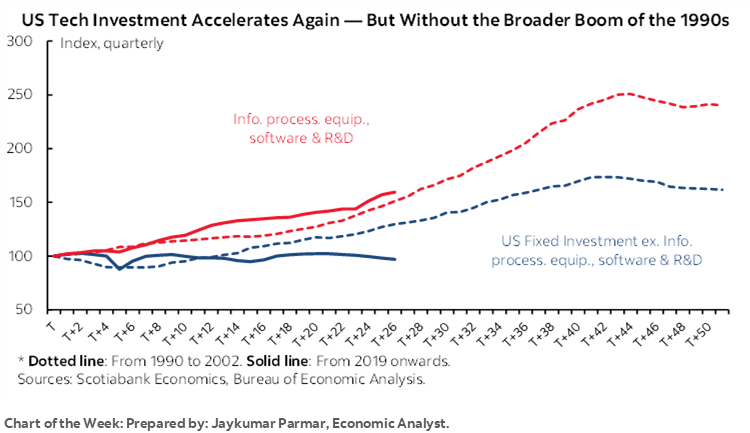
Why? Maybe because of brought-forward growth. It’s hard to pin it on investment. AI investment has been strong but concentrated while the rest of investment spending has been weak (chart 9).
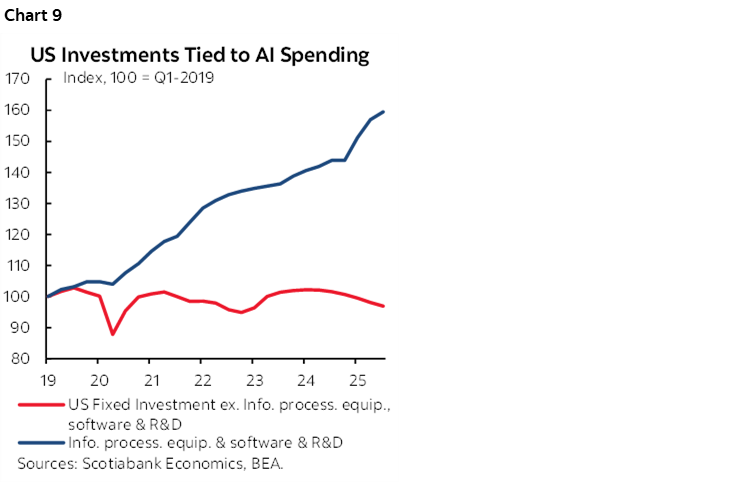
Jay Parmar’s chart of the week on the front cover compares this tech boom with the 1990s surge; what’s different this time around is that investment outside of tech is much weaker.
Still, companies are getting more out of their workforces as witnessed by a soft trend in economy-wide hours worked. This isn’t really new to Trump 2.0; it’s been going on for quite some time and well before AI really started to take off.
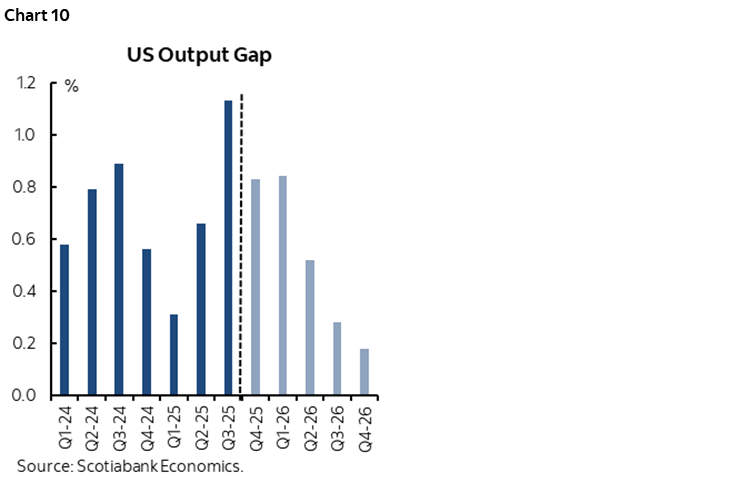
It’s imperative that the US economy continues to achieve such productivity strength. It’s the best hope to contain inflationary pressures for an economy in excess aggregate demand that continues to pressure inflation at a still highly nascent stage for changes across global supply chains and related cost pressures (chart 10). It’s the best hope for much of the world economy. It’s the best hope for risk appetite across everything from stocks to credit to cybercurrencies and beyond.
Yet there are growth sustainability concerns that are not insurmountable but would be foolish to ignore. Tax cuts helped last year, but the net effect of tariffs and tax cuts is a bust this year. Policy uncertainty is growth dampening on cap-ex budgets and consumer confidence. The lagging effects of much tighter immigration policy have not yet fully impacted the economy. Some of last year’s growth was pulled forward by fiscal policy and tariff avoidance behaviour. Growth can’t just rely upon AI alone, not least of which because its net effects are highly uncertain—and so is its sustainability at a similar pace of growth.
CANADIAN INFLATION—SIT THIS ONE OUT
Another CPI report comes knocking on Tuesday, this time covering the month of January. This is one of two readings before the next Bank of Canada decision on March 18th. Nevertheless, the BoC is sending obvious signals that it has no intention of doing much of anything anytime soon.
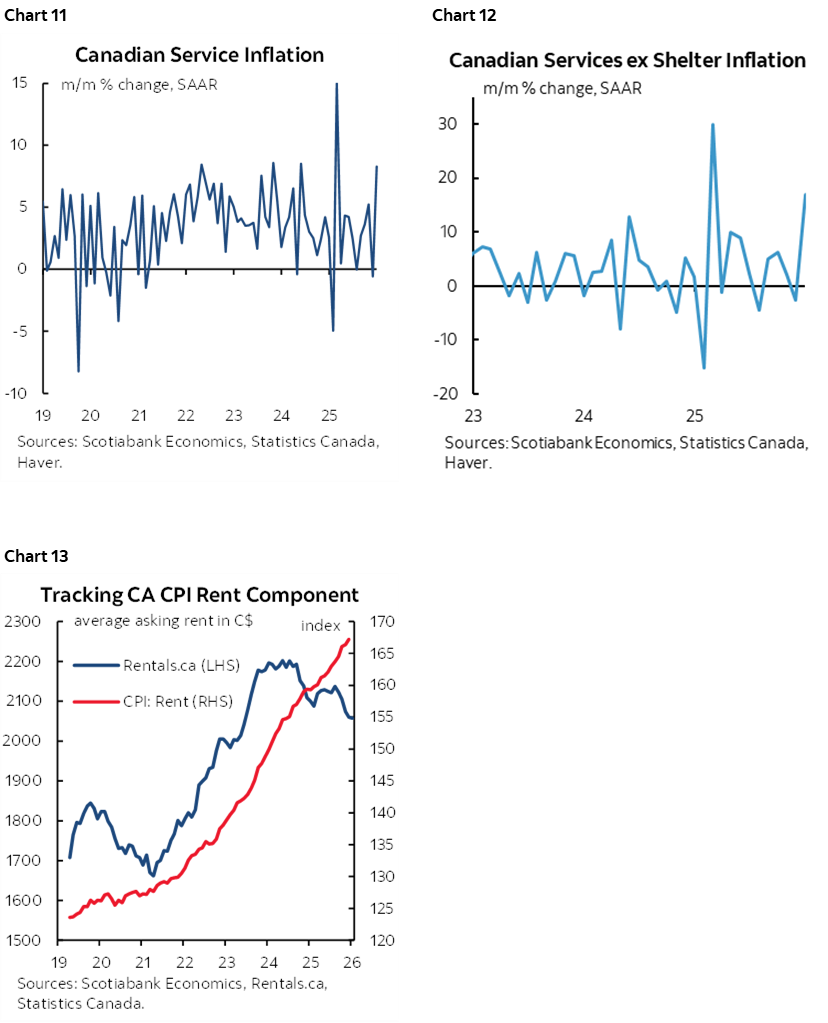
For total CPI, a rise of just 0.1% m/m in seasonally unadjusted terms is expected that should leave the year-over-year rate unchanged at 2.4%. January is a seasonal up-month for key prices. Gasoline should make little contribution. Shelter inflation has ebbed which affects about one-quarter of the CPI basket but service price inflation in general remains warm (chart 11) given service price inflation ex-shelter (chart 12). How rent is captured in CPI differs strongly from market gauges (chart 13).
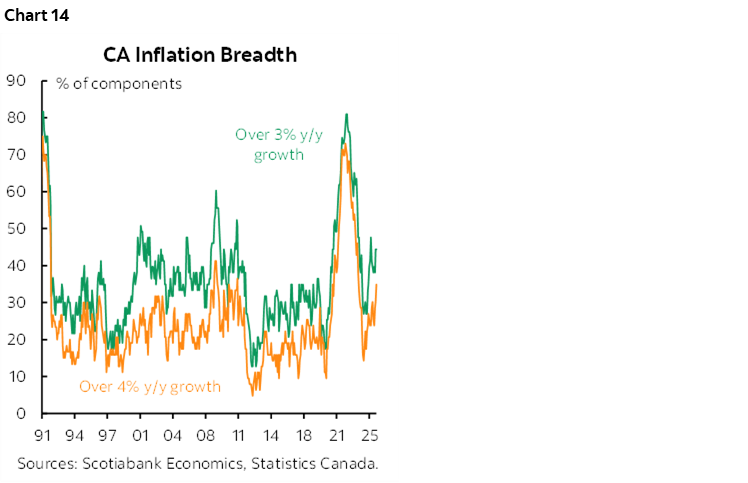
Key as always are underlying core inflation and rising breadth (chart 14).
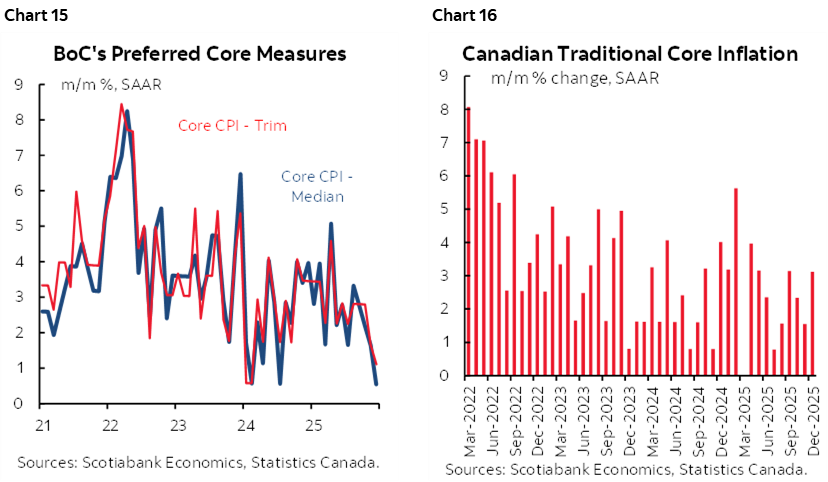
As for core, it depends upon the measure. December’s trimmed mean CPI (0.5% m/m SAAR) and weighted median CPI (1.1% m/m SAAR) were rather soft (chart 15). Today’s readings are similar to the start of 2024 before they accelerated; the BoC is likely to want much more evidence this time is not transitory. Traditional core CPI ex-food and energy was not soft (3.1% m/m SAAR, chart 16). Ditto for three-month moving averages of 1.5% for trimmed mean, 1.9% for weighted median and 2.3% for traditional core. The Bank of Canada has recently adopted the practice of ignoring traditional core which goes against their prior guidance that somewhat discounted the other measures. It seems their favourite measure is a malleable concept.
Because of these conflicting signals the BoC is likely to fade quite a bit more inflation data. The January MPR anticipated headline CPI average 2% y/y over 2026Q1 with the average of the trimmed mean and weighted median core gauges a half point higher than that. Headline CPI will jump higher thereafter in year-over-year terms once the effects of last April’s elimination of the consumer portion of the carbon tax drops out of the year-ago comparison.
Macklem’s core message to markets in his recent speech was to avoid paying sole attention to the activity demand-side readings as they’ll be grappling with trying to understand influences from cyclical versus structural drivers. Until they have clarity on this—which could take a long time—they won’t be cutting or hiking. The BoC has matured in its treatment of the supply side of the economy after having largely dismissed the negative supply side shocks of the pandemic while letting inflation get out of control. Macklem’s term expires next year and likely doesn’t wish to repeat this experience.
Our foundations for a future tightening bias include a starting point of a zero real policy rate at the lower bound of neutral rate estimates that offers insurance against downside risks. It’s too soon to evaluate the full effects of past monetary easing.
We expect the economy to gradually gain traction through fiscal policy, distance from initial trade shocks, and an eventual release of pent-up demand for cap-ex, consumption and housing investment. Zero population growth is an exaggerated shock as it is mostly due to temps.
The most likely CUSMA scenarios are a successful negotiation or a protracted period of annual reviews. The economy can adapt to either scenario. Almost 90% of Canadian exports to the US are tariff free and CAD has depreciated 16 cents from its 2021 peak.
Spare capacity is expected to be shut over our forecast horizon while supply side constraints and rising cost pressures merit continued caution on inflation risk.
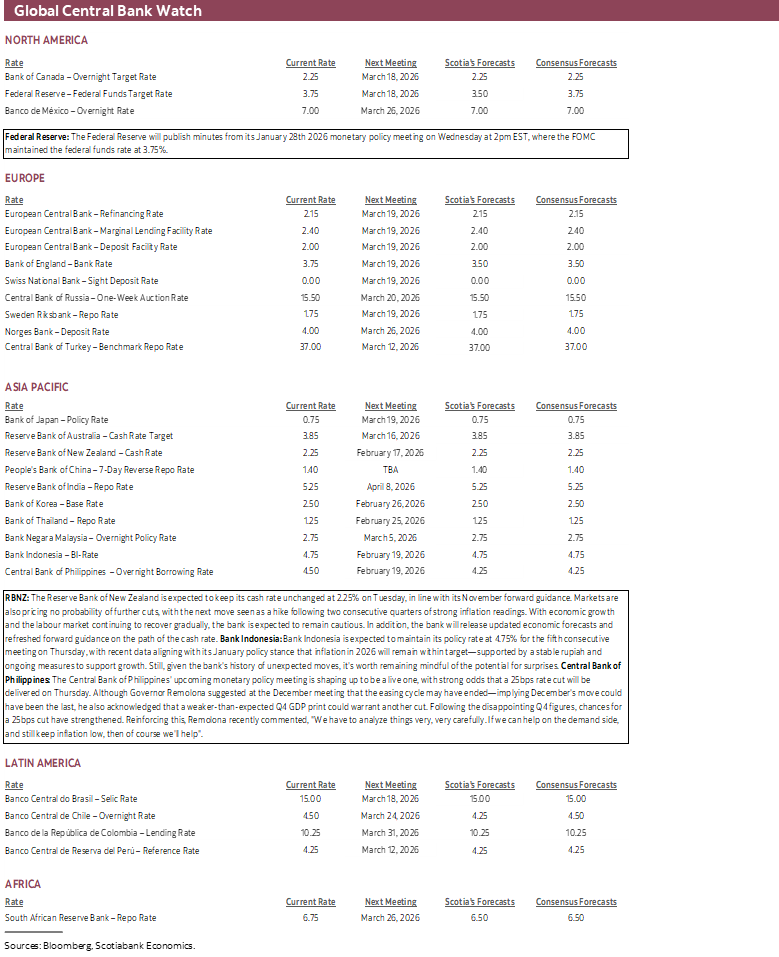
CENTRAL BANKS—SOMEONE SPICE IT UP!
Three central banks will weigh in with policy rate decisions this week but only one of them is expected to cut.
RBNZ—Not This One
No one expects New Zealand’s central bank to change its 2.25% cash rate on Tuesday evening (ET).
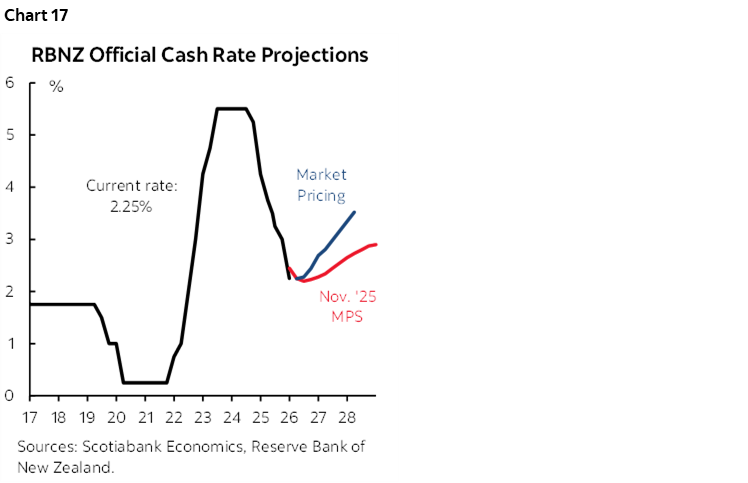
For one thing, their prior explicit policy rate guidance back in November continued to show the expectation that the next move will be up but not for some time (chart 17).
Job growth recently rebounded by 0.5% q/q SA in Q4 but from a weak prior trend. Moderate wage inflation is steady. Inflation has been persistently above-target (chart 18).
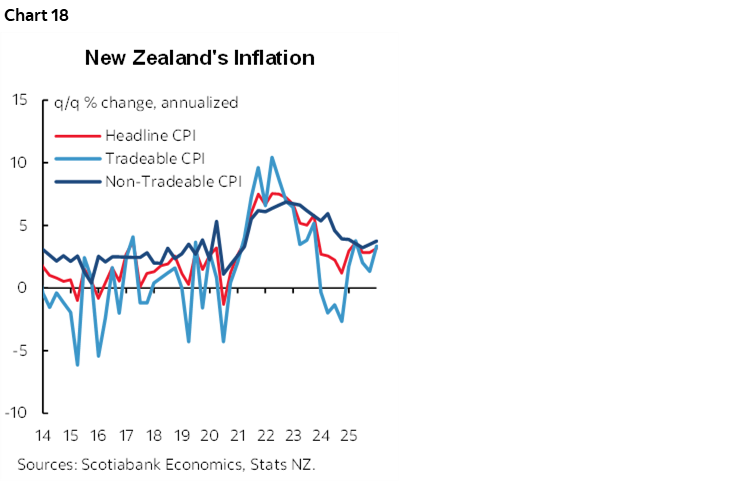
Fresh forecasts are expected with this meeting and key may be refreshed guidance around estimates of spare capacity and when the RBNZ expects inflation to durably fall to 2%. That point was previously mid-2026 but inflation continues to surprise to the upside (3.1% in Q4).
Bank Indonesia—Nor This One
Most within consensus expect BI to hold its policy rate steady at 4.75% but a small minority thinks a cut might be in order. A constraining factor may be moderate weakening of the rupiah this month and lagging pass through of the roughly 10% depreciation to the dollar in the past year-and-a-half. BI often emphasizes inflation risk and stability concerns related to FX movements.
Inflation has been moving back up of late. CPI jumped by over half a point in January to about 3½% y/y. GDP growth beat expectations in Q4 at 5.4% y/y.
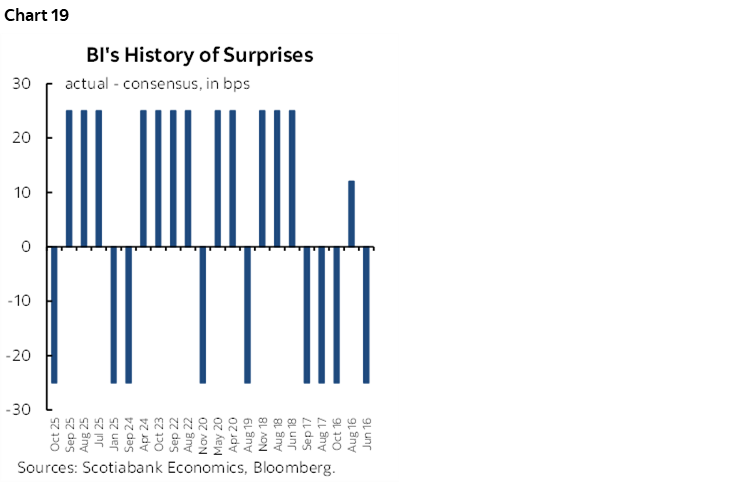
Against such arguments for a hold is the surprise factor. BI is one of the global central banks most prone to surprising markets and forecasters (chart 19).
Central Bank of the Philippines—Maybe This One
BSP could cut its overnight borrowing rate by 25bps to 4.25% on Thursday morning. Several forecasters think so. Markets are not terribly convinced.
Two hundred basis points of cuts have been delivered since about mid-2024. Governor Remolona said on December 11th when they last cut that cuts “may have ended already. This may be the last cut.”
Since then, however, Q4 GDP growth disappointed and the prior quarter’s growth was revised lower. Inflation edged up a bit to 2% y/y. With inflation still moderate and growth disappointing, Remolona’s following guidance might keep a cut bias alive: ”If we can help on the demand side, and still keep inflation low, then of course we'll help".
GLOBAL MACRO—SOMETHING FOR EVERYONE
The coming week will help markets understand momentum across the global economy through PMIs and limited GDP readings from Japan and LatAm, the state of Canadian, US and UK consumers and inflation risk in each market, more about the dialogue at the Fed, and what shape Australia’s and the UK’s job markets are in.
One such batch of data will be the monthly parade of purchasing managers’ indices. Australia and Japan kick if off on Thursday followed by India, the Eurozone with separate releases for Germany and France, the UK and US into Friday. These readings will once again inform developments across supply chains, momentum in new orders across manufacturing and service sectors, pricing behaviour, hiring patterns and investment appetite. They are timely ‘soft’ data indications of momentum in the global economy.
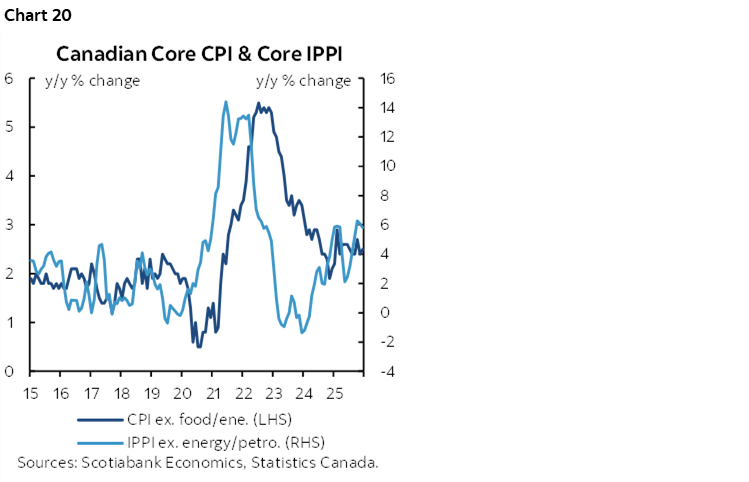
Canadian markets will catch up to Monday’s housing starts and manufacturing reports when markets return from the Family Day long weekend on Tuesday. These are minor gauges, as are most of the rest of the week’s measures other than CPI. Wholesale sales (Tuesday), existing home sales in January (Wednesday), trade figures for December (Thursday), and then retail sales and producer prices on Friday round out the line-up. Of these, I would pay attention to retail sales that have been growing softly but miss about 60% of Canadian consumer spending by not including any services or cross-border shopping and to producer prices that are a harbinger of future core CPI inflation (chart 20).
A heavy line-up will great US economy watchers when US markets reopen on Tuesday. It starts off slow on Tuesday (Empire, homebuilder confidence), but then Wednesday brings out FOMC minutes, housing starts for both November and December, durable goods orders in December and industrial production in January. Trade, claims and pending home sales are due Thursday. Friday is the big day not only because of the aforementioned GDP, but also because that’s when income and spending figures for December, the Fed’s preferred PCE inflation measures for December, and new home sales for both November and December get released.
Across Asia-Pacific markets, watch for Australia’s jobs report for January (Wednesday) and Australian Q4 wages (Tuesday) that may impact market pricing for additional RBA hikes. Japan’s economy is expected to rebound in Q4 GDP (Monday) while core CPI remains above the 2% BoJ target (Thursday).
LatAm markets face a docket of releases focused upon GDP measures. Monthly economic activity readings that are GDP proxies will be updated for December by Peru (Sunday) and Brazil (Thursday). Colombia’s Q4 GDP growth is expected to slow.
European observers will be mainly focused upon UK macro reports. First will be updated job and wage figures for December and January on Tuesday, then CPI on Wednesday and then retail sales on Friday.
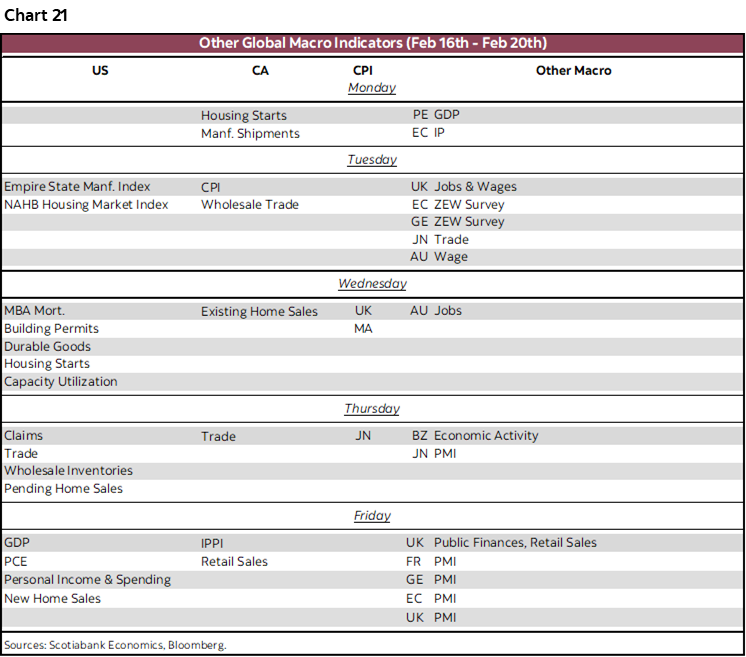
Chart 21 summarizes the week’s indicator line-up.

DISCLAIMER
This report has been prepared by Scotiabank Economics as a resource for the clients of Scotiabank. Opinions, estimates and projections contained herein are our own as of the date hereof and are subject to change without notice. The information and opinions contained herein have been compiled or arrived at from sources believed reliable but no representation or warranty, express or implied, is made as to their accuracy or completeness. Neither Scotiabank nor any of its officers, directors, partners, employees or affiliates accepts any liability whatsoever for any direct or consequential loss arising from any use of this report or its contents.
These reports are provided to you for informational purposes only. This report is not, and is not constructed as, an offer to sell or solicitation of any offer to buy any financial instrument, nor shall this report be construed as an opinion as to whether you should enter into any swap or trading strategy involving a swap or any other transaction. The information contained in this report is not intended to be, and does not constitute, a recommendation of a swap or trading strategy involving a swap within the meaning of U.S. Commodity Futures Trading Commission Regulation 23.434 and Appendix A thereto. This material is not intended to be individually tailored to your needs or characteristics and should not be viewed as a “call to action” or suggestion that you enter into a swap or trading strategy involving a swap or any other transaction. Scotiabank may engage in transactions in a manner inconsistent with the views discussed this report and may have positions, or be in the process of acquiring or disposing of positions, referred to in this report.
Scotiabank, its affiliates and any of their respective officers, directors and employees may from time to time take positions in currencies, act as managers, co-managers or underwriters of a public offering or act as principals or agents, deal in, own or act as market makers or advisors, brokers or commercial and/or investment bankers in relation to securities or related derivatives. As a result of these actions, Scotiabank may receive remuneration. All Scotiabank products and services are subject to the terms of applicable agreements and local regulations. Officers, directors and employees of Scotiabank and its affiliates may serve as directors of corporations.
Any securities discussed in this report may not be suitable for all investors. Scotiabank recommends that investors independently evaluate any issuer and security discussed in this report, and consult with any advisors they deem necessary prior to making any investment.
This report and all information, opinions and conclusions contained in it are protected by copyright. This information may not be reproduced without the prior express written consent of Scotiabank.
™ Trademark of The Bank of Nova Scotia. Used under license, where applicable.
Scotiabank, together with “Global Banking and Markets”, is a marketing name for the global corporate and investment banking and capital markets businesses of The Bank of Nova Scotia and certain of its affiliates in the countries where they operate, including; Scotiabank Europe plc; Scotiabank (Ireland) Designated Activity Company; Scotiabank Inverlat S.A., Institución de Banca Múltiple, Grupo Financiero Scotiabank Inverlat, Scotia Inverlat Casa de Bolsa, S.A. de C.V., Grupo Financiero Scotiabank Inverlat, Scotia Inverlat Derivados S.A. de C.V. – all members of the Scotiabank group and authorized users of the Scotiabank mark. The Bank of Nova Scotia is incorporated in Canada with limited liability and is authorised and regulated by the Office of the Superintendent of Financial Institutions Canada. The Bank of Nova Scotia is authorized by the UK Prudential Regulation Authority and is subject to regulation by the UK Financial Conduct Authority and limited regulation by the UK Prudential Regulation Authority. Details about the extent of The Bank of Nova Scotia's regulation by the UK Prudential Regulation Authority are available from us on request. Scotiabank Europe plc is authorized by the UK Prudential Regulation Authority and regulated by the UK Financial Conduct Authority and the UK Prudential Regulation Authority.
Scotiabank Inverlat, S.A., Scotia Inverlat Casa de Bolsa, S.A. de C.V, Grupo Financiero Scotiabank Inverlat, and Scotia Inverlat Derivados, S.A. de C.V., are each authorized and regulated by the Mexican financial authorities.
Not all products and services are offered in all jurisdictions. Services described are available in jurisdictions where permitted by law.