Next Week's Risk Dashboard
- Japanese election primer — much is at stake for Japan and the world
- Warning signs on the US economy…
- …include a broad array of deteriorating labour market readings…
- …weakness in cap-ex outside of AI…
- …as AI pressures costs
- Delayed nonfarm payrolls beckon
- Why the US job market appears to be teetering…
- …and why Powell may be downplaying it
- US CPI — hope you’re not superstitious
- BoC ‘minutes’ and AI implications
- BCRP likely to hold
- Ditto for Russia’s central bank
- Global macro
Chart of the Week
An active week will kick off with Japan’s election results that could mark a new dawn for the country and with potentially strong implications for global markets and geopolitical developments over time. The results will quickly give way to key readings on the US economy including the delayed nonfarm payrolls report and another inflation reading that could inform potential expectations for US monetary policy. As Japan’s global influence may be rising, there are evidence-based reasons to be concerned about the US job market, investment outside of AI, and AI’s potential contributions to inflation risk. Only two central banks will weigh in (Peru, Russia) but a round of Fed-speak around the data releases could be instructive. A few gems exist on the rest of the global line-up but without further ado let’s dive into expectations and background for the coming week’s major developments.
JAPAN’S ELECTION—MUCH AT STAKE FOR JAPAN AND THE WORLD
Japan’s snap election will be held on Sunday and could potentially impact local and global markets. Polls open at 7am (Japan Standard Time) and shut at 8pm JST. Results of the record-short 16-day campaign may be known as soon as that evening in Japan, and hence into the Monday morning market openings across Europe and North America given a 14-hour time difference between Tokyo and the Eastern Time Zone.
At stake is the political future of the nascent administration of PM Sanae Takaichi and the futures of all 465 holders of seats in the House of Representatives, the lower chamber of the Diet. Elected in October, she is testing her mettle before the electorate in an effort to secure a majority in support of potentially ambitious plans.
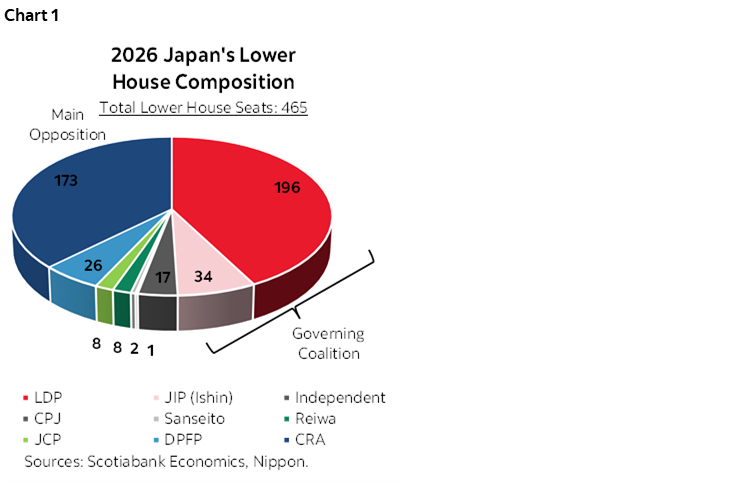
Recall that her Labour Democratic Party and its coalition partner at the time—the Komeito Party—lost their majority in the October 2024 general election and then suffered a further setback by losing the coalition’s majority in the House of Councillors—the upper house of the Diet—in July of last year. Former PM Ishiba resigned after initially putting up a fight, paving the way for an LDP leadership contest that Takaichi won with her spirited campaign. Chart 1 shows the present composition of the Lower House by party.
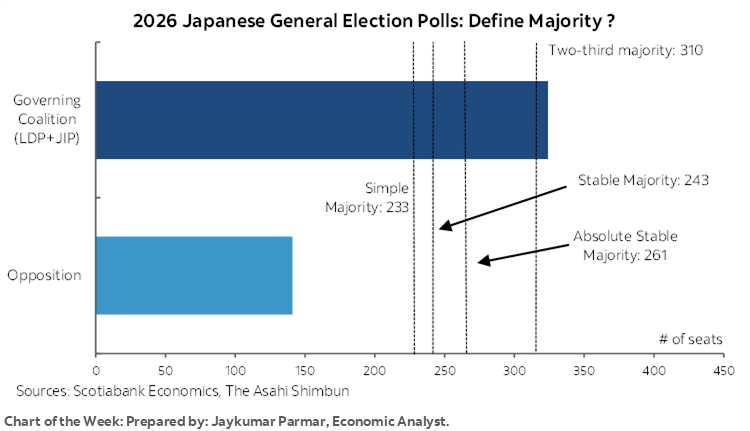
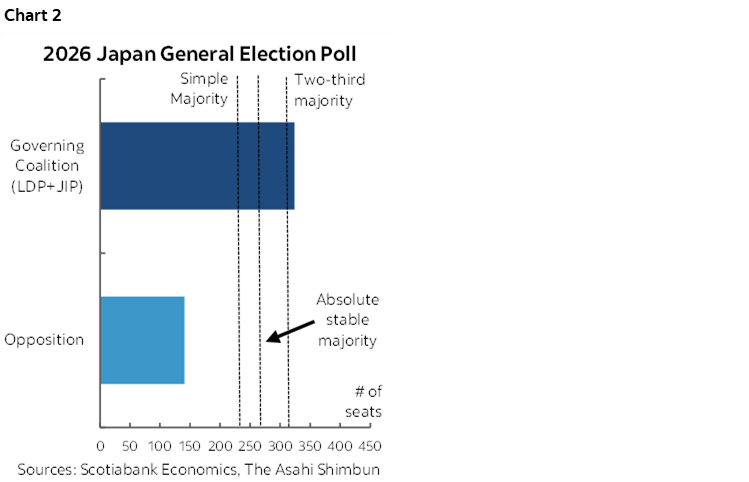
Polls show the LDP and its new coalition partner—the Japan Innovation Party—picking up a growing share of the undecided voters and much better than the prior disastrous elections (chart 2, and Jay Parmar’s chart of the week). Two recent polls (here and here) indicate that Takaichi’s high risk bet to capitalize upon her popular momentum may pay off rather handsomely. The polls indicate that over 300 out of the 465 seats in the lower house could be snagged by her coalition, up from 230 going in and hence just shy of a 233-seat simple majority.
Only that in Japan, a majority comes in multiple flavours. A more stable majority is viewed as requiring 243 or more seats that would give the coalition room to chair all permanent lower house committees while ensuring at least parity to opposition committee memberships. An absolute majority is viewed as requiring 261 seats which would enable the coalition to chair and possess a majority of seats in the powerful committees. Further yet would be a 310 super majority that would enable the LDP/JIP coalition to enact changes to Japan’s Constitution and override Upper House rulings with a two-thirds vote which matters since the Coalition does not hold enough seats in the Upper House.
Noteworthy is Takaichi’s claim she will step down if her coalition does not win a majority but of what size isn’t clear.
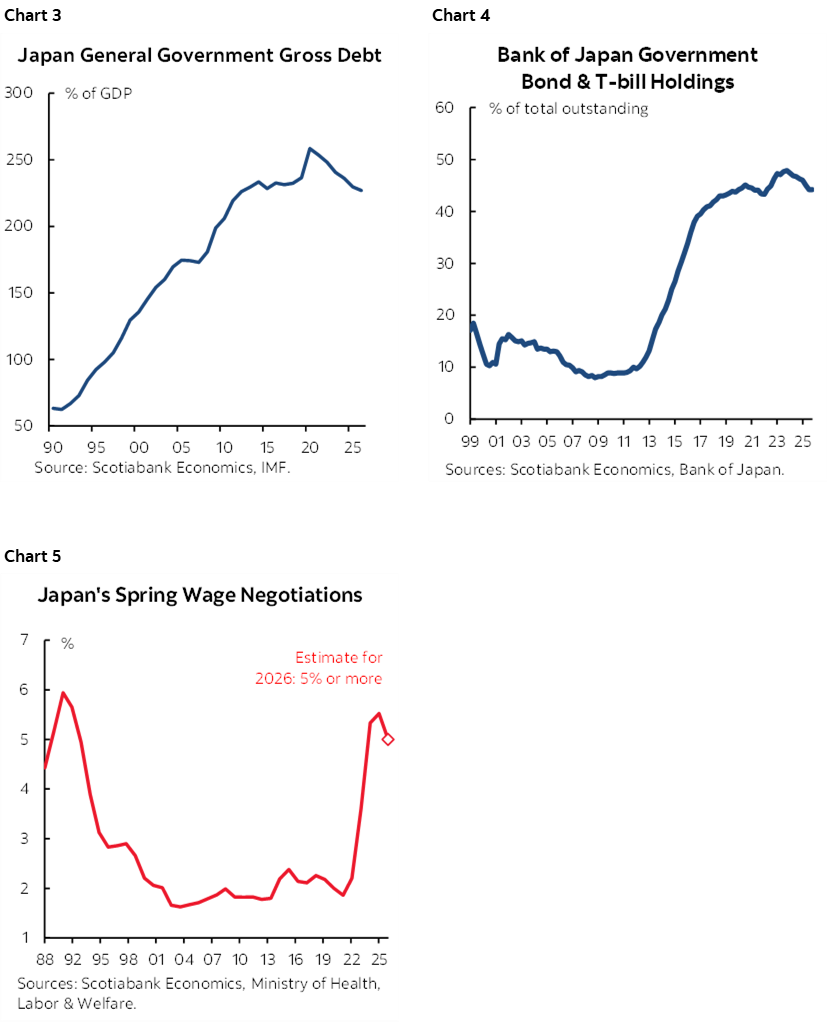
Depending upon the outcome, we’re left with the perennial debate over whether markets will prefer a system of checks and balances or a very strong majority outcome and what may be the range of potential policy outcomes under the various scenarios. They will evaluate the outcome in the context of massive debt (chart 3) and the Bank of Japan’s already bloated role in the JGBs market that is more closed than other bond markets (chart 4). Monetary policy independence will be crucial as overdoing it on fiscal stimulus may prompt BoJ Governor Ueda to favour larger rate hikes than the 50bps presently priced into markets for the duration of this year. The upcoming round of Spring “Shunto” wage negotiations with unions that governs under 20% of Japanese workers is expected to register a third year of 5%+ gains (chart 5) which could add to the BoJ’s confidence to continue hiking.
Much has been written about PM Takaichi regarding her roots, her colourful personality, and her policy leanings. She is tagged by markets as a fiscal expansionist. This may not be fully accurate and her supporters that have known her for a lengthy period describe her as methodical and careful, not reckless.
Still, she is schooled under policy leanings that depict her as a change agent. She cites Margaret Thatcher as a role model and is viewed as a protégé of the late PM Shinzo Abe and his brand of policy measures under the ‘Abenomics’ rubric that sought expansionist fiscal and monetary policies alongside regulatory reforms. Abenomics’ partial success may have only really begun to emerge in the years following his assassination on July 8th, 2022. Can she pull off further demand stimulus and supply side reforms that appease market concerns? Can her curious brand of social conservatism and colourful background win over voters? Will her antagonistic style toward China including overt involvement in Taiwanese politics open the door to greater regional frictions? Is a new Japan rising with a much greater emphasis upon defence spending and increased role in geopolitical affairs?
On fiscal policy, Takaichi’s bold 2026 budget (¥122.3 trillion/US$780B) has yet to be approved by Parliament, hence a motivator for an election call. With the clear caution that words may not translate into policy action—or that a strong majority may not elicit further proposals—here are some highlights of what may be at stake in the election.
- Takaichi touts “Responsible active fiscal policy” which risks appearing to markets as Orwellian doublespeak. She maintains that fiscal expansion will be addressed by non-tax revenues and the overhaul of special tax exemptions (trimming subsidies, scaling back preferential corporate tax treatments and expanding non-tax revenues), without resorting to deficit financed bond issuance. However, no clear funding sources are mentioned in the pledges and there are sure to be many special interests in opposition to some of these moves.
- Inflation is the primary focus of the election campaign. A consumption tax cut can be one of the tools, although it comes with a big cost and mixed effects on inflation over time. The opposition party (CRA) favours abolishing the food tax permanently while the LDP is looking for a 2-year exemption. Electricity and gas subsidies, as well as cash supports for households and families with children are also on the table.
- Takaichi seeks to raise the income tax deduction and abolish temporary gasoline and diesel taxes.
- She also seeks to shift growth away from Tokyo and into regional areas of Japan through policies such as the creation of regional industrial clusters.
- On geopolitical matters, Takaichi has placed emphasis upon strengthen the Japan-US alliance, and said that any attack on Taiwan would constitute a “survival-threatening situation” for Japan.
- As an offshoot of geopolitical ambitions, her administration’s draft budget seeks a nearly 4% increase in defence spending in 2026 (US$58 billion) to construct more ships and aircraft. Globally, there has perhaps not been a better time for the defence establishment in many decades…
- If she wins the vaunted super majority, then Takaichi seeks to push for Constitutional reform including explicit recognition for the Self-Defense Forces, improved political transparency, and a reduction of the size of the lower house and reformed political funding rules.
- Takaichi’s stance on immigration is challenging to an aging population that has struggled with integrating foreign arrivals. She seeks to take a stricter, more rules-based approach including a crack down on illegal stays.
- The LDP’s partner—the JIP—has campaigned on cutting down the size of government including a targeted 10% seat reduction in the next Diet.
NONFARM PREVIEW—MOUNTING EVIDENCE OF A DETERIORATING JOB MARKET
The delayed nonfarm payrolls reading for January arrives on Wednesday. I'm more confident in my below consensus reading of 0k after this past week's readings. I think there is more downside than upside risk to 0k. See the earlier preview here and supplemented by the following points.
A significant caveat is always that nonfarm is its own beast with its own quirky methods. Confidence bands have risen over the years because of intensifying data deficiencies. Seasonal adjustment factors can be subject to a recency bias (I went with another record low for months of January this time). Birth-death model adjustments create uncertain effects this time. I expect downward revisions, but how much so could impact the jumping off point. Annual benchmarking revisions this time will knock around 900k or so off of last March.
Having said that, a broad array of readings is indicating that the job market is sharply weakening. In no real order are the following observations:
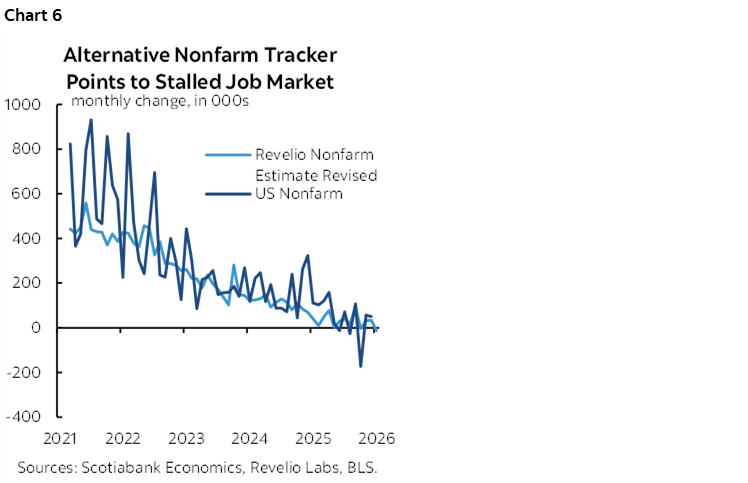
- Revelio’s nonfarm proxy fell by -13k in January. It offers limited tracking ability (chart 6).
- ISM-services-employment fell to 50.3 from 51.7 (50 divides contraction below from expansion above).
- ISM-mfrg-employment indicated a slower pace of contraction in manufacturing employment from 44.9 to 48.1, but manufacturing is a small share of total employment.
- Homebase (a measure of hourly paid workers) fell faster in January relative to December. It's not seasonally adjusted but this January and prior months have been tracking the weakest readings since they started in 2020.
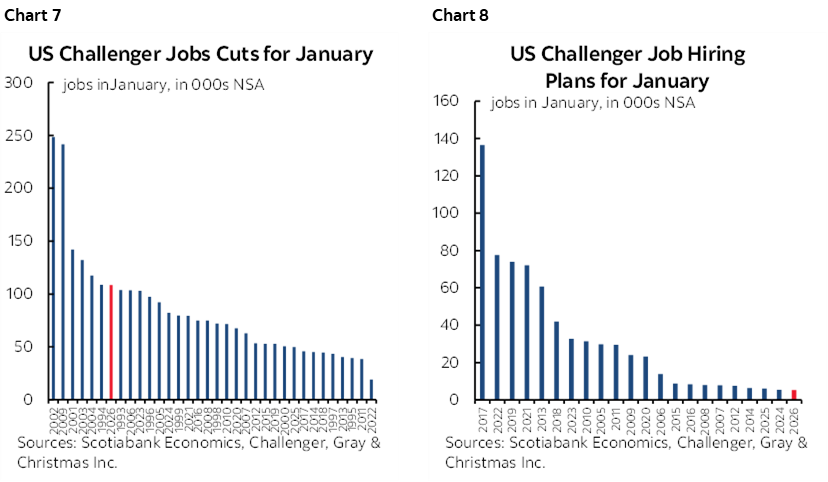
- Challenger layoffs climbed to 108.4k last month which was the highest since October. Challenger hiring was the lowest on record for a month of January (the comparator I use because it's seasonally unadjusted data). Charts 7–8.
- initial claims fell between reference periods. This offers the rare glimmer of hope, but claims could operate with a lag and don’t reflect hiring per se.
- continuing claims fell between reference periods which contributes to expectations for a lower unemployment rate derived from the household survey where I went with a downtick, given expectations for continued labour force contraction but moderated jobs in that companion survey.
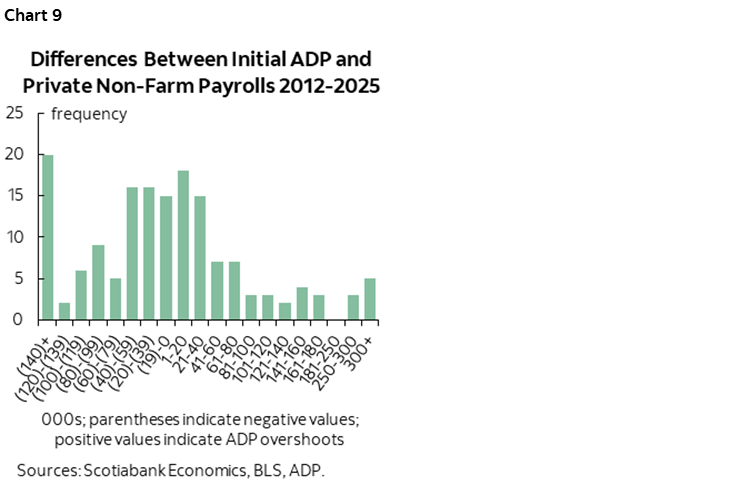
- ADP private payrolls fell by 22k. There are about 70% odds that the change in private nonfarm payrolls lands at the same or lower number based on historical spreads between *initial* pre-revision readings (chart 9).
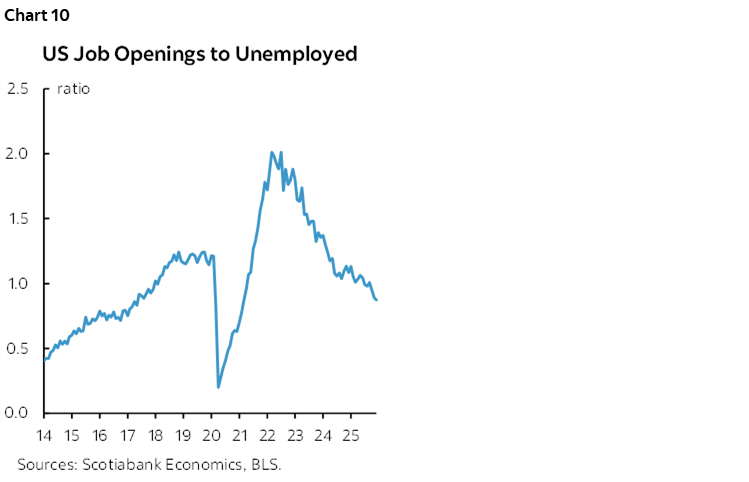
- JOLTS job openings plunged to 6.54 million, down almost half a million in December and the lowest reading since the pandemic year of 2020. The openings-to-unemployed ratio is now well below 1.0 for two months, indicating that incremental slack is emerging in the US labour market at the margin as fewer openings are emerging relative to the number of unemployed (chart 10). There is now less than one job opening available per unemployed American.
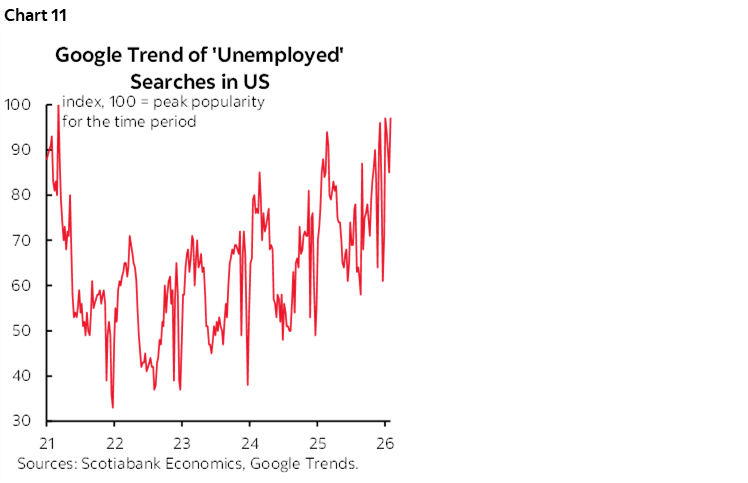
- Apparently Americans are increasingly concerned (chart 11).
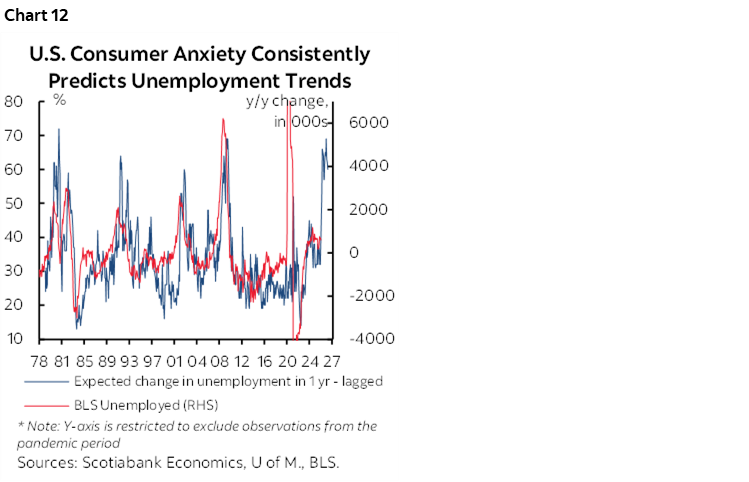
- US consumers are also signalling expectations for a large jump in unemployment in future based on readings within UofM consumer sentiment (chart 12). This is soft sentiment data, but don’t necessarily dismiss it. The chart shows a high correlation between what consumers expect to happen to the change in the number of unemployed over the coming year and what actually happens. They are closer to employer guidance on employment conditions than economists and markets.
As for why the job market is teetering, I'd rank the reasons in the following order:
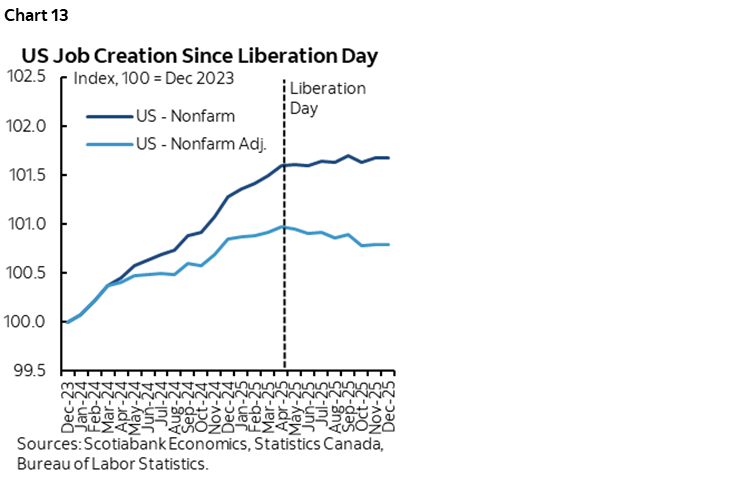
- Tariffs and policy uncertainty: It's no coincidence payrolls were on an upward trend until 'Liberation Day' and then lost momentum. Chart 13 shows actual payroll levels and payroll levels adjusted for revisions yet to be incorporated. Companies are responding by slashing controllable costs like payrolls.
- Immigration policy: I get the need to control borders and the economic case for doing so in terms of planning schools, infrastructure, etc. But it is going too far from the standpoint of the health of the economy.
- I'm sceptical toward AI. The argument is that there may be a shift toward a higher capital:labour ratio in favour of less hiring. That doesn’t hold much water. Tech investment is heavy, but tech firings are a limited part of the softening labour market. More important is the opposite argument. Capital investment and jobs can often be cyclically complementary (eg. someone has to operate the drill press) and maybe they are behaving as such but in reverse this time for most of the economy once we take tech out of the picture where there is limited evidence of weakening jobs. The rest of the economy is shrinking both cap-ex ex-tech and jobs.
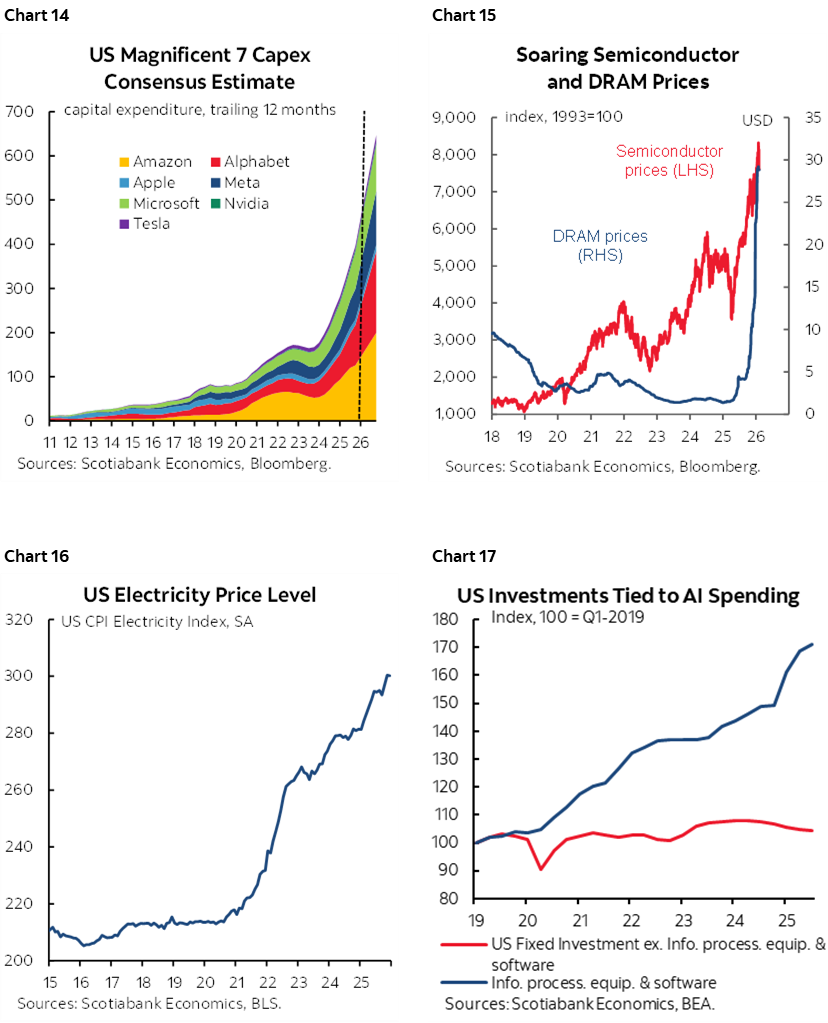
Further, AI is arguably crowding out other activities at least in the shorter run. The massive explosion of tech spending by just the Mag7 as one sub sample of the activity as shown in chart 14 including 2026 company guidance plus consensus for Nvidia’s release on February 25th. This is causing price pressures for others. Semiconductor and DRAM prices are soaring (chart 15) and so are electricity prices (chart 16). On balance, AI is looking to be more of a source of inflation at least in the short-term, with the longer-run effects on productivity and inflation very much open to highly uncertain debate. AI may also face a greater regulatory cost burden in future. AI’s explosive investment could also be partly responsible for weak investment ex-AI by crowding out capital budgets elsewhere (chart 17).
There are strong Fed implications to getting this right. In my opinion, the FOMC may have zigged when it should’ve zagged on the job market in December’s statement. Recall that they struck out “downside risks to employment rose in recent months” in favour of “some signs of stabilization. Where??
So why is Chair Powell looking through such signs? I’m unsure but think there are a few plausible theories.
Powell appears to lean on some variant of Okun’s ‘law’ given his argument that strong GDP growth could support employment gains and that he believes strong growth can continue. A counter is that strong GDP growth could be productivity driven at the expense of jobs. Another counter is that GDP growth has historically not always coincided with employment growth. For example, growth in nonfarm payrolls started to wane after early 2006 and then payroll levels peaked in early 2008 before GDP cratered later that year.
It's also possible that Powell is misjudging another inflection point.
Perhaps he wants a lot more evidence before being convinced that a weakening job market is not just temporary.
He may be cheerleading. A Fed Chair that rings the alarm on jobs needs to manage markets delicately.
He could be fading jobs weakness because many on the Committee are more worried about inflation.
Perhaps Powell wants any notable further easing to be left up to his successor and doesn’t wish to commit Warsh.
There is also the element of moral hazard: bail out other forms of policy risks and you’ll get more of it. This, however, supersedes the Fed’s judgement over courts, voters, markets, Congress such as it is, etc.
Whatever the reason, I like 3 cuts in our forecast this year, down to 3%, which is a bit more than consensus and markets are expecting on the amount and timing. We have enough evidence that the job market is rolling faster than inflation risk is rising. That may change and there is enormous uncertainty going forward, but this was originally conditioned as a debate around which part of the dual mandate would deteriorate the most and the answer would determine what to do on policy. We're closer to that answer now. Jobs are teetering, even though inflation risk remains and faces upside risk going forward.
US INFLATION—HOPE YOU’RE NOT SUPERSTITIOUS
US CPI for January will be released on Friday February 13th. I hope bondholders are not terribly superstitious, but these days they wouldn’t be faulted for putting lucky horseshoes around their desks.
A rise of 0.3% m/m SA is estimated for both headline and core CPI ex-food and energy by most within consensus including Scotia. Core CPI attracts roughly even numbers of estimates in both higher and lower tails. The Cleveland Fed’s ‘nowcast’ for core CPI is tracking 0.2% but is based on very limited inputs. There is probably more downside than upside to my 0.3% estimates.
Seasonally unadjusted changes in headline and core CPI are estimated at 0.4–0.5% m/m NSA. This is based on January normally being a solid seasonal up-month for prices including categories like food prices in the depths of winter across the northern hemisphere. Gasoline prices are tracking a slight weighted decline. So are vehicle prices. Shelter prices are estimated to be up sharply in the same unadjusted fashion that is the seasonal norm for rent adjustments, OER and utilities. Wildcards are core service prices and any further tariff and supply chain pass throughs to core goods prices.
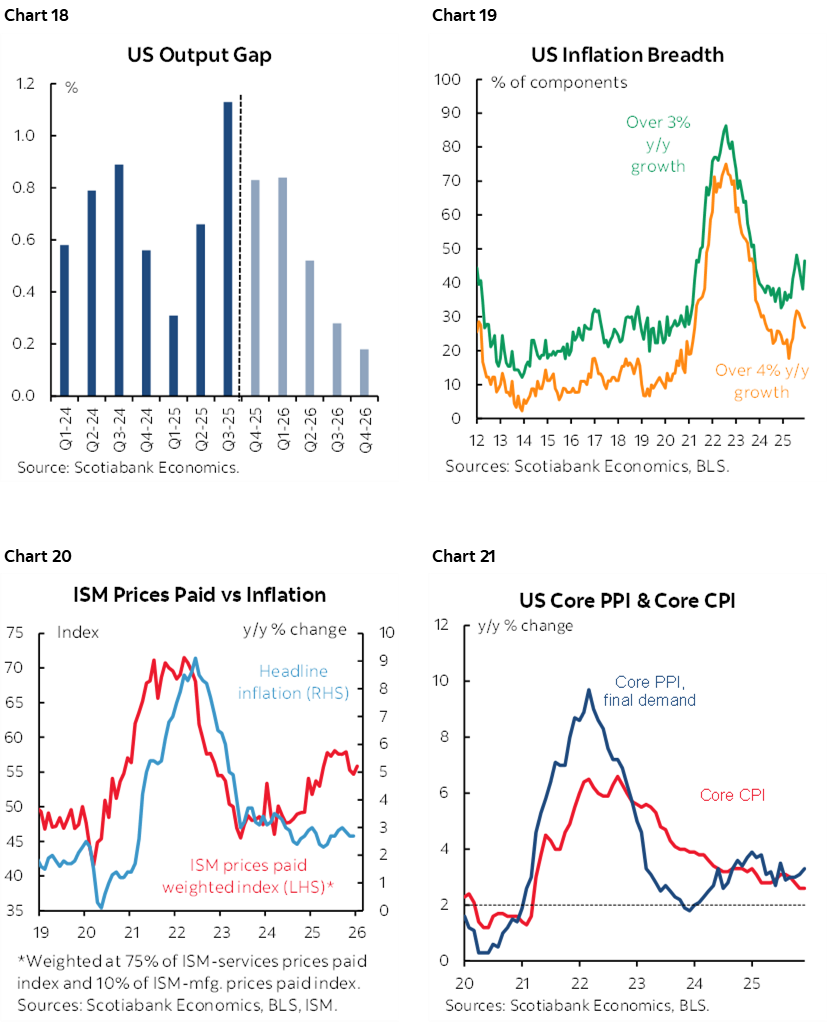
On that note, there are clear upside risks to core CPI in the months ahead. The US economy remains in excess aggregate demand marked by a positive output gap that might shrink if we’re right on GDP growth over 2026 (chart 18). It would take a prolonged period of actual GDP growth undershooting potential GDP growth and then lagging effects for this to change in terms of influences on inflation risk. There are growing signs of broadening price pressures once again (chart 19). Chart 20 shows that ISM weighted price indices may have topped out of late but still suggest lagging upside to inflation. December’s big spike in core producer prices (0.7% m/m SA, 0.2% consensus) rattled markets on January 30th, but how this passes through to consumer prices is an experiment in motion with some potential upside ahead (chart 21).
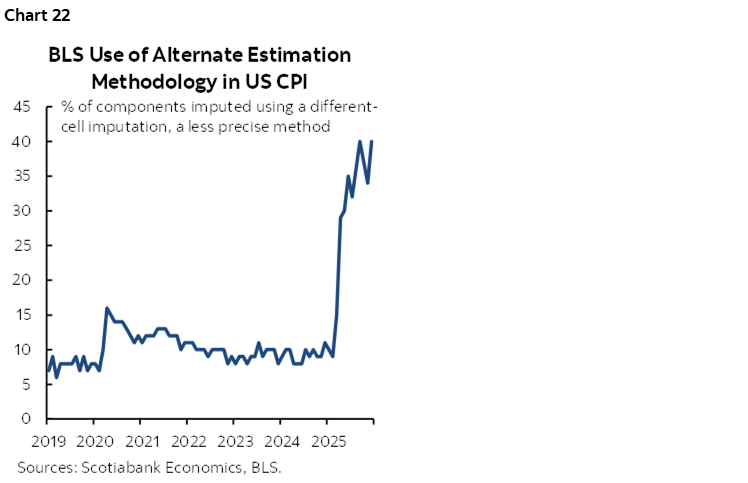
What may either tamp down CPI readings or lessen confidence in the data, however, are the twin effects of deteriorating quality and seasonal adjustments. A record share of the CPI basket that is being estimated by proxy methods is an ongoing source of uncertainty regarding the accuracy of the readings (chart 22). Budget cuts and a failure to pivot toward supplementary means of data collection have harmed the BLS.
CENTRAL BANKS—TWO DECISIONS, FED REACTIONS, AND BOC’S AI THOUGHTS
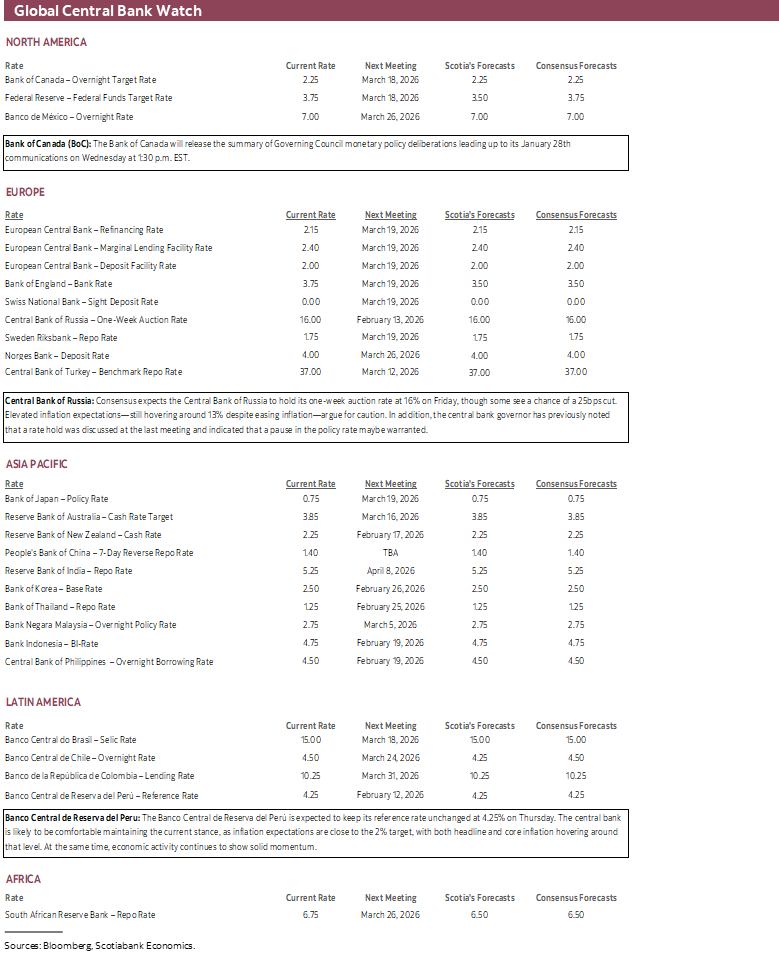
Only two regional central banks deliver policy decisions over the coming week, although a wave of Fed-speak could be impactful to global markets and we may gain further insight into how the BoC views AI.
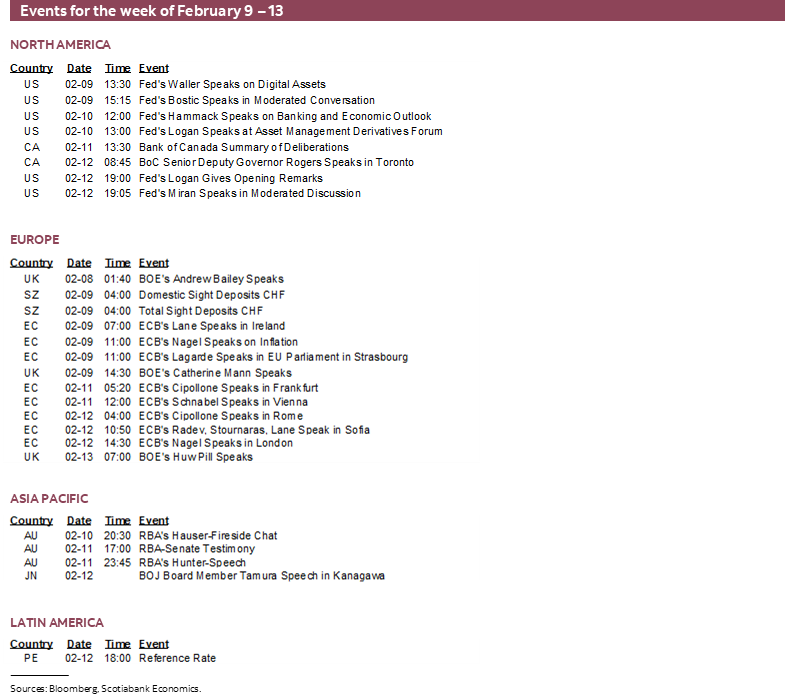
With delayed nonfarm payrolls on Wednesday and US CPI on Friday, this week’s line-up of Fed-speak could offer limited early post-data policy leanings ahead of the March 18th FOMC decisions and projections. They may remain guarded, however, as there are two rounds of readings on jobs and inflation before the next meeting. Monday will be a little anticlimactic when Governors Waller and Miran and outgoing Atlanta Fed President Bostic (nonvoting) speak. Cleveland’s Hammack (voting) and Dallas President Logan (voting) speak the next day. Potentially more impactful will be the post nonfarm discussions from KC’s Schmid (nonvoting) and Governor Bowman on Wednesday, and then Governor Miran (again) and Logan (again) on Thursday. There may be others.
Bank of Canada communications should be relatively light in the wake of the late January decision (recap here) and Governor Macklem’s recent speech (recap here). The Summary of Deliberations to the lead up to the decision on January 28th arrive on Wednesday. Senior Deputy Governor Rogers speaks on Thursday. Her speech title won’t be known until early next week, but the event is titled “The productivity challenge: adoption and infrastructure for AI-powered growth.” Oh, this should be good. Everything you ever wanted to know about AI and monetary policy but were afraid to ask. Or something a wee bit shy of that.
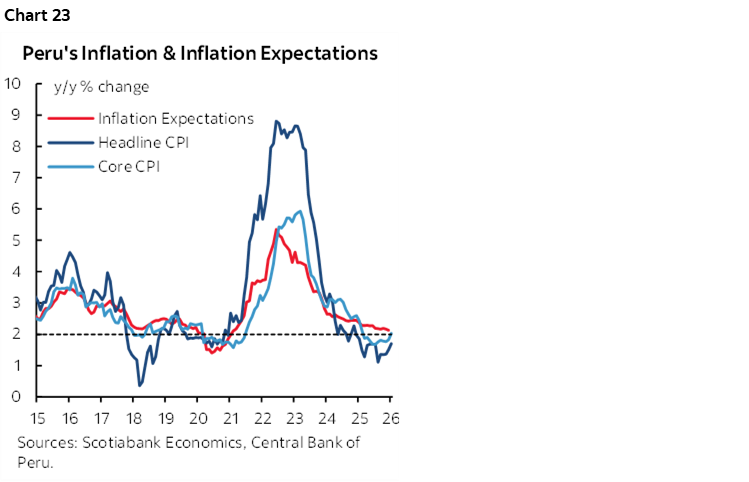
Peru’s central bank is expected to stay on hold at a reference rate of 4¼% on Thursday. It hasn’t budged from there since last September and has held for four consecutive meetings. Inflation remains around the midpoint of the 1–3% inflation target range with headline CPI at 1.7% y/y but core CPI at 2% (chart 23). Economic growth has been volatile including base effect influences on the economic activity index that cooled from 3% y/y in October to 1.7% in November.
Russia’s central bank is likely to keep its key rate unchanged at 16% on Friday.
GLOBAL MACRO—OTHER US, UK READINGS
Chart 24 covers the rest of the global line-up of indicators that will be covered in daily notes throughout the week as appropriate.
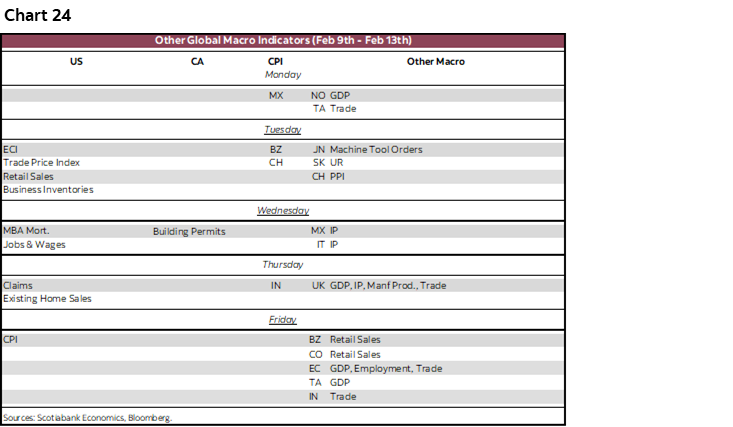
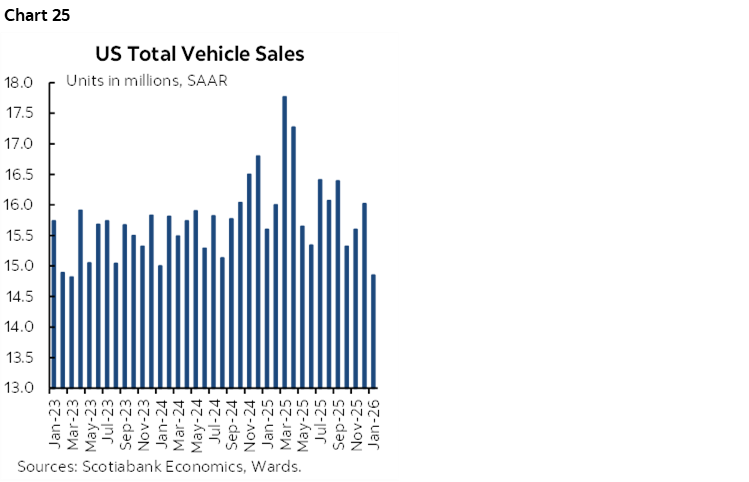
Key on the US list will be retail sales for December (Tuesday) that will be lifted by vehicle sales (2.7% m/m SA) and holiday sales with a mild offset from gasoline prices (-0.5% m/m SA in CPI). Still, the plunge in auto sales during January may have markets looking through to the next retail tally a month from now. US vehicle sales have been trending lower after an initial rush to front-load purchases before tariffs (chart 25) while Canadian vehicle sales have been much more resilient and posted a strong gain in January. The Employment Cost Index for Q4 (Tuesday) and existing home sales for January (Thursday) that may reflect the plunge in pending home sales and weather effects could also matter to markets.
The state of the UK economy will be the main focus overseas. Thursday brings out Q4 GDP that is expected to post modest growth of around 1% q/q SAAR, and December readings for industrial output, services, construction and trade.
CPI readings will also come from China (Tuesday) along with house prices (Thursday), India (Thursday), Argentina (Tuesday), Brazil (Tuesday), Mexico (Monday), Norway (Tuesday) and Switzerland (Friday).
DISCLAIMER
This report has been prepared by Scotiabank Economics as a resource for the clients of Scotiabank. Opinions, estimates and projections contained herein are our own as of the date hereof and are subject to change without notice. The information and opinions contained herein have been compiled or arrived at from sources believed reliable but no representation or warranty, express or implied, is made as to their accuracy or completeness. Neither Scotiabank nor any of its officers, directors, partners, employees or affiliates accepts any liability whatsoever for any direct or consequential loss arising from any use of this report or its contents.
These reports are provided to you for informational purposes only. This report is not, and is not constructed as, an offer to sell or solicitation of any offer to buy any financial instrument, nor shall this report be construed as an opinion as to whether you should enter into any swap or trading strategy involving a swap or any other transaction. The information contained in this report is not intended to be, and does not constitute, a recommendation of a swap or trading strategy involving a swap within the meaning of U.S. Commodity Futures Trading Commission Regulation 23.434 and Appendix A thereto. This material is not intended to be individually tailored to your needs or characteristics and should not be viewed as a “call to action” or suggestion that you enter into a swap or trading strategy involving a swap or any other transaction. Scotiabank may engage in transactions in a manner inconsistent with the views discussed this report and may have positions, or be in the process of acquiring or disposing of positions, referred to in this report.
Scotiabank, its affiliates and any of their respective officers, directors and employees may from time to time take positions in currencies, act as managers, co-managers or underwriters of a public offering or act as principals or agents, deal in, own or act as market makers or advisors, brokers or commercial and/or investment bankers in relation to securities or related derivatives. As a result of these actions, Scotiabank may receive remuneration. All Scotiabank products and services are subject to the terms of applicable agreements and local regulations. Officers, directors and employees of Scotiabank and its affiliates may serve as directors of corporations.
Any securities discussed in this report may not be suitable for all investors. Scotiabank recommends that investors independently evaluate any issuer and security discussed in this report, and consult with any advisors they deem necessary prior to making any investment.
This report and all information, opinions and conclusions contained in it are protected by copyright. This information may not be reproduced without the prior express written consent of Scotiabank.
™ Trademark of The Bank of Nova Scotia. Used under license, where applicable.
Scotiabank, together with “Global Banking and Markets”, is a marketing name for the global corporate and investment banking and capital markets businesses of The Bank of Nova Scotia and certain of its affiliates in the countries where they operate, including; Scotiabank Europe plc; Scotiabank (Ireland) Designated Activity Company; Scotiabank Inverlat S.A., Institución de Banca Múltiple, Grupo Financiero Scotiabank Inverlat, Scotia Inverlat Casa de Bolsa, S.A. de C.V., Grupo Financiero Scotiabank Inverlat, Scotia Inverlat Derivados S.A. de C.V. – all members of the Scotiabank group and authorized users of the Scotiabank mark. The Bank of Nova Scotia is incorporated in Canada with limited liability and is authorised and regulated by the Office of the Superintendent of Financial Institutions Canada. The Bank of Nova Scotia is authorized by the UK Prudential Regulation Authority and is subject to regulation by the UK Financial Conduct Authority and limited regulation by the UK Prudential Regulation Authority. Details about the extent of The Bank of Nova Scotia's regulation by the UK Prudential Regulation Authority are available from us on request. Scotiabank Europe plc is authorized by the UK Prudential Regulation Authority and regulated by the UK Financial Conduct Authority and the UK Prudential Regulation Authority.
Scotiabank Inverlat, S.A., Scotia Inverlat Casa de Bolsa, S.A. de C.V, Grupo Financiero Scotiabank Inverlat, and Scotia Inverlat Derivados, S.A. de C.V., are each authorized and regulated by the Mexican financial authorities.
Not all products and services are offered in all jurisdictions. Services described are available in jurisdictions where permitted by law.