Next Week's Risk Dashboard
- Gold drop carries spillover effects
- Tether’s peg is vulnerable
- Kevin Warsh may need to clear the air
- Nonfarm payrolls preview
- Powell’s curious depiction of the labour market
- Canadian jobs preview
- Macklem hits the road to sell his narrative
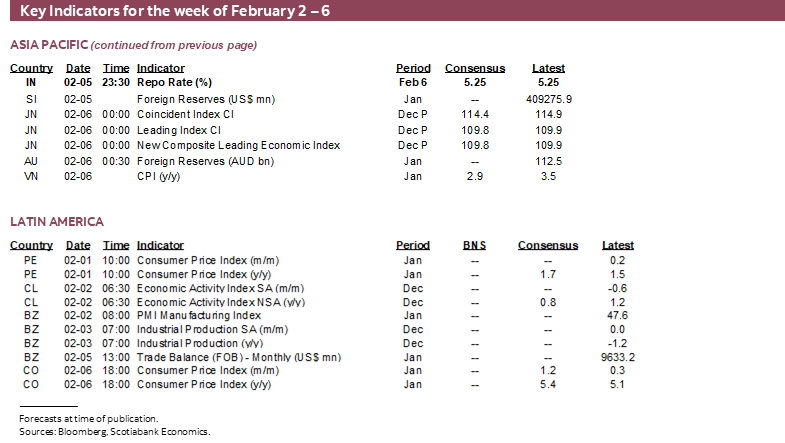
- Banxico to hold
- RBA may be an early adopter of tightening
- US government shutdown will hopefully be short
- RBI — Why would you cut?
- ECB — Unblissful Stasis
- BoE — The Gradual Trap
- NZ wages — a reason not to follow the RBA
- Earnings march on
- Global macro
Chart of the Week
Progress is being made on some of the biggest question marks hanging over markets but there is more work to do and new risks may be evolving. The week will focus upon next steps for some of these issues alongside a wave of top shelf macro reports led by nonfarm payrolls and a wave of global central bank decisions alongside continued earnings risk.
At least after all the endless drama we finally have a nominee to take the biggest seat at the FOMC’s table. Kevin Warsh is likely to ultimately pass the Senate, but a stalemate between President Trump’s probe into Chair Powell’s alleged role in Fed renovations and an ongoing pledge by Senator Tillis to block the nomination should Trump not reverse his aggressions against Powell leaves markets in a bit of a stalemate until one of them blinks. The easy solution would be to back off the petty moves against Powell.
That leaves markets debating what kind of Fed they’ll see come June when Warsh helms his first meeting. He has eleven other FOMC members to convince if he got the job by pledging to ease policy and the majority sound skeptical toward easing soon if at all.
Warsh must convince markets that what he said to get the job is the Warsh they’ll see in the seat. Warsh appears to have shades of Greenspan by way of willingness to cut on a bit of a lark that assumes AI will be disinflationary and allow the Fed to supercharge growth. That is hotly contested among economists. Markets are troubled with trading off his dovish policy rate bias against a hawkish perspective on balance sheet wind down and could continue to drive curve steepeners over the week. Funny, I thought the idyllic outcome that was being sought was lower short-term and mortgage rates. Warsh may need to weigh in well before he assumes the role.
A sign of this uncertainty is the bludgeoning that gold took on Friday through a whopping US$500+ loss. A one-day move isn’t a trend. Yet it would be imprudent not to recognize the potential knock-on effects from miners to crypto and leveraged finance.
Tether—a leading stablecoin—pushed precious metals (mainly gold) up to over 9% of reserves as at the end of 2025. The rise in gold prices this year may have pushed it over 10% amid ongoing reports of active buying. It also has a similar share invested in secured loans. Investing token proceeds into relatively safe t-bills is not the name of the game here, though three-quarters of reserves invested as such is a meaningful buffer. With concern over risk assets and particularly gold, Tether’s dollar peg has come under some pressure (chart 1).
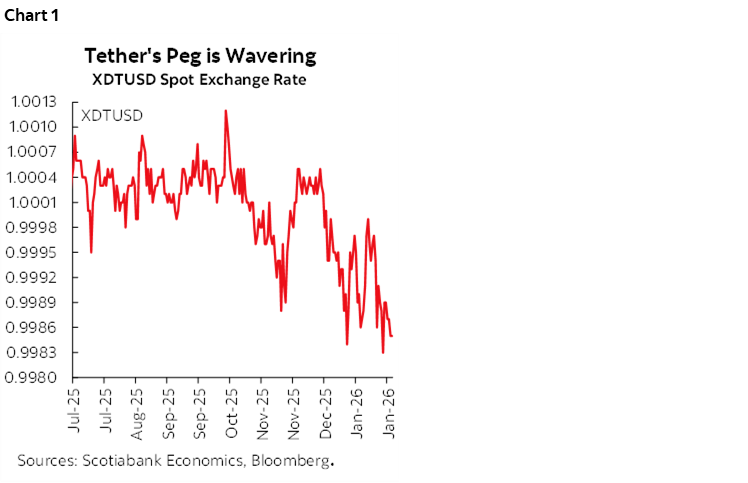
Maintaining the peg at 1.0 is critically important. It’s the very essence of a stablecoin. The entire crypto currency space has lost the market’s love over recent months. Ethereum, for example, is now down by 45% from the peak. Bitcoin is off by one-third and Binance has lost a similar amount.
The crypto space is not for the faint of heart. It is accustomed to large swings and has seen stablecoins stumble previously (think TerraUSD and Luna, 2022). Key, however, is their meteoric rise as evidenced by Tether’s market capitalization that soared from just over US$60B back in 2022 to triple that today. There is a bigger weight on similar potential risk. Lose the peg and come under further pressure from rating agencies while the Fed’s support for risk assets is potentially being reassessed and the knock-on effects across risk assets are to be carefully monitored.
Uncertainty will also extend into this week on the risk of a partial US government shutdown. At the time of publishing, it seems that the scope for a funding agreement is gathering steam but probably not quickly enough to avoid a shutdown for at least a few days. If it’s short, then no big deal from a market standpoint. If developments stall for longer, then we get into the risk that the funding disruption to the Labour Department could delay release of Friday’s nonfarm payrolls and here we go again. That risk is probably a low probability one.
NONFARM PAYROLLS—THE ESTIMATE AND THE CONFUSION
Friday brings the nonfarm payrolls whirligig back to life. January’s readings on the state of the US job market should finally distance ourselves from the shutdown distortions that caused lagging and incomplete data.
The Estimates
My estimate is for zero change in payrolls. The unemployment rate is expected to be little changed; I went with a dip to 4.3%. The UR is derived from the companion household survey and key is whether its measure of job growth continues to be offset by a shrinking labour pool as it was the prior month.
Why zero?
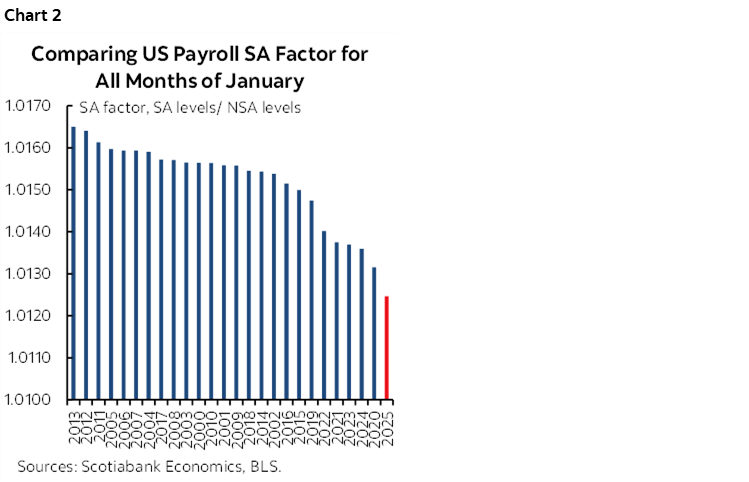
One reason is that seasonal adjustment factors are expected to be a notable weight against job growth. Last year’s SA factor for January was the lowest on record when comparing like months of January over time (chart 2). I’ve gone with a similar SA factor reflecting the recency bias in how they are calculated. This means that the change in payrolls would be tamped down relative to, say, a more middle-of-the-road SA factor.
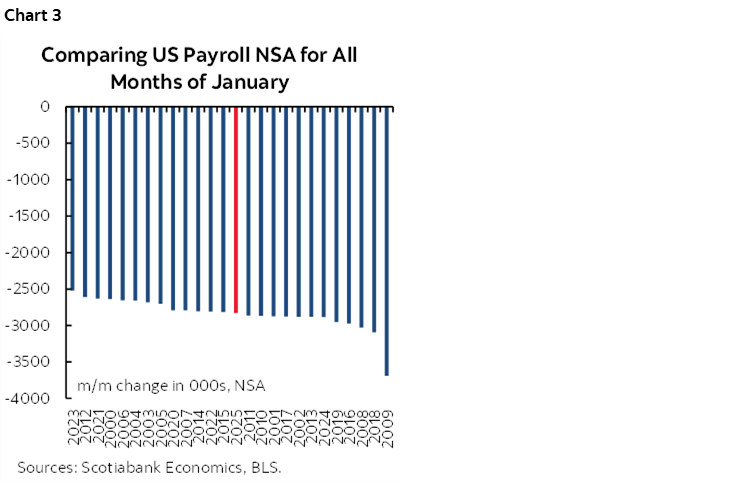
Then it turns to exactly how weak seasonally unadjusted hiring will be. January is typically a down month for hiring in the US before applying seasonal adjustments (chart 3). Last January, for instance, saw about 2.83 million Americans lose their jobs or not gain new ones before seasonality was controlled (NSA). I’m estimating only a slightly worse NSA number of about 2.9 million this time and think the risks are tilted more to the downside than the upside.
Why expect a weaker seasonally unadjusted drop in jobs this January? One reason is concern that health sector hiring might stall. That’s big if so, since the only thing propping up private nonfarm payrolls has been the health care sector and if you remove that then you get chart 4.
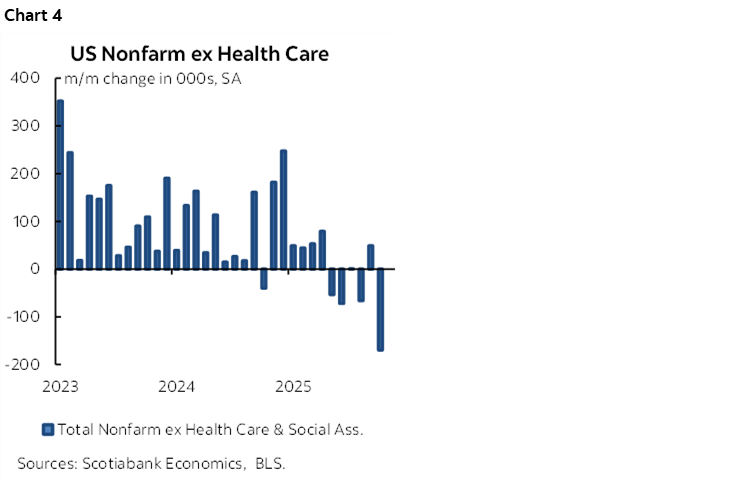
Why would health hiring stall? Because of expired Affordable Care Act subsidies that ended as the calendar flipped over to 2026. Studies like this one use a model to suggest that 286k to 340k jobs might be lost this year because of the ACA expiration. The authors reasonably reckon there are direct and indirect effects on jobs. One is less appetite to hire. The other is the indirect effect that forces folks to spend more on pricier insurance options or leads millions to lose their insurance. Those effects probably drive higher precautionary saving and hence less consumption growth with adverse effects upon hiring. In addition to model uncertainty is uncertainty toward timing the losses and distributing them over the year.
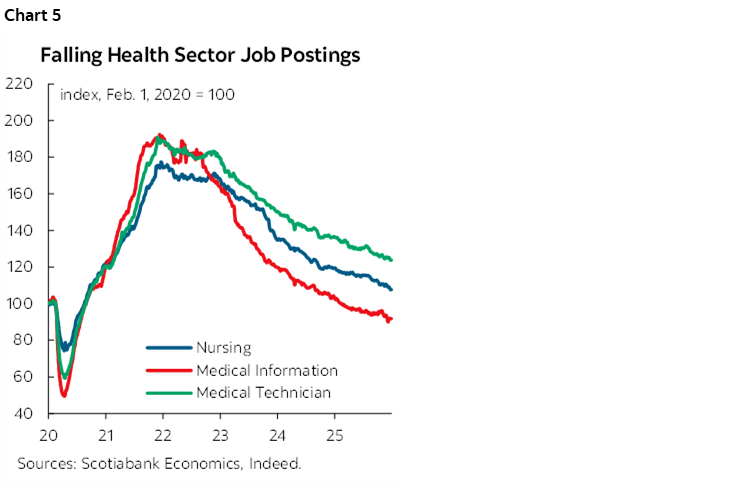
Which is why we need other readings. ‘Indeed’ job postings for nurses fell sharply in January and are at their lowest level since 2020 in seasonally adjusted terms. Ditto for postings for medical information and medical technician roles. They are the three main Indeed proxies for health sector postings. Chart 5.
It won’t show up on the initial pass at nonfarm payrolls through the reference period that is the pay period including the 12th day of each month, but accelerating late-month layoffs could drive negative revisions later on. UPS shed 30k jobs, Amazon announced 16k layoffs, Dow Chemical announced 4.5k and combined with others there is likely to be another spike in Thursday’s Challenger layoffs report for January. Still, layoffs in January could hit a three-month high but are likely to fall well shy of October’s 150k that was partly DOGE driven but with other major drivers like tech (27.6k) and warehousing.
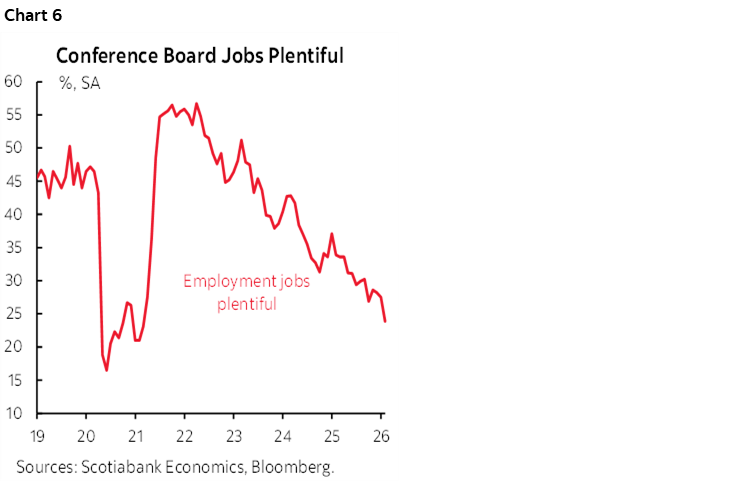
Also note that consumers are confirming what is being seen in job postings. The consumer confidence metric for jobs plentiful fell in January to its lowest level since early 2021 (chart 6). That was part of what drove overall consumer confidence to the lowest reading since way back in 2014. Yes, even lower than at the start of the pandemic. Renewed policy instability, a wavering job market, ACA subsidy expiration etc are likely rational reasons to be feeling worse.
ADP’s weekly gauge is indicating that monthly ADP private payrolls in January stalled somewhere around +10k. ADP is a poor gauge to use in forecasting payrolls but it’s part of a suite of readings generally saying similar things.
On the upside, weekly initial jobless claims moved a touch lower in January’s reference period for payrolls than in December’s. Continuing claims continue to drift lower and that is highly correlated with the unemployment rate. It need not be correlated with job growth, however, if the folks who may be most likely to file claims are caught up in the ICE actions.
Now for a wildcard—the weather. If you’ve got a joke about economists and weather, then it had better be one I haven’t heard a million times. January brought with it a curious mixture of flooding and heavy rains in parts of the country, bitter cold elsewhere, and heavy snow at various times and particularly the end of the month. That might have made it harder for those hiring to do so and those seeking jobs to get out for interviews and acceptance. It might have also impaired some business activity. December’s early arrival of winter across parts of the US and Canada, for instance, is estimated to have cost about 30k nonfarm payroll spots (here).
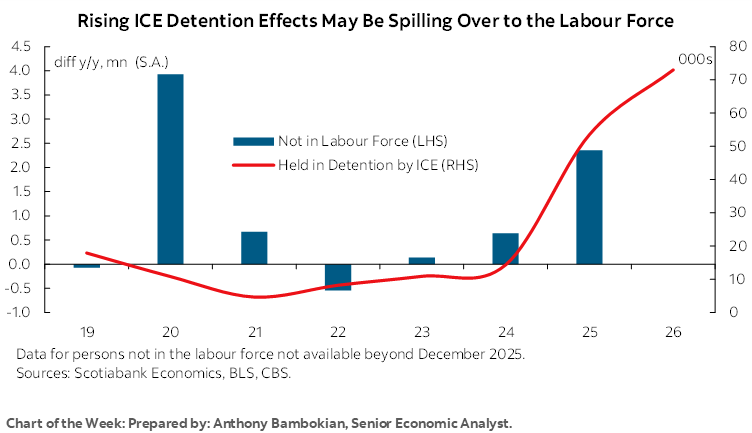
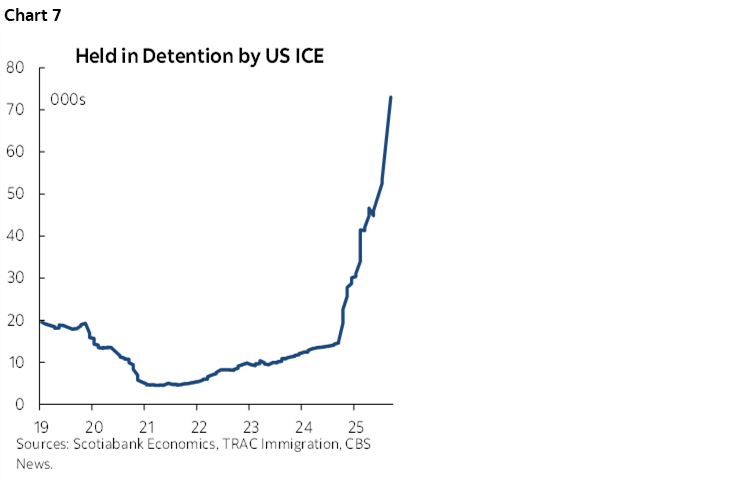
Another wildcard is the ‘ICE’ effect. An estimated 73,000 were detained in January (chart 7). If, say, we applied about a 50% labour force participation rate, then this would imply around 30–40k who were directly held out of the workforce by ICE. The indirect effect could be larger as people cower in fear, avoiding public places including work.
With all that said, we’re still missing a bunch of labour market readings that will arrive over the coming week and could inform the nonfarm payrolls estimate. Revelio’s nonfarm payroll measure is one of them, and it is due out on Thursday but it’s just a rough guide. Homebase’s measure of hourly paid workers may arrive before nonfarm. JOLTS job openings in December (Tuesday) might edge up based on other readings. ADP private payrolls (Wednesday) and Challenger job cuts (Thursday) have already been referenced.
Big Revisions
In addition to the estimate for January, recall that this is the report in which the BLS will formally introduce annual revisions to March 2025 payroll levels. They had previously estimated (here) that March payrolls were overstated by about 911,000 jobs. The final benchmarking revision could be more or less. The BLS had also announced that starting with this month’s report they will provide updated birth-death model adjustments that include rolling current sample information.
The growth in payrolls since March 2025 will perversely benefit from the downward revision to that month in the official series. That’s because the likely ongoing overstatement of payrolls since March won’t be addressed until the preliminary annual benchmarking revisions to March 2026 payroll levels until September. Treat carefully.
Apart from the noise surrounding individual monthly job market readings, I really have a tough time understanding the FOMC’s depiction of the US labour market. Let’s start with the depiction of a stable unemployment rate as something that should lessen concerns. The reason it’s stable may be because both the demand side (hiring) and supply side (new workers searching for jobs) are softening simultaneously although the unemployment rate has only dipped for the one month of December so clearly more data is needed.
The bigger concern is that if the unemployment rate is stabilizing because both job growth and labour force expansion are cooling then saying that’s not a worry is like saying two wrongs do indeed make a right. That’s just purely silly logic. Balance would instead say two things. First, if the unemployment rate stays stable then the labour market can remain tight which may aid job stability on average. Second, however, involves recognition that if the job market is faltering then so is disposable income growth as we’re seeing in Q4 tracking as consumption is being propped up by a falling saving rate. If softness in job creation and income growth persists or worsens, then it’s just a matter of time before consumption growth worsens. Y’all best not be capping and cancelling millions of credit cards.
Another thing I don’t get about the Fed’s depiction of the job market is the insouciance toward job growth because GDP growth is solid and therefore this should support job growth which is exactly what Chair Powell said in his press conference. I think most economists would say that when the job market is wavering, it’s a matter of time for when GDP growth falters. As a case in point, go back to 2005–08. Nonfarm payrolls started to trend lower after 2005 and began falling sharply at the beginning of 2008, yet throughout that period, GDP was whistling by the graveyard posting repeated gains throughout 2005–07 and really only significantly stumbling by late 2008. GDP and jobs march to the beats of different drummers with different time lines.
CANADIAN JOBS—SOARING POSTINGS
Canada updates job market conditions for the month of January on Friday. I’ve gone with an estimated gain of 15k and a stable unemployment rate of 6.8%.
Jobs normally decline in January before seasonal adjustments are applied (chart 8). Those seasonal adjustments have been drifting lower in recent years (chart 9). A lower SA factor means weaker job growth or a bigger job loss all else equal.
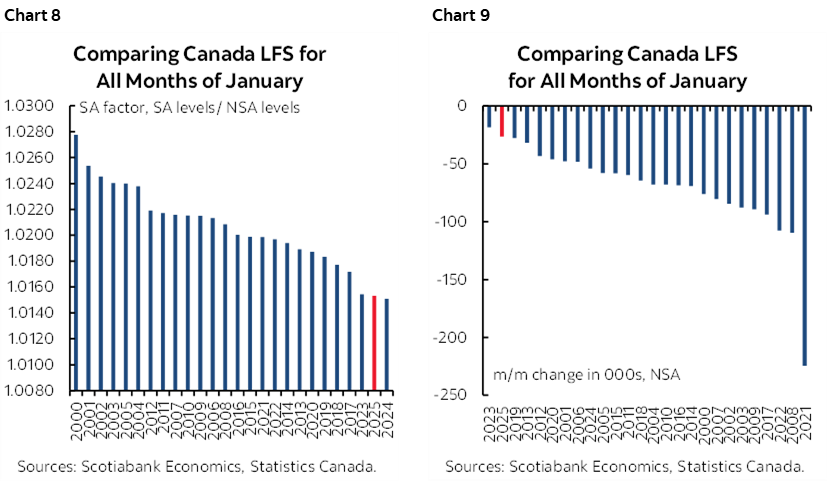
A similar SA factor to last January paired with a larger seasonally unadjusted drop than last January of over 200k would still yield a modest gain in jobs which is what I’ve done.
Key is to what degree will the seasonally unadjusted figure decline. This is where things get dicey.
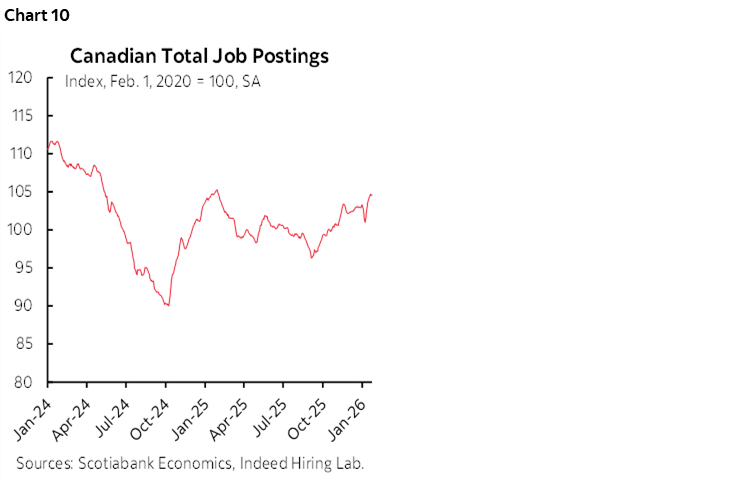
We can point to soaring job postings that hit their highest level since January of last year (chart 10). That suggests high appetite for hiring.
There is also the survey’s quirky practice of sticking with the same six-month panel sample of households that only rotates out the first month and rotates in the latest month, leading to possibly momentum until enough of the sample has changed.
Weather is one reason for being nervous and cautioning to quickly look at the details. For instance, the population-dense corridors through southern Ontario into Quebec were walloped by a heavy snowstorm right smack in the middle of the January 11th to 17th reference week. If so, then we’ll want to look to measures like hours lost due to weather. For too many, shovelling is becoming a second full-time job.
Whatever happens, look to the trend. Canada’s job market has been absolutely on fire since late last summer. Almost 200k jobs have been created since August. Contrast this to only 41k nonfarm payroll positions created in the US since then (and more likely lost given data distortions), but 622k using the more directly comparable US household survey to the Canadian household survey. Still, using relative scale factors, the US would have created closer to two million household survey jobs if its job market was performing close to Canada’s. Canada threw back the tariff boomerang.
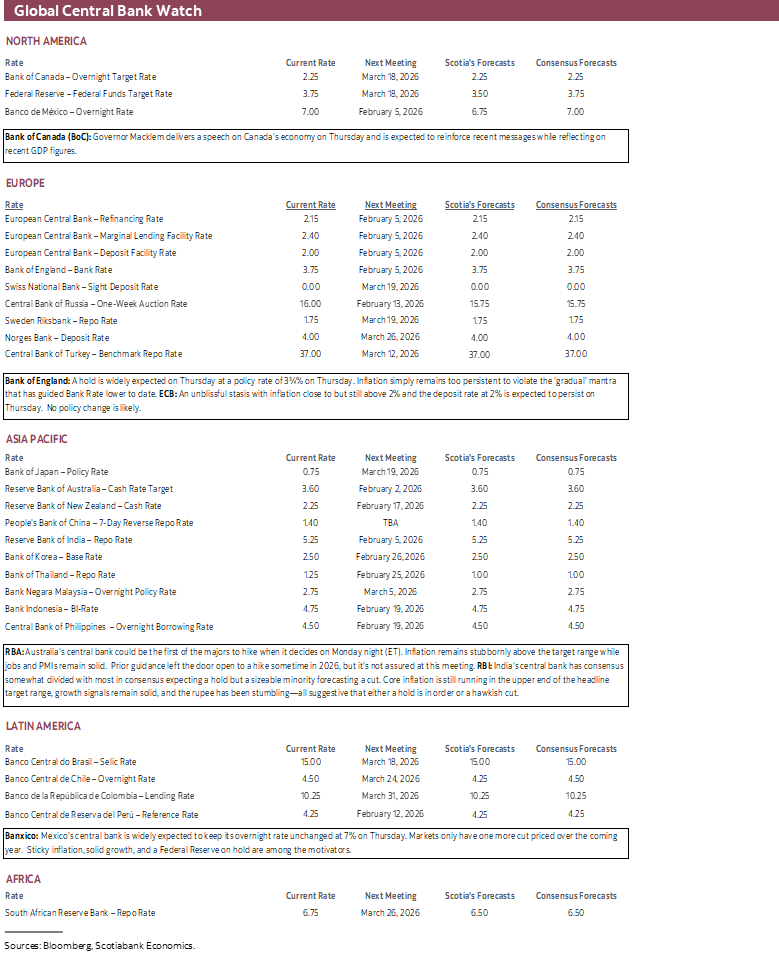
CENTRAL BANKS—RBA COULD BE THE FIRST MOVER
Some Latin American central banks may have beaten them to it (BanRep, Brazil), but the Reserve Bank of Australia could become the first of the majors to hike while others including the ECB, BoE and perhaps the RBI stay sidelined. We’ll also hear from the BoC again.
BoC’s Macklem to Speak
Fresh off a full set of communications this past Wednesday (recap here), BoC Governor Macklem takes to the podium to sell his team’s views on Thursday. He’ll speak at a Toronto club at about lunchtime.
Macklem’s topic is loosely billed as “Forces Reshaping Canada’s Economy in 2026.” There may be a different title and guidance provided early week in accordance with the central bank’s longstanding practice to do so only three days ahead. A speech and moderated Q&A are expected.
The only things to have changed since his last press conference were Canadian GDP (recap here) and the nomination of Kevin Warsh as Chair of the Federal Reserve pending approval by the Senate. I would expect Macklem to stick to this past week’s broad messages.
RBA—Early Adopter?
Consensus and markets are somewhat divided on whether or not Australia’s central bank could hike at this meeting. Almost 80% of consensus thinks they will hike by 25bps with the remainder at a hold. Markets have about 17bps of a hike priced. Show time is 11:30pmET.
What has them so fussed? Inflation. The RBA targets 2–3% headline inflation over the medium-term and it’s still running over 3% y/y across headline, trimmed mean and weighted median measures. Higher frequency inflation readings on a q/q annualized and seasonally adjusted basis were also well above target in Q4. Even higher frequency monthly CPI for just the latest month of December was an eye watering 3.8% y/y or 12.2% m/m annualized but not seasonally adjusted at source. Producer prices were up 3.5% y/y in Q4 with possible further pass through into consumer prices.
The real economy is performing rather well. Australia gained another 65k jobs in December. PMIs are signalling moderate ongoing growth. Q4 GDP doesn’t arrive until early March.
Communications out of the prior meeting back on December 8th and the ensuing minutes on December 22nd could be construed as compatible with a tightening bias. They referenced that “the labour market was still a little tight and the output gap still positive” indicating excess demand conditions in the overall economy. The Board also indicated “there were conflicting signals about whether financial conditions were still restrictive or not, and it was not possible to be confident in any assessment.” Further, members said “the full impact of the easing in monetary policy through 2025 was yet to be seen” and went on to state that “should these trends persist, an increase in the cash rate might need to be considered at some point in the coming year.”
A hike at this meeting is not assured. The “at some point” guidance leaves open flexibility toward timing. The RBA may also have a keen eye on the A$; since about mid-January it has appreciated by 4–5% against the dollar during a broad dollar sell-off but also gained somewhat against most other major crosses.
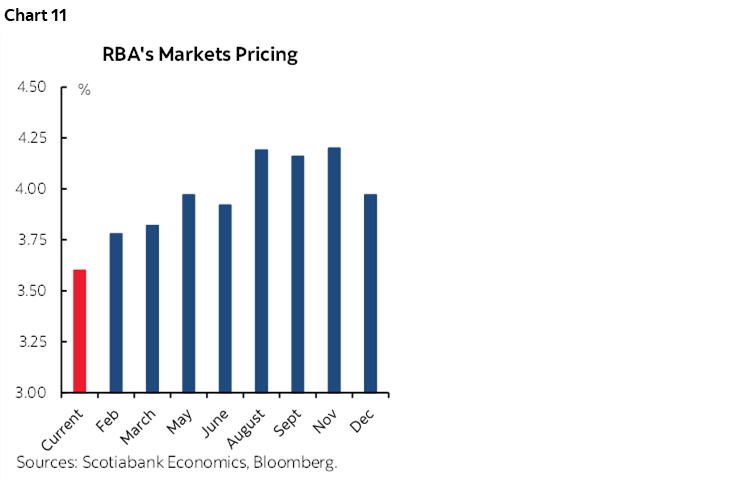
Having said that, if you’re going to go, then doing so as part of a full suite of communications including refreshed forecasts that are expected at this meeting would give them the opportunity to fully explain their views. The next opportunity to do so with a fresh Statement on Monetary Policy that includes new forecasts won’t be until May 5th as the March 17th meeting doesn’t include a forecast update. The Board could well decide that it’s better to hike now than to ease financial conditions by falling shy of market expectations (chart 11) and to do so with an ultra cautious bias.
Banxico—Holding Firm
No one expects Mexico’s central bank to change its overnight rate from 7% on Thursday. Markets only have one more cut priced over the coming year.
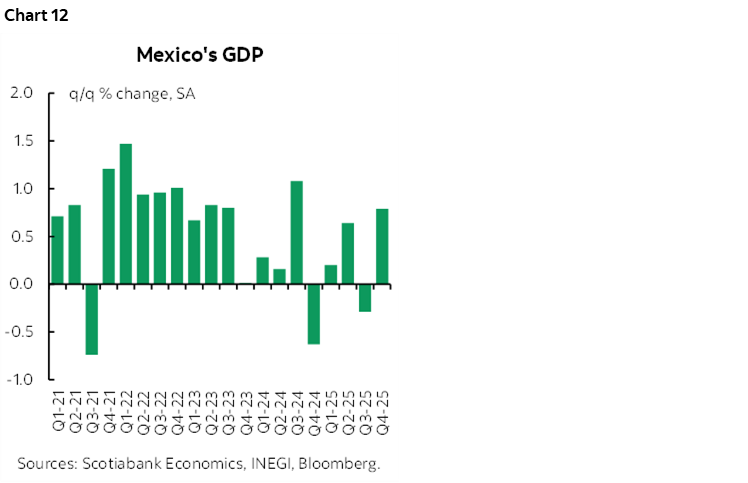
425bps of easing since early 2024 probably merits a pause. So does sticky inflation with headline at 3.7% and core at 4.3% versus Banxico’s 3% +/-1% inflation target range. So does a sharp rebound in q/q nonannualized GDP growth (chart 12). The prior statement injected more uncertainty into the timing of future rate moves by shifting from the affirmative of stating in November a desire to “evaluate reducing the reference rate” to then saying “will evaluate the timing for additional reference rate adjustments.” Signals from the FOMC that indicate a nearer-term pause are somewhat of a constraint on Banxico.
BoE—The Gradual Trap
Wake me up when this one’s over.
The Grand Ol’ Lady of Threadneedle Street delivers its latest policy decision on Thursday at 7amET. Markets are priced for no Bank Rate change. Consensus expects nothing.
Why? The BoE has long embraced a gradual mantra that spreads out easing. They’ve cut from a peak of 5¼% up to mid-2024 down to 3¾% with the latest cut in December. The oscillating pattern of cuts and holds became more drawn out after August. To cut again this soon would require a greater sense of urgency they are likely to lack, especially as it may be disruptive to markets that could call into question pricing for a very gradual path forward with 1–2 more cuts anticipated this year.
The BoE won’t condition a hold at this meeting on fussing over such matters though. They can point to inflation still riding at 3.4% y/y with core at 3.2% and services CPI at 4.5% y/y.
ECB—Unblissful Stasis
A little over an hour after the BoE decision will come another yawner. The ECB is widely expected to stay on hold at 2% on Thursday at 8:15amET followed by President Lagarde’s press conference 30 minutes later.
Consensus is unanimous in this expectation. Markets also have a hold priced for this meeting. And the next one. One after that too. Heck, markets are saying let’s call it a year and it’s only January!
And why not. Q4 GDP growth beat expectations a bit at 0.3% q/q (0.2% consensus) for a still admittedly paltry one-handled annualized rate. The Eurozone’s potential rate of growth is also around this range and so there is minimal slack, if any.
As a result, core inflationary pressures have not gone away. They’ve dramatically dissipated, with core CPI excluding food and energy still up by about 2¼% y/y. With the policy rate at 2% and in the neutral zone and underlying inflation around the 2% inflation target, it could well be that a prolonged stasis is upon ECB-observers—barring any large shocks in either direction.
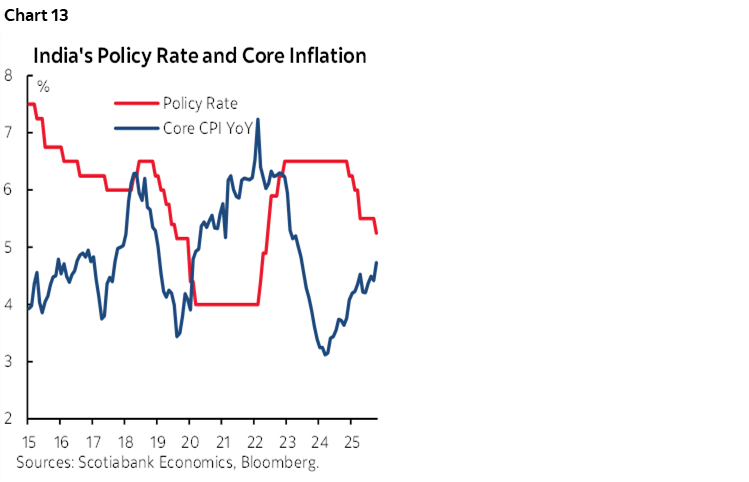
RBI—Why Would You Cut?
Oh what the heck, let’s make it three in a row. Few expect India’s central bank to alter the repurchase rate on Friday, but this one has a little more risk to it.
Within consensus about 70% of forecasters expect a hold at 5¼% and the remainder expect a 25bps cut. Markets have about a one-in-three chance of a cut priced in.
The inflation case for easing is mixed. CPI is up only 1.3% y/y but distorted lower by year-ago base effects that are maturing. Oil prices were falling since late 2023 on a general trend basis and the rate of decline has since abated if not turned higher.
Stripping out such influences turns the focus to underlying core inflation. CPI ex-food and fuel and light is running at 4.7% y/y. That’s not panic stations, but it’s in the upper zone of the RBI’s headline inflation target range of 4% +/-2%. As cuts have been delivered, core inflation has risen (chart 13).
Currency markets only inflame the central bank’s inflation concerns. The rupee has lost about 8% of its value to the dollar and has been the worst performing Asian currency since about last May, driving concern of inflation pass through for a country with high import propensities.
If the RBI had deep concerns about future growth then perhaps they could override such signals. Yet the composite PMI entered the year at 59.5 (above 50 is growth) and hence arrested the softening pattern from an unsustainable peak a few months before. With Q3 GDP growth of over 8% y/y and Q4 tracking only mildly lower, there had better be good reasons offered for a reduction and/or a firm signal they’re done easing lest the currency strike greater imbalances.
GLOBAL MACRO & EARNINGS
Earnings risk will continue. 121 S&P-listed firms release over the coming week including names like Amazon, Alphabet, Merck, Pfizer etc.
Canada’s earnings season also heats up a bit with 11 TSX-listed firms due to report. Names like Barrick, Thomson Reuters and Open Text are among them. The financials don’t start to report for a few weeks.
The US macro line-up will be dominated by expectations for Friday’s nonfarm payrolls. ISM-manufacturing might improve a touch (Monday). JOLTS job openings are likely to edge higher (Tuesday). Vehicle sales may have sunk based on industry guidance for part of the month and then heavy storms later in the month (Tuesday). Treasury markets take down the quarter refunding announcement (Wednesday). ISM-services (Wednesday) is expected to continue to signal moderate growth and significant price pressures. Friday also updates UMich consumer sentiment after payrolls.
Canada will focus on Macklem (Thursday) and jobs (Friday) with little else. PMIs are due out including S&P’s (Monday) and the Ivey version (Friday).
Eurozone CPI should be just a footnote on Wednesday amid expectations for a deceleration to about 1¾% y/y with core still around 2¼% and given that we already have readings for several of the major economies. Keep an eye on fresh readings for the health of the German economy including retail sales (Monday), factory orders (Thursday), industrial production (Friday) and exports (Friday).
LatAm markets digest CPI inflation reports across Peru (Sunday) and then Colombia and Chile (Friday). Several Asian economies also report CPI including Indonesia (Sunday), South Korea (Monday), Thailand and Philippines (Wednesday), and Taiwan (Thursday).
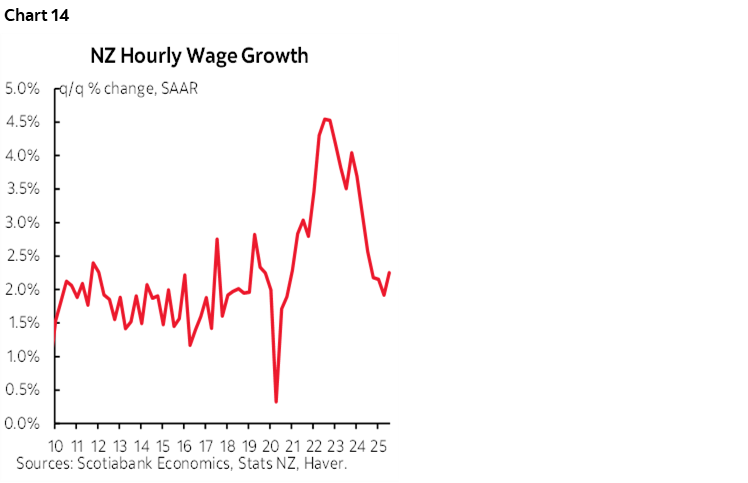
RBNZ watchers are not expecting the central bank to follow the RBA with a possible hike until perhaps July or September. Keep an eye on Tuesday’s Q4 jobs and wages though; wage growth has significantly decelerated (chart 14).

DISCLAIMER
This report has been prepared by Scotiabank Economics as a resource for the clients of Scotiabank. Opinions, estimates and projections contained herein are our own as of the date hereof and are subject to change without notice. The information and opinions contained herein have been compiled or arrived at from sources believed reliable but no representation or warranty, express or implied, is made as to their accuracy or completeness. Neither Scotiabank nor any of its officers, directors, partners, employees or affiliates accepts any liability whatsoever for any direct or consequential loss arising from any use of this report or its contents.
These reports are provided to you for informational purposes only. This report is not, and is not constructed as, an offer to sell or solicitation of any offer to buy any financial instrument, nor shall this report be construed as an opinion as to whether you should enter into any swap or trading strategy involving a swap or any other transaction. The information contained in this report is not intended to be, and does not constitute, a recommendation of a swap or trading strategy involving a swap within the meaning of U.S. Commodity Futures Trading Commission Regulation 23.434 and Appendix A thereto. This material is not intended to be individually tailored to your needs or characteristics and should not be viewed as a “call to action” or suggestion that you enter into a swap or trading strategy involving a swap or any other transaction. Scotiabank may engage in transactions in a manner inconsistent with the views discussed this report and may have positions, or be in the process of acquiring or disposing of positions, referred to in this report.
Scotiabank, its affiliates and any of their respective officers, directors and employees may from time to time take positions in currencies, act as managers, co-managers or underwriters of a public offering or act as principals or agents, deal in, own or act as market makers or advisors, brokers or commercial and/or investment bankers in relation to securities or related derivatives. As a result of these actions, Scotiabank may receive remuneration. All Scotiabank products and services are subject to the terms of applicable agreements and local regulations. Officers, directors and employees of Scotiabank and its affiliates may serve as directors of corporations.
Any securities discussed in this report may not be suitable for all investors. Scotiabank recommends that investors independently evaluate any issuer and security discussed in this report, and consult with any advisors they deem necessary prior to making any investment.
This report and all information, opinions and conclusions contained in it are protected by copyright. This information may not be reproduced without the prior express written consent of Scotiabank.
™ Trademark of The Bank of Nova Scotia. Used under license, where applicable.
Scotiabank, together with “Global Banking and Markets”, is a marketing name for the global corporate and investment banking and capital markets businesses of The Bank of Nova Scotia and certain of its affiliates in the countries where they operate, including; Scotiabank Europe plc; Scotiabank (Ireland) Designated Activity Company; Scotiabank Inverlat S.A., Institución de Banca Múltiple, Grupo Financiero Scotiabank Inverlat, Scotia Inverlat Casa de Bolsa, S.A. de C.V., Grupo Financiero Scotiabank Inverlat, Scotia Inverlat Derivados S.A. de C.V. – all members of the Scotiabank group and authorized users of the Scotiabank mark. The Bank of Nova Scotia is incorporated in Canada with limited liability and is authorised and regulated by the Office of the Superintendent of Financial Institutions Canada. The Bank of Nova Scotia is authorized by the UK Prudential Regulation Authority and is subject to regulation by the UK Financial Conduct Authority and limited regulation by the UK Prudential Regulation Authority. Details about the extent of The Bank of Nova Scotia's regulation by the UK Prudential Regulation Authority are available from us on request. Scotiabank Europe plc is authorized by the UK Prudential Regulation Authority and regulated by the UK Financial Conduct Authority and the UK Prudential Regulation Authority.
Scotiabank Inverlat, S.A., Scotia Inverlat Casa de Bolsa, S.A. de C.V, Grupo Financiero Scotiabank Inverlat, and Scotia Inverlat Derivados, S.A. de C.V., are each authorized and regulated by the Mexican financial authorities.
Not all products and services are offered in all jurisdictions. Services described are available in jurisdictions where permitted by law.