Next Week's Risk Dashboard
- Geopolitical risk may intensify
- US Q4/annual earnings season kicks off with the banks
- US CPI — another distorted one on the way…
- …but the FOMC should pay greater heed to the sagging job market
- Trump may announce his Fed Chair pick
- SCOTUS may announce the IEEPA tariff decision
- Carney meets Xi under Trump’s watchful eye
- BoK expected to hold as won slips again
- Global macro
Chart of the Week
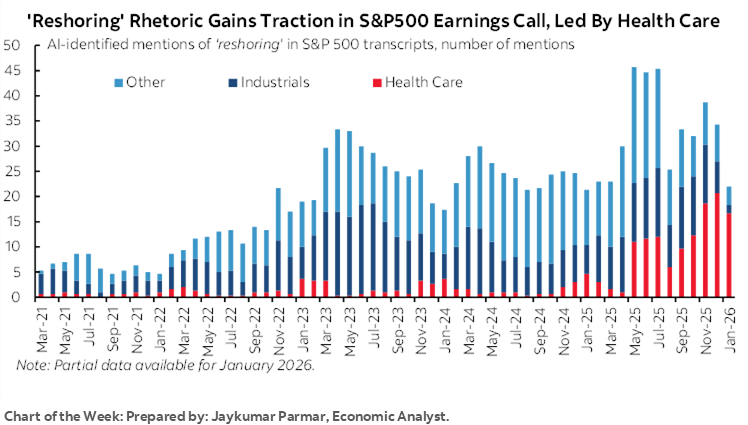
Readers familiar with major pieces of literature don’t need the title to this week’s edition to be explained. Yet rising geopolitical risk is not having a terribly large impact on global markets to date. That fits a frequent pattern whereby spikes in geopolitical risk tend to be temporary influences—within reason. The clustering of several potential flare-ups will continue to be closely monitored.
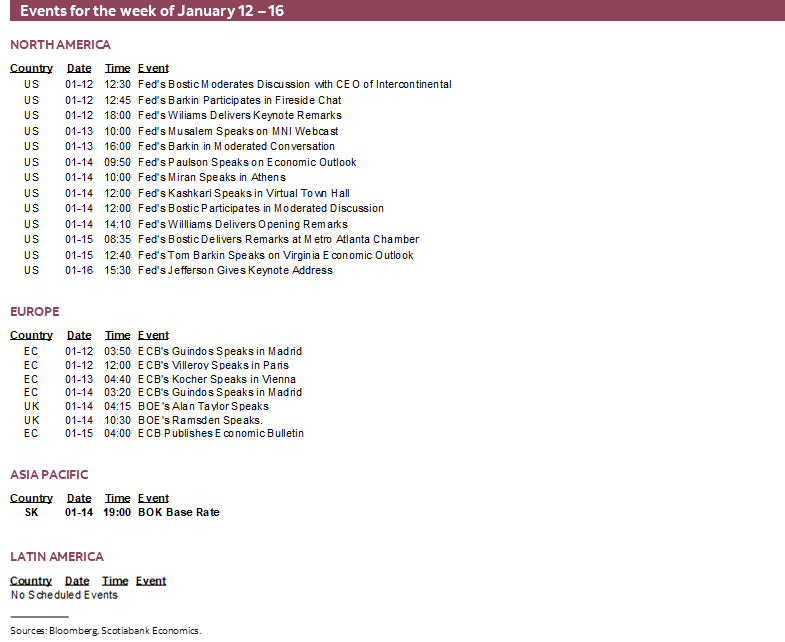
Moving right along, this coming week’s developments will principally focus upon the following, with some of them elaborated upon later:
- US earnings season, at first focused on the banks;
- the last US CPI reading (Tuesday) before the FOMC’s January 28th decision;
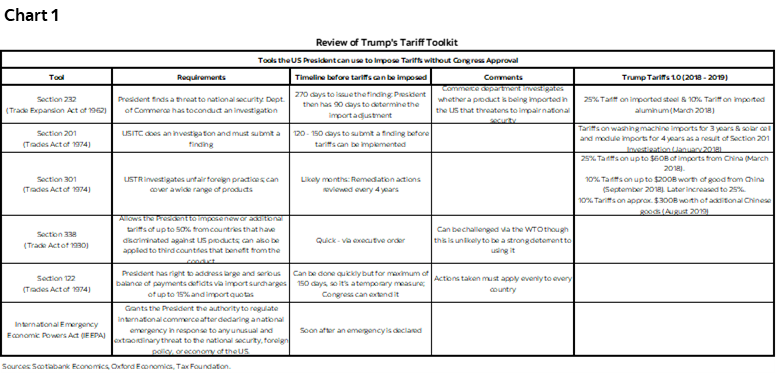
- a possible SCOTUS decision on IEEPA tariffs after weeks of teasing us. SCOTUS has set Wednesday for its next opinion day (10amET) with argument days also scheduled from Monday to Wednesday. Markets—and ourselves—would be surprised if SCOTUS did not reject use of IEEPA tariffs, but how, under what terms including potential reimbursement, and how Trump would respond with other measures are all highly uncertain. Chart 1 offers a reminder of the other instruments Trump could employ.
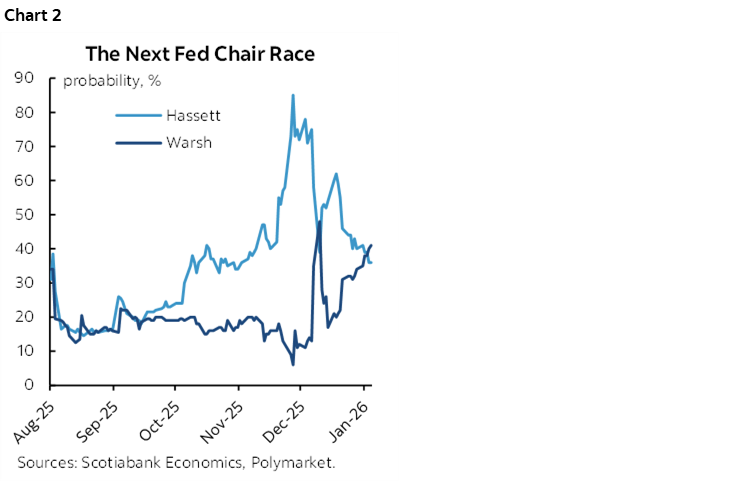
- Possibly Trump’s pick for Federal Reserve Chair that was guided to be possible either before or after the Davos World Economic Forum which is the following week. Betting markets have the two Kevins—Warsh and Hassett—running neck-and-neck (chart 2). Warsh may be handicapped by his opposition to tariffs and QE and deep criticisms of the Federal Reserve that I find appealing, but Trump may not. Hassett faces the challenge that markets may perceive him to be too dovish which could be bad for the 10-year Treasury yield as input into 30-year mortgage rates.
- Canadian PM Carney’s much ballyhooed visit to China runs from Tuesday to Saturday in order to potentially curry favour with President Xi Jinping. Diversifying exports and investment is the name of the game as the US retreats from its international relations. It’s the first visit by a Canadian PM in almost a decade. Watch for specific commitments versus generalities—and perhaps any reactions from the US to closer Canadian ties with China.
- other catch-up US releases and some other international data particularly out of the UK;
- and there is only one central bank that will weigh in with a decision (the BoK).
US Q4 AND 2025 EARNINGS SEASON
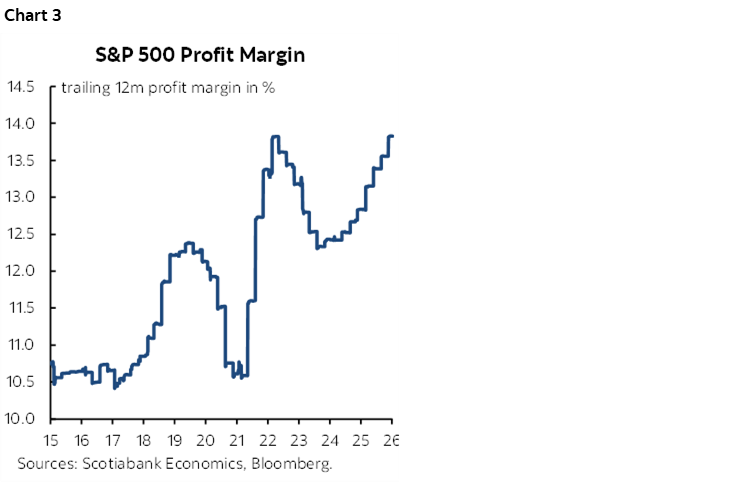
The Q4 and full year earnings season begins in earnest this week. Major banks will lead the way as is customary. A key reading to watch for the overall earnings season will be profit margins; so far, they’ve been holding up rather well despite the narrative that tariffs would be absorbed at shareholders’ expense (chart 3).
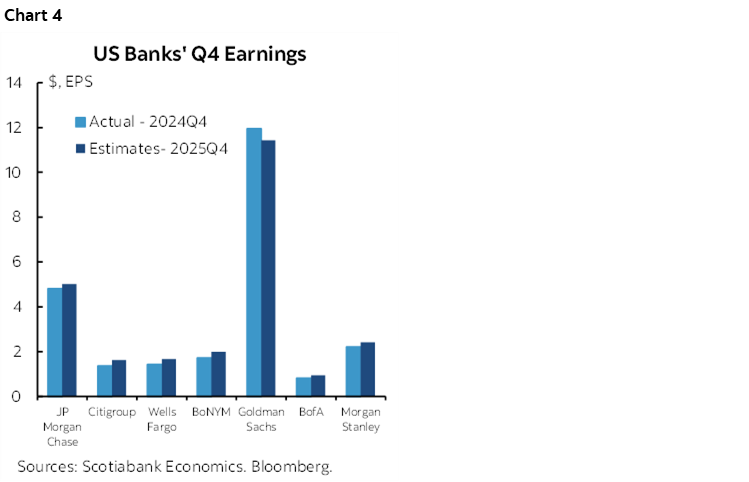
JP Morgan and BoNYM kick it off on Tuesday, followed by Goldman, Citi, BofA and Wells Fargo on Wednesday. Goldman, BlackRock and Morgan Stanley (Thursday) will be followed by State Street and a few regionals on Friday.
The analyst consensus expects this season to post mild gains over the same quarter a year ago which is the relevant comparator since earnings are not seasonally adjusted (chart 4).
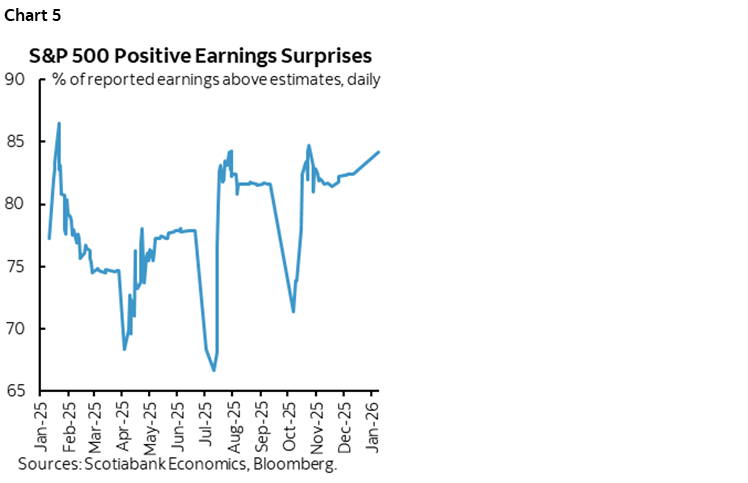
Frankly, it’s almost always a sure bet that they’ll beat. Until SOX and the dot com period, it used to be about a 50–50 bet whether earnings would beat or miss. Something changed afterward, perhaps making analysts more conservative. Other explanations for constantly being surprised to the upside may be unflattering (chart 5).
In addition to how trading divisions performed (probably rather well) another key consideration will be how banks view the credit cycle particularly in the context of a slowing job market.
To date, they’ve not been experiencing abnormal loan losses (chart 6). The biggest banks have collectively raised provisions from abnormally low levels when basically free money—interest rates and hand-outs—had next to no one defaulting in the pandemic. Conditions have normalized. The dollar amounts of provisions have risen but so have the loan books.

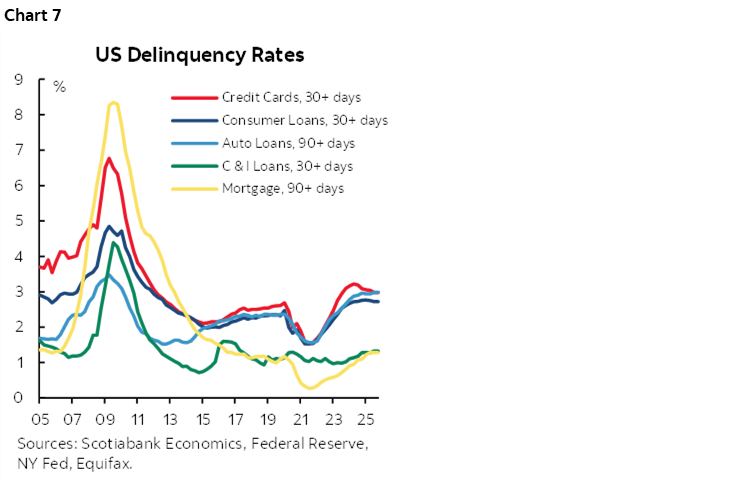
Which necessitates looking at default rates and drivers. Those have also risen from the free money era, but not alarmingly so (chart 7).
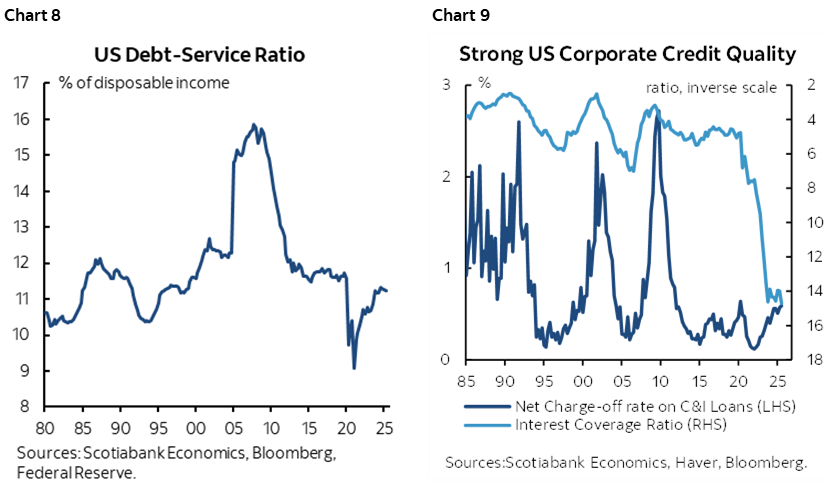
In terms of fundamentals, key predictors of consumer and business loan charge-offs with lagging effects to any changes are the household debt service burden (chart 8) and the corporate interest coverage ratio (chart 9). Both are healthy. Impressively so, in fact. And neither measure reflects the full pass-through effects of monetary easing to date which takes several quarters or years to work through depending on the credit product.
US INFLATION—MAYBE IT’S BEST TO FOCUS ON JOBS
CPI for December lands on Tuesday. It’s the last CPI reading ahead of the January 27th–28th FOMC meeting but there is also the Fed’s preferred PCE reading on January 22nd which lags behind due to the shutdown.
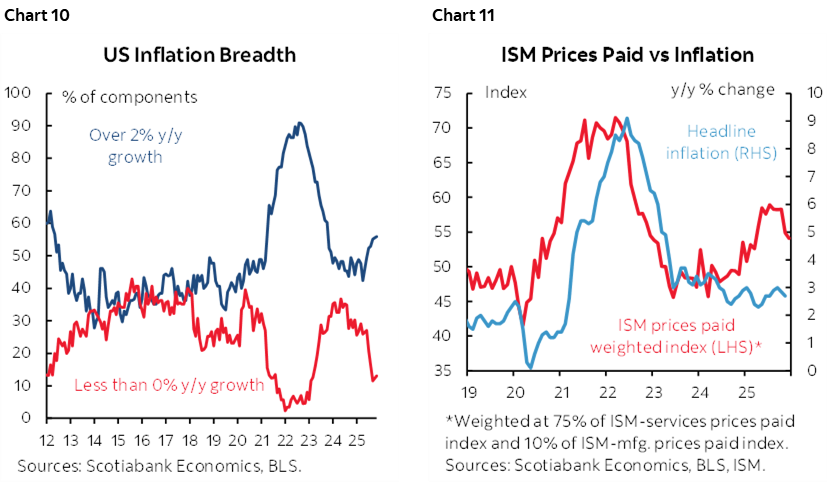
Increases of 0.3% m/m SA are expected for both total CPI and core CPI ex-food and energy. Key may also be revisions after the prior month’s surprise dip with 2.7% /2.6% y/y headline/core (consensus 3.1/3.0). I’ve factored in expectations for gasoline prices, vehicle prices, shelter, food and core services. Watch breadth that has been rising again (chart 10), while ISM price gauges have pulled off the peak but continue to indicate passthrough risk into the CPI basket (chart 11).
The problem is that there is more uncertainty this time than even at normal times for the following reasons.
First, because of the government shutdown that extended to mid-November, the BLS guided that CPI data collection resumed on November 14, 2025. By authorizing additional collection hours, BLS attempted to collect data for the entire month of November.” That skewed the prior month’s price collection to a limited sample particularly into the heart of the holiday retail season during which there may have been more sales price discounting than in the first half of the month that was not collected this time. In turn, the December CPI change over November could be distorted more than usual.
Second, this same argument could also impact the year-over-year rates of inflation. November’s compared half of November 2025’s normal data sample after the shutdown ended to all of the prior November. This likely explains why CPI fell more than expected to 2.7% y/y (headline) and 2.6% (core) that month. December’s year-over-year rate won’t have that problem and is likely to pop higher again.
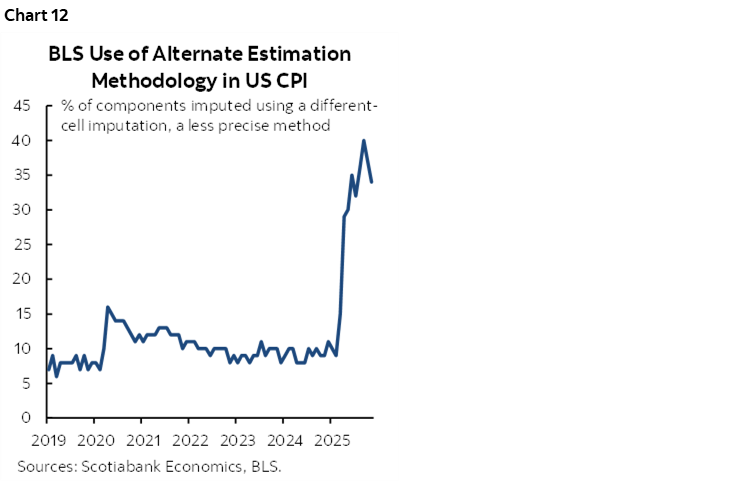
Third, the share of the CPI basket that is being estimated through proxy methods rather than hard data collection remains toward a record high (chart 12). December’s estimated share will be updated after 11amET following CPI. We can’t tell if this over- or under-states inflation, or neither.
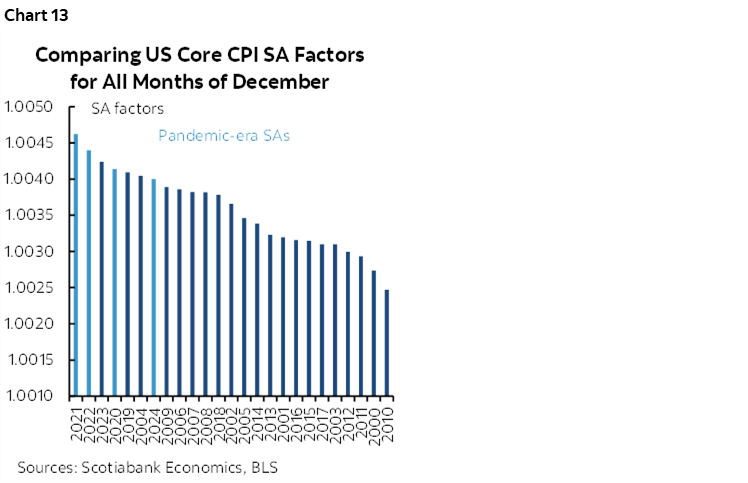
Fourth, seasonal adjustment factors may overstate inflation. The SA factor has been on the high side in recent years when comparing like months of December (chart 13).
All of which is to say that for a second month, the FOMC may have a case for fading whatever they see in the inflation figures. As argued here, they may be better advised to focus upon the clear weakening of nonfarm payrolls especially after considering estimates for how the official figures are overstated and the details are weak.
Producer prices during October and November (Wednesday) will also help us firm up estimates for the Federal Reserve’s preferred PCE measure of inflation alongside CPI inputs.
GLOBAL MACRO ROUND-UP
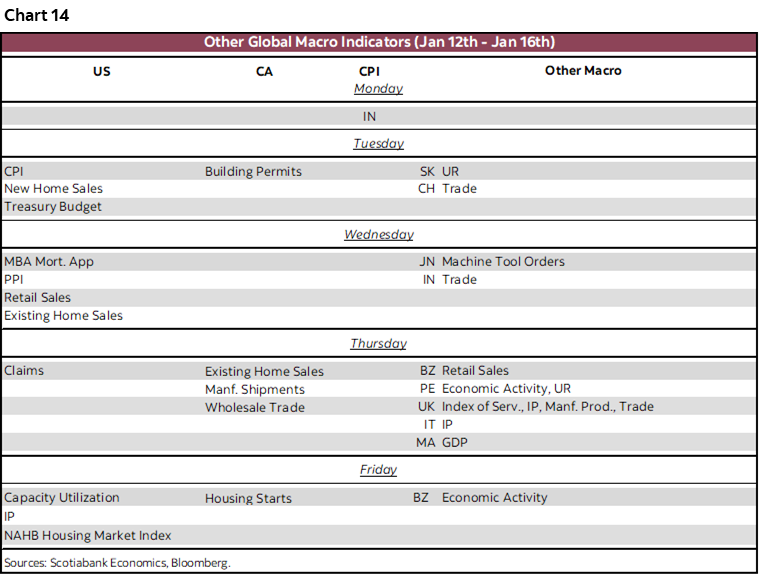
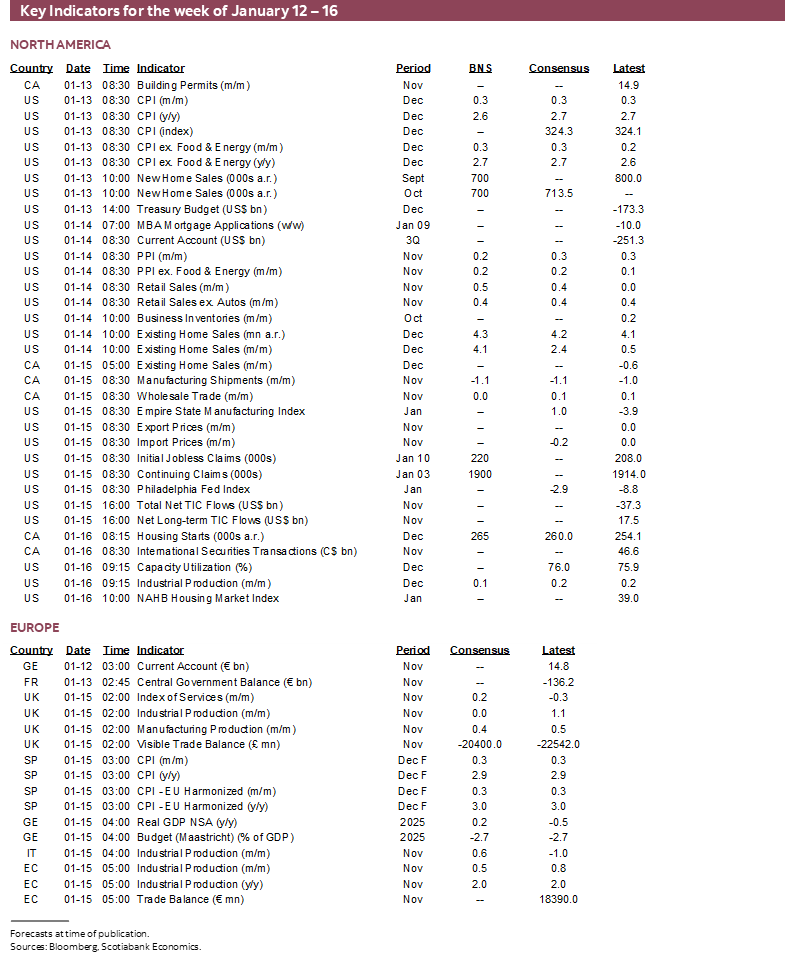
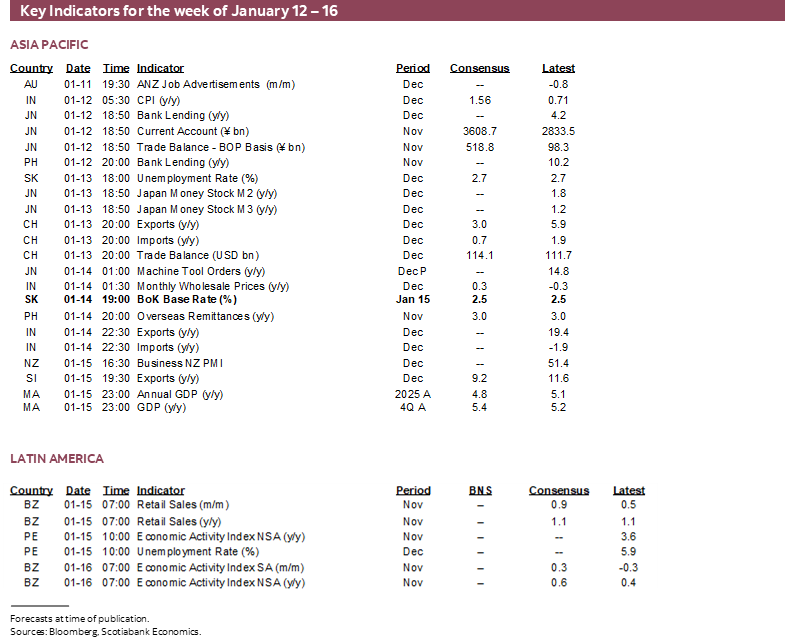
Chart 14 summarizes the rest of the global indicator line up. I’ll cover them in more detail in daily notes over the course of the week.
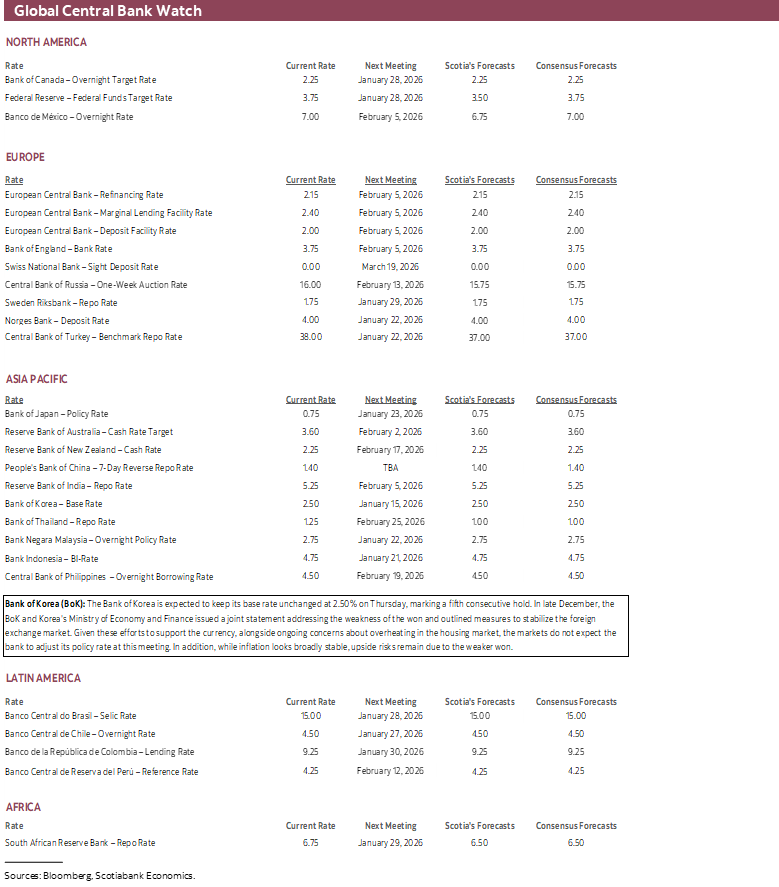
The Bank of Korea is widely expected to stay on hold for a fifth straight meeting on Thursday at a base rate of 2½%. In late December, the BoK and Korea's Ministry of Economy and Finance issued a joint statement addressing the weakness of the won and outlined measures to stabilize the foreign-exchange market. That worked for a brief period, but the won has since resumed a depreciating trend. Won weakness and house price inflation with associated stability concerns will keep the central bank guarded.
Canada only refreshes existing home sales for December after falling in two of the prior three months (Thursday), manufacturing sales that are expected to drop in November’s reading (Thursday), probably flat wholesale sales (Friday), and possibly a small gain in new home construction (Friday).
US markets may have plenty to focus upon with earnings, CPI and possible policy developments. The rest of the indicator line up could add a touch more spice with updates for new home sales in both September and October (Tuesday) and existing home sales (Wednesday). Retail sales may post a modest gain for November (Wednesday) rooted in higher auto sales and the start of the holiday shopping season. Industrial measures include the Empire and Philly Fed regional manufacturing gauges that may help to estimate the next ISM-manufacturing print, and Friday’s industrial production in December.
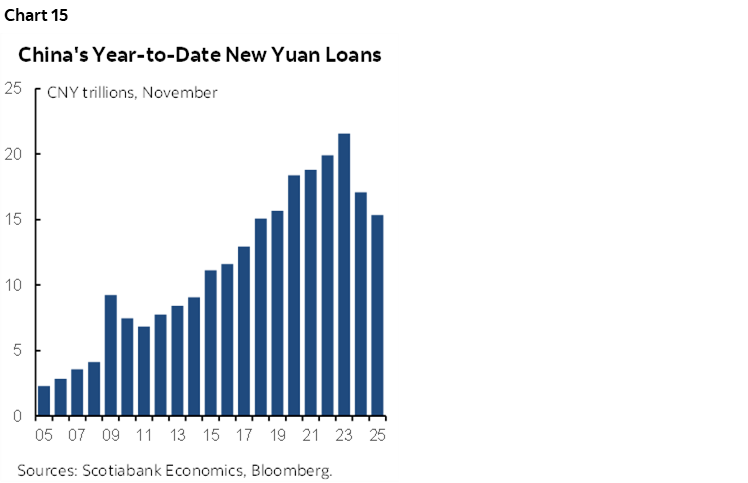
Watch for China’s refreshed figures for credit growth sometime this week given the slowing pattern (chart 15). Asia-Pacific markets will otherwise look to India for a possible jump in headline inflation to start the week, plus Malaysia’s Q4 GDP growth (Thursday night ET).
The UK will be where it’s all at in Europe this week. November readings for GDP, industrial output, services activity, construction spending and trade figures arrive on Thursday. It would be surprising if industrial output did not soften after the prior surge, and services activity did not strengthen after the prior dip.
LatAm markets face light calendar-based risk. Each of Peru (Thursday) and Brazil (Friday) update their monthly economic activity indices for November that serve as a GDP proxy.
DISCLAIMER
This report has been prepared by Scotiabank Economics as a resource for the clients of Scotiabank. Opinions, estimates and projections contained herein are our own as of the date hereof and are subject to change without notice. The information and opinions contained herein have been compiled or arrived at from sources believed reliable but no representation or warranty, express or implied, is made as to their accuracy or completeness. Neither Scotiabank nor any of its officers, directors, partners, employees or affiliates accepts any liability whatsoever for any direct or consequential loss arising from any use of this report or its contents.
These reports are provided to you for informational purposes only. This report is not, and is not constructed as, an offer to sell or solicitation of any offer to buy any financial instrument, nor shall this report be construed as an opinion as to whether you should enter into any swap or trading strategy involving a swap or any other transaction. The information contained in this report is not intended to be, and does not constitute, a recommendation of a swap or trading strategy involving a swap within the meaning of U.S. Commodity Futures Trading Commission Regulation 23.434 and Appendix A thereto. This material is not intended to be individually tailored to your needs or characteristics and should not be viewed as a “call to action” or suggestion that you enter into a swap or trading strategy involving a swap or any other transaction. Scotiabank may engage in transactions in a manner inconsistent with the views discussed this report and may have positions, or be in the process of acquiring or disposing of positions, referred to in this report.
Scotiabank, its affiliates and any of their respective officers, directors and employees may from time to time take positions in currencies, act as managers, co-managers or underwriters of a public offering or act as principals or agents, deal in, own or act as market makers or advisors, brokers or commercial and/or investment bankers in relation to securities or related derivatives. As a result of these actions, Scotiabank may receive remuneration. All Scotiabank products and services are subject to the terms of applicable agreements and local regulations. Officers, directors and employees of Scotiabank and its affiliates may serve as directors of corporations.
Any securities discussed in this report may not be suitable for all investors. Scotiabank recommends that investors independently evaluate any issuer and security discussed in this report, and consult with any advisors they deem necessary prior to making any investment.
This report and all information, opinions and conclusions contained in it are protected by copyright. This information may not be reproduced without the prior express written consent of Scotiabank.
™ Trademark of The Bank of Nova Scotia. Used under license, where applicable.
Scotiabank, together with “Global Banking and Markets”, is a marketing name for the global corporate and investment banking and capital markets businesses of The Bank of Nova Scotia and certain of its affiliates in the countries where they operate, including; Scotiabank Europe plc; Scotiabank (Ireland) Designated Activity Company; Scotiabank Inverlat S.A., Institución de Banca Múltiple, Grupo Financiero Scotiabank Inverlat, Scotia Inverlat Casa de Bolsa, S.A. de C.V., Grupo Financiero Scotiabank Inverlat, Scotia Inverlat Derivados S.A. de C.V. – all members of the Scotiabank group and authorized users of the Scotiabank mark. The Bank of Nova Scotia is incorporated in Canada with limited liability and is authorised and regulated by the Office of the Superintendent of Financial Institutions Canada. The Bank of Nova Scotia is authorized by the UK Prudential Regulation Authority and is subject to regulation by the UK Financial Conduct Authority and limited regulation by the UK Prudential Regulation Authority. Details about the extent of The Bank of Nova Scotia's regulation by the UK Prudential Regulation Authority are available from us on request. Scotiabank Europe plc is authorized by the UK Prudential Regulation Authority and regulated by the UK Financial Conduct Authority and the UK Prudential Regulation Authority.
Scotiabank Inverlat, S.A., Scotia Inverlat Casa de Bolsa, S.A. de C.V, Grupo Financiero Scotiabank Inverlat, and Scotia Inverlat Derivados, S.A. de C.V., are each authorized and regulated by the Mexican financial authorities.
Not all products and services are offered in all jurisdictions. Services described are available in jurisdictions where permitted by law.