Next Week's Risk Dashboard
- With IEEPA gone, here are the new tariff scenarios
- Key tariff details and another tariff case are pending
- Trump’s State of the Union Speech…
- …and as an economist sees it
- Comparing Trump to past Presidents across many measures
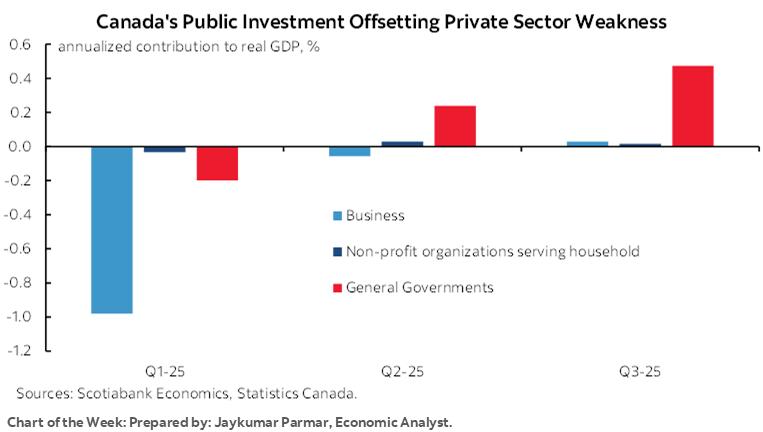
- Canada’s economy ended 2025 softly
- Canada’s bank earnings season
- Central banks — rest up ahead of the coming deluge…
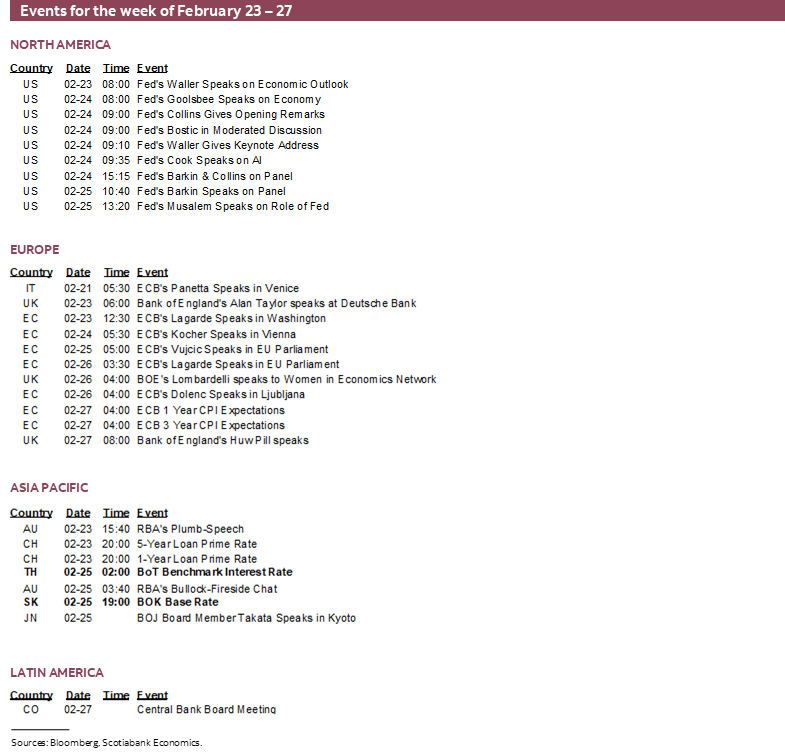
- ...as this week only brings out Thailand, Korea
- Global macro
Chart of the Week
By far the most dominant development over the coming week will be ongoing spillover effects from the US Supreme Court’s wise decision to strike down IEEPA tariffs and the aftermath. As we go to press, we await key information on potential exemptions, exclusions and details to President Trump’s switch to different tariff instruments that could leave some countries better or worse off than previously.
Expect Trump to position his trade agenda front and centre in Tuesday night’s State of the Union speech. I provide an economist’s version of such a speech.
Canadian bank earnings, Canadian GDP, a light week for global central banks and limited macro readings will round out the calendar-based risk. Off-calendar risk will continue to include potential geopolitical risk concerning Iran.
WHAT LIES NEXT FOR TARIFFS?
The US Supreme Court opened a door to revisiting tariffs. What it leads to is more uncertainty as we await further details and steps.
The limited market reaction on Friday—in the midst of a wave of data releases—indicates that markets are apprehensive toward next steps as well.
Friday’s decision—surprising in its timing, less so the ruling itself—was recapped here including a table outlining Trump’s alternatives. Striking down the IEEPA tariffs in a 6–3 vote on Learning Resources, Inc. v. Trump still leaves open what happens to the other tariff case—Trump v. V.O.S. Selections, Inc. SCOTUS could rule on that case either on Tuesday or Wednesday that are also marked as opinion days for the Court.
The Court did not rule on what to do about refunds and may find the issue coming back to it at a later date once the issue winds its way through the lower courts.
Trump has already stated he will use Section 122 to impose an across-the-board 10% tariff on all imports in addition to other non-IEEPA tariffs. He will also launch section 301 ‘and other’ investigations. Watch this space closely through the weekend and next week by way of potential executive orders and other remarks.
There are limits to Section 122 tariffs. For one, they can only be imposed for up to 150 days (about 5 months) after which Congress must approve any extension. That could mean that should Congress balk at doing so by late July and hence shortly before midterms, then the Section 122 10% tariff could expire. For another, the US must prove there is a “large and serious “balance of payments deficit that risks “imminent and significant depreciation of the dollar” in a clear case of an international balance-of-payments disequilibrium. Many argue Section 122 only really applies in a fixed exchange rate regime which no longer applies compared to when Section 122 of the 1974 Trade Act was introduced. It’s unclear to us that Trump is correct in declaring use of Section 122 to be legal in any airtight sense.
Key is whether there may be section 122 carve-outs. One such example that is key to the US, Canada and Mexico is whether CUSMA/USMCA-compliant trade is exempt from the extra 10%. It is our tentative understanding that Section 122 as laid out here on page 15 may allow for exemptions and exclusions “where in his judgment such action will cause or contribute to material injury to firms or workers in any domestic industry, including agriculture, mining, fishing, or commerce, to impairment of the national security, or will otherwise be contrary to the national interest.” The President “may exempt all other countries from such action.” Just as this note is being published the USTR announced that the same exemptions will apply which suggests Canada’s average effective tariff rate may drop on net but we need details.
Chart 1 shows the outcomes for the overall average effective tariff rate on all US imports under three scenarios: Before today, after the SCOTUS ruling that eliminated IEEPA tariffs but before Trump’s adjustments, and after eliminating IEEPA but added a 10% across-the-board Section 122 tariff with no exemptions. Where we land between the second and third scenarios depends upon any exemptions and exclusions that we don’t know yet.
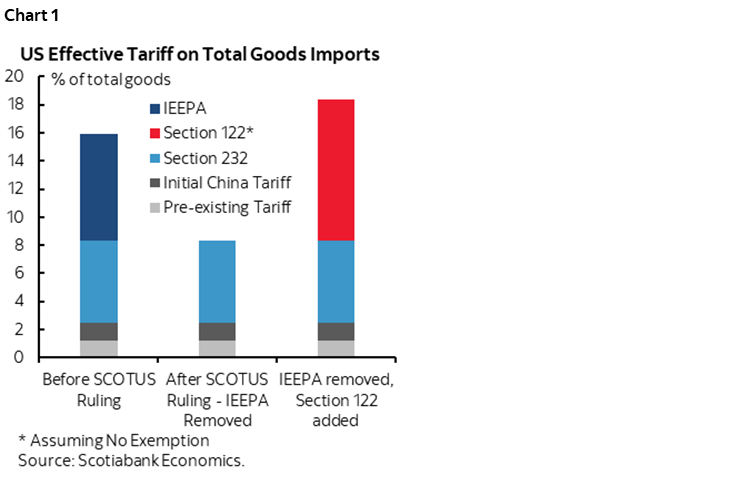
Chart 2 does the same thing for Canada. Theoretically Canada could wind up with a lower average effective tariff rate applied against its exports to the US after removing IEEPA tariffs and if CUSMA-compliant trade is exempted from the 10% Section 122 tariff. If no exemptions or partially exemptions then it’s unclear where Canada would land between scenarios two and three.
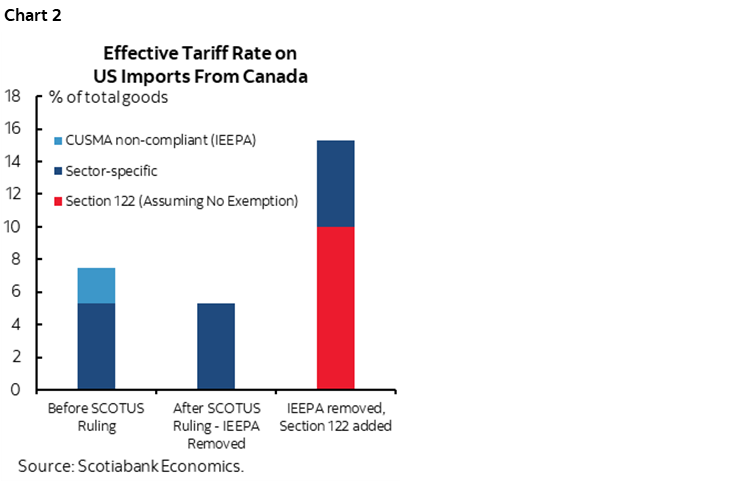
Barring exemptions, then what this could do is jeopardize the very existence of production and employment in key industries like autos. We go back to scenarios of about a year ago when auto industry executives warned that large tariffs without exemptions would result in shutting down plants as production would no longer be economical.
Another key is how to renegotiate trade deals between the US and other countries now that IEEPA tariffs have been struck down and potentially replaced by a 10% Section 122 tariff. This may invalidate the agreements and set out a need for fresh negotiations.
Regardless, we’re now in a more uncertain phase in terms of what lies next. Uncertainty and volatility are spiking once more as businesses in the US and abroad grapple with how US protectionism may change in form, level, and timing—and how America’s trading partners may react.
It is entirely feasible that substituting toward the other possible tariff tools could see their legality coming back to the Supreme Court—and possibly closer to the US midterm elections.
Throughout it all, recall the same old critique of the economic victim narrative that is behind tariffs. The US runs large trade and current account deficits because a) it has attractive investment opportunities, and b) it spends too much and saves too little. This makes America a net foreign creditor dependent upon foreign capital through a capital account surplus to fund the current account deficits.
Fiscal policy is a big part of that. Consumers saving very little is another part of it. It's the structural drivers of the investment:saving imbalance that are the causes.
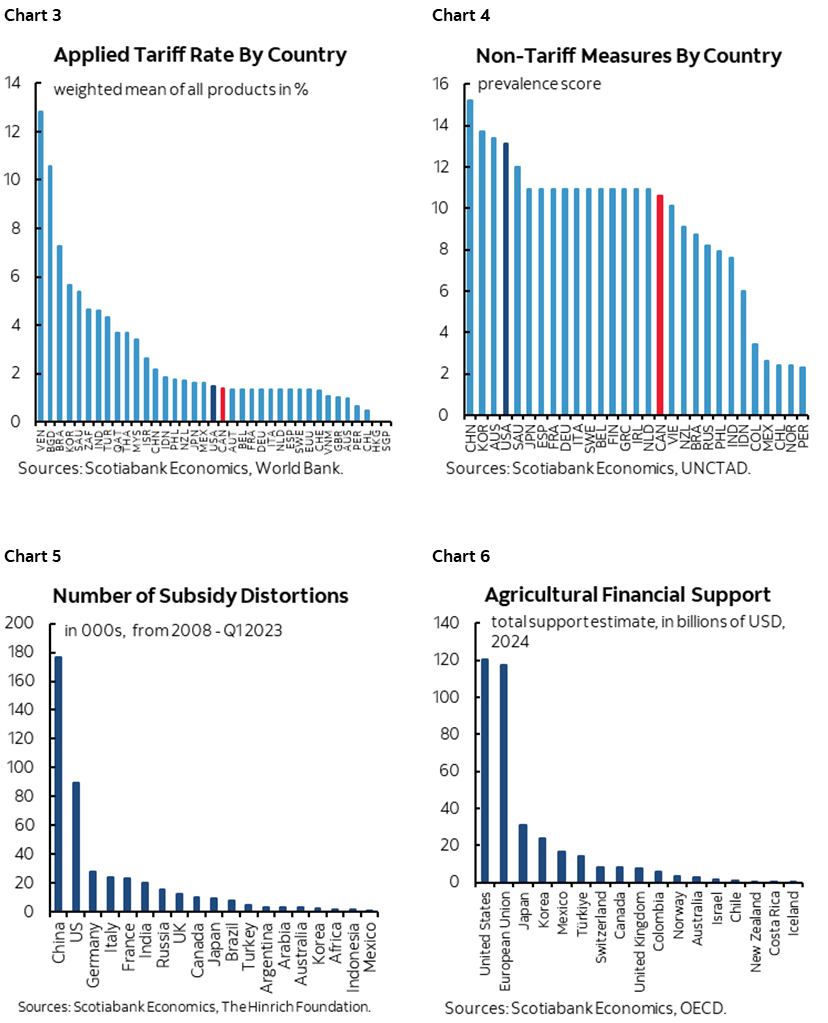
Chart 3 compares tariff rates by country before Trump 2.0 to show no material different in the US versus other major countries. Chart 4 shows no material difference in nontariff barriers. Chart 5 shows that the US leads the world in subsidies. Chart 6 shows this is also true just in the agricultural sector given the Farm Bill.
ASSESSING THE STATE OF THE UNION
President Trump delivers the annual State of the Union speech on Tuesday evening at 9pmET. It’s required by the US Constitution and is usually long on rhetoric, short on substantive policy leanings. It’s more theatre than something we would advise clients to take literally.
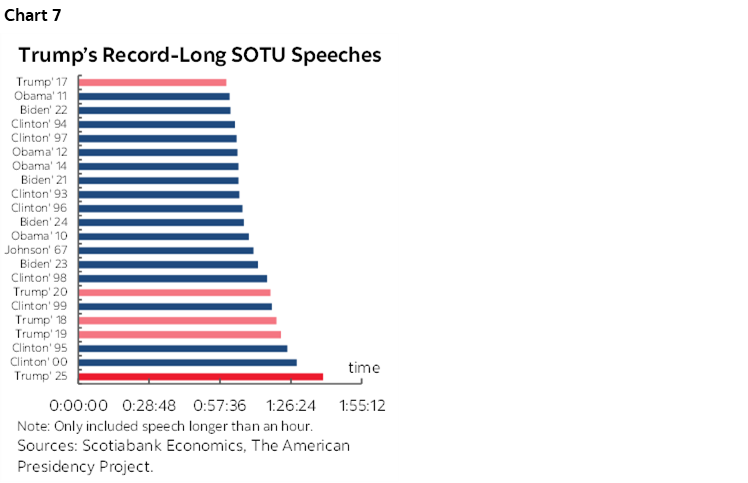
Don’t expect brevity. Last year’s speech—that wasn’t technically a SOTU speech but kind of was—broke the record for verbosity (chart 7). Trump may feel he has even more to say now amid sagging approval ratings and particularly in the wake of the SCOTUS tariff ruling. Nevertheless, it’s a good opportunity to take stock of the US after about thirteen months in office.
The Union is strong on the surface across some measures, but not as strong as Trump may claim while who claims credit for its strengths is open to debate. I’ll give an economist’s take on the state of the union in what follows.
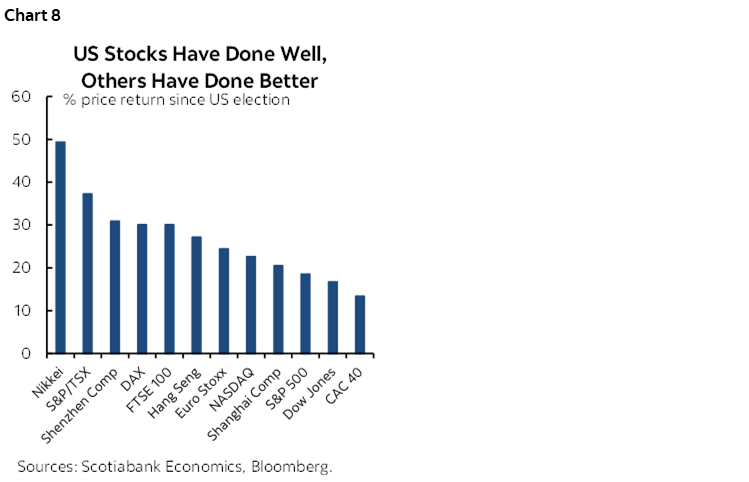
For starters, Trump will surely emphasize the role of the stock market as an arbiter of his policies. Global investors may have reason to think otherwise. The US stock market initially fell after Inauguration Day until April’s ‘Liberation Day’ but has since rebounded to be up 16% since the election on net. That’s great. Then again, in local currency terms, the US stock market has underperformed just about every other major global index since the election except France’s CAC40 (chart 8). Even China—that has taken the brunt of the hit from US trade policies absent a flexible currency’s offsets—has seen the Shanghai composite roughly match the S&P’s performance and the Shenzhen composite outperforming. As for who is to credit for US stock market performance, it remains the case that the ‘Magnificent Seven’ are riding a major tech wave that is difficult to attribute to the US administration. US stocks may be held back by uncertainty and little breadth.
Trump will also point to economic growth and has somewhat of a point, but not unambiguously so as the pattern has been very choppy. US GDP growth went from only 1.9% in 2024Q4 before dropping by -0.6% in Q1 as consumption growth stumbled and imports surged, to 2.5% in Q2 and 3.5% in Q3 before stumbling back to 1.4% in Q4 with mixed details (here). It’s too soon for GDP growth to reflect the full effects of Trump’s policies. We also don’t know if this is sustainable. It could be, if AI investment and consumption remain strong. Or growth may have been temporarily inflated by consumers front-running tariffs and the expiration of EV tax credits at the end of September plus the trade effects on growth as an initial import surge—that draws down growth—then subsided. Waning income growth and a negative housing wealth effect are red flags for sustainable consumption growth.
The unemployment rate remains low at 4.3% such that almost all Americans who want a job have one. Nevertheless, the unemployment rate is a smidge higher than it was in 2024 before Trump took office. That’s a bit of a curiosity since tighter immigration policy has pummelled growth in the pool of available labour.
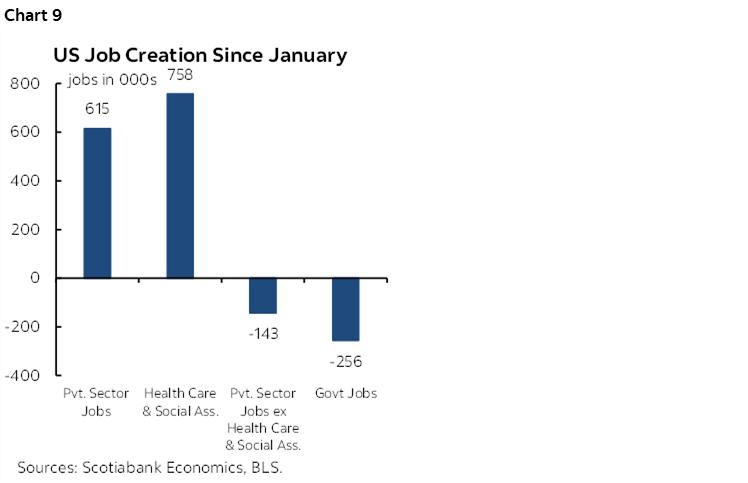
My favourite measure of US job growth is nonfarm private payrolls ex-health and social services. This measure is free of the DOGE cuts and takes out the broad health sector that marches to the beat of its own drummer. This measure has been trending downward (chart 9). This isn’t the place to get into the whole panoply of job market readings I’ve done elsewhere but suffice it to say they’re all looking weaker. One that is worth mentioning is the JOLTS job openings to unemployed ratio; it has slipped beneath 1.0 for the past two months, indicating fewer job openings than the number of unemployed Americans for the first time since April 2021.
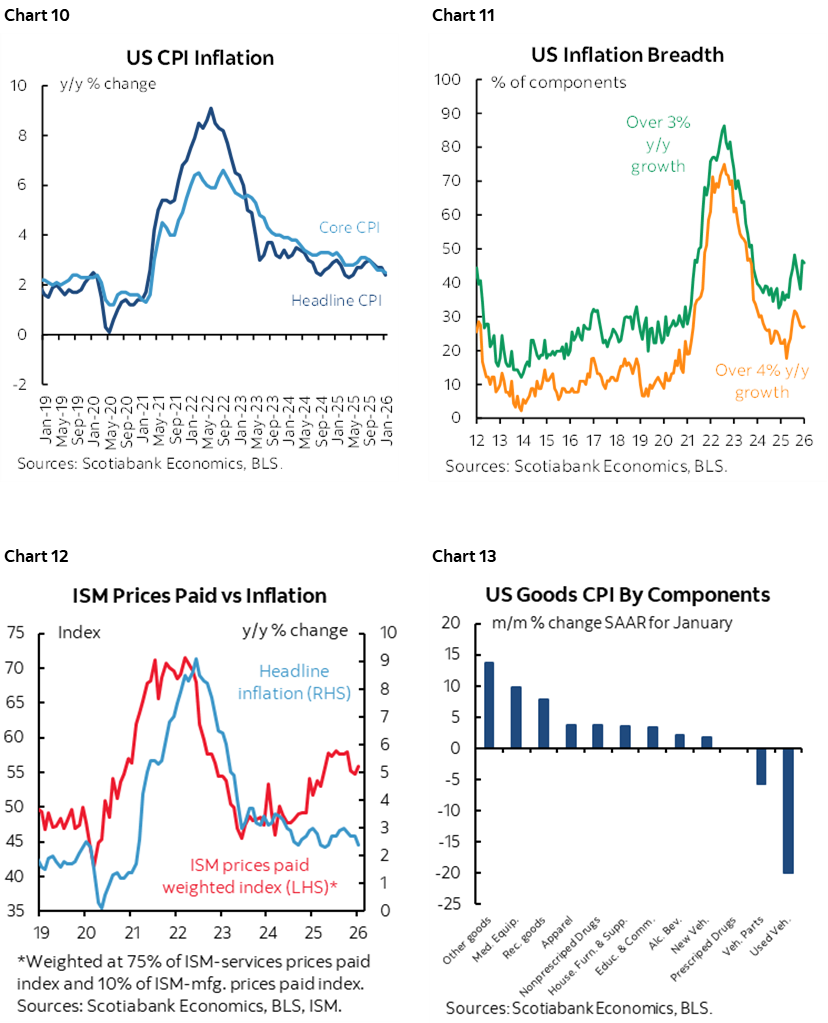
Inflation has come down from nosebleed territory but remains above the Fed’s 2% goal and with rising breadth (charts 10, 11). The US economy is in excess aggregate demand marked by a positive output gap that makes it easier to pass tariffs onto other businesses and consumers which is part of why the Fed references some pass through to goods prices. Prices are not coming down and we hope not to hear Trump reference a desire to achieve outright deflation given its potentially devastating consequences. Warning signs on future inflation include price gauges (chart 12). Further, despite denial, there is clear evidence that goods prices in tariff affected categories continue to rise (chart 13).
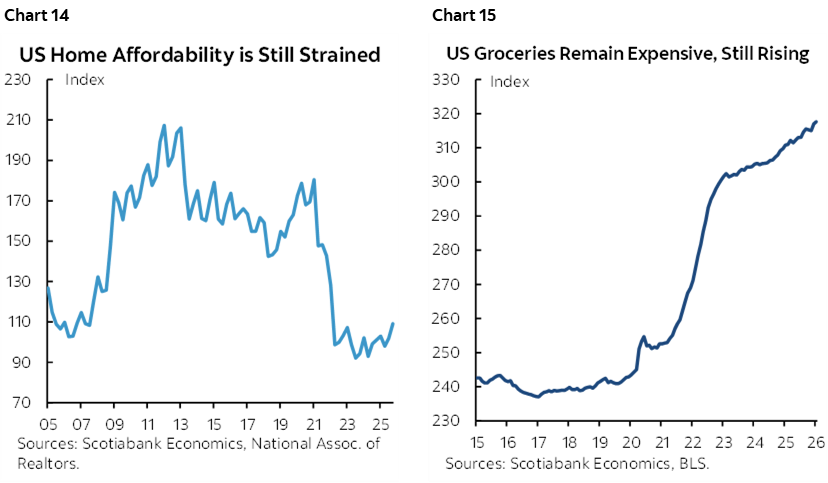
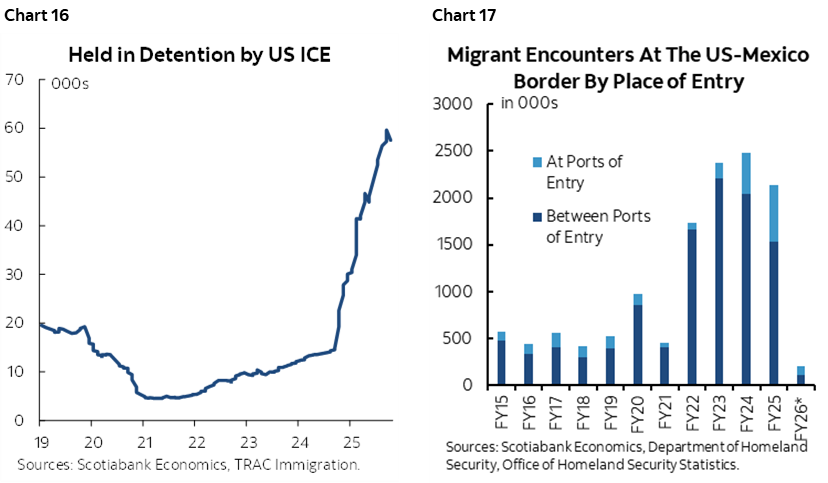
Related to inflation is the whole affordability narrative. US housing affordability remains at its worst in decades (chart 14). Groceries remain expensive after the pandemic surge not only in absolute level terms, but they continue to rise as measured by the US CPI food-at-home price index (chart 15). Opinion polls continue to demonstrate voter angst over affordability issues.
On immigration, Trump has generally stuck to his plans in terms of direction but is falling far short of threatened magnitudes. ICE detentions have soared (chart 16). Population growth has plummeted as immigration has been sharply curtailed (chart 17). Trump will present this as a victory in progress. Every nation needs to control immigration policy for purposes of planning schools, hospitals, roads, airports etc. The US southern border was a leaky sieve. Prolonged elimination of immigration, however, risks starving US businesses of labour and slowing growth.
On tariffs, see the first section of this weekly as the matter remains in flux.
The Federal Reserve has cut the policy rate by 175bps since September 2024 of which 100bps have been delivered since the US election. It remains above estimates of the neutral policy rate in what we figure remains restrictive territory. It could move lower this year, but the Committee is afraid of making the same mistake it made in the pandemic when it cut too far and was too slow to raise the policy rate as inflation risk climbed. Trump will repeat his line that the Federal Reserve is failing to provide enough accommodation. Many economists and market participants are likely to see things differently.
On trade deficits, it’s too early to tell, but we can say that so far there has been no clear improvement in them. Chart 18 shows the total trade balance in goods and services along with just the goods balance. The initial blow out of the trade deficit early last year was a continuation of the pre-existing trend combined with tariff front-running to import more before tariffs became effective. That effect may be diminishing now but it is still leaving intact trade deficits that are as high as before Trump took office.
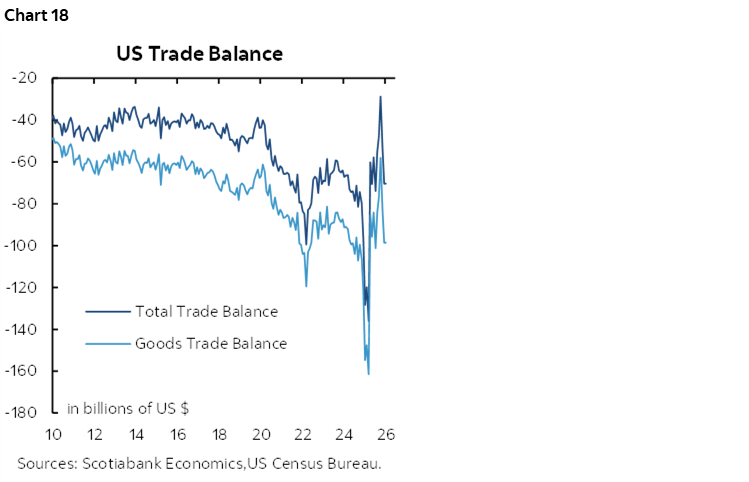
Why? The causes of the US trade deficit—and broader current account deficit that also includes net two-way investment income—include attractive US investment opportunities that bring in foreign capital which has been happening for many years, and too little saving. Washington dissaves massively, the household saving rate is low, retained earnings are solid but insufficient to fund investment and so the US relies upon a large capital account surplus that reflects reliance upon imported savings. The current account deficit is not in itself problematic to most economists, but if you wish to rein it in, then the US must lessen its net borrower status.
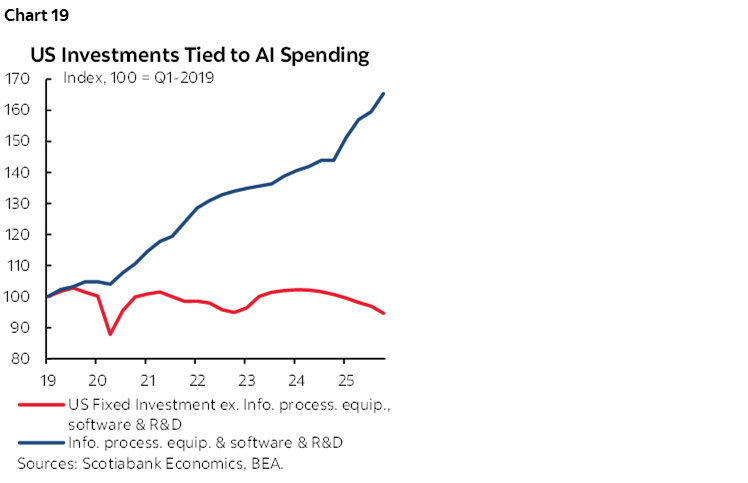
Investment in the US economy has performed well in aggregate, but only because of the AI-related surge. Take that out, and investment is weakening (chart 19).
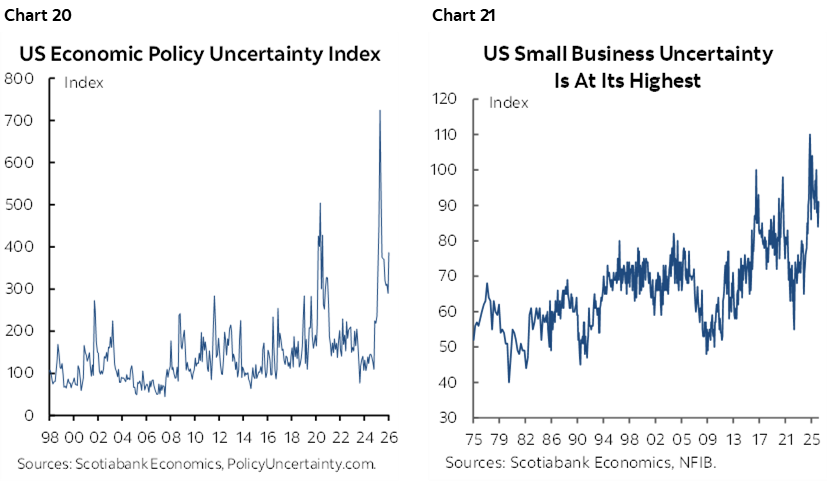
Policy uncertainty indices remain higher than historical norms but lower than ‘Liberation Day’ peaks (chart 20) while small business uncertainty is elevated (chart 21). This is weighing on confidence outside of the tech sectors.
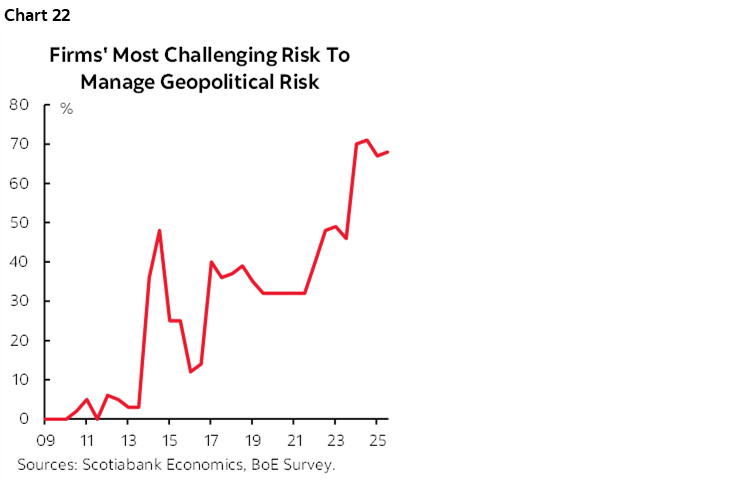
Geopolitical risk as measured by the Bank of England’s survey of the most challenging risks to manage has soared even while stocks have marched onward as tends to be typical outside of truly alarming shocks (chart 22).
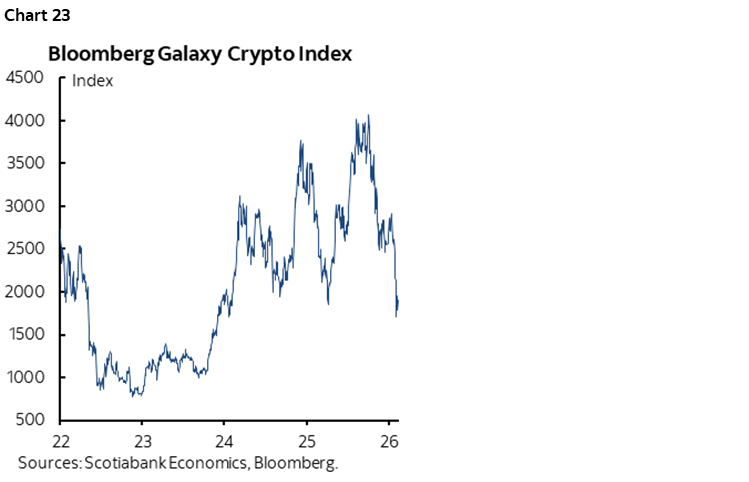
The White House loves crypto. Crypto prices don’t necessarily love the White House or—more likely—there are other considerations weighing down broad indices of cryptocurrencies (chart 23).
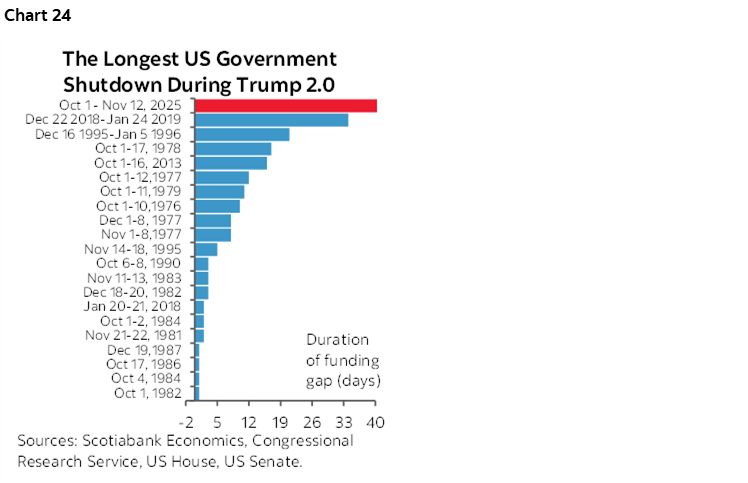
The first year of the Trump administration set a record long government shutdown (chart 24).
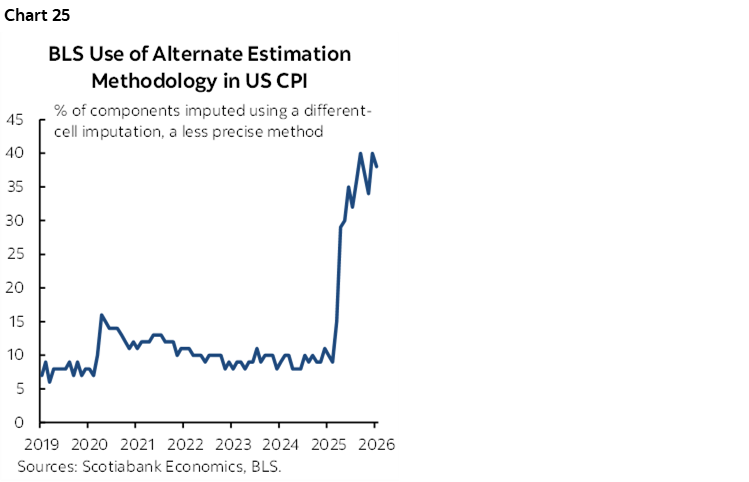
A pet peeve—but one that I think matters to markets and the Fed—is the deterioration in data quality. I have low trust for labour and inflation readings. Of the many possible measures of deteriorating data quality there is the one shown in chart 25; a record share of the CPI basket is being estimated through proxy methods (substituting for similar products, substituting for other markets) due to severe budget cuts across agencies including the Department of Labor.
There is also a natural tendency to compare multiple readings across Presidents and time. Enter charts 26–34. They compare US presidents across a number of measures on the economy, inflation, jobs, unemployment, investment, and markets. The red short lines track Trump’s term so far. I wouldn’t counsel reading too much into them just yet.
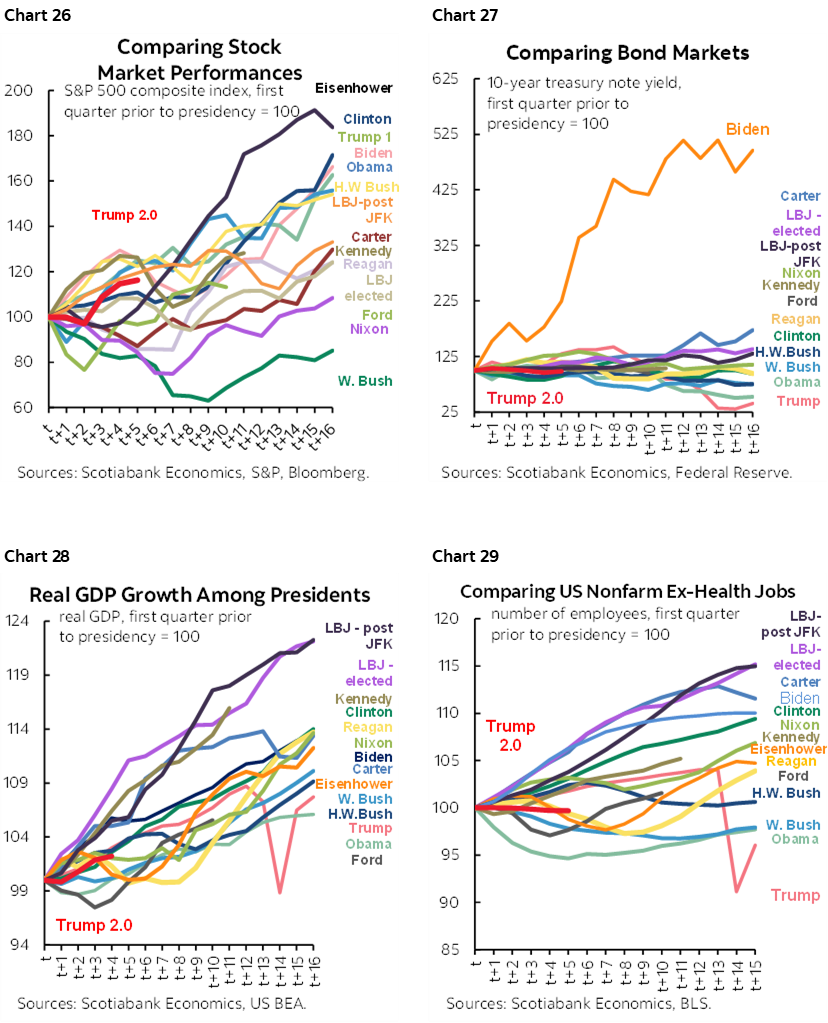
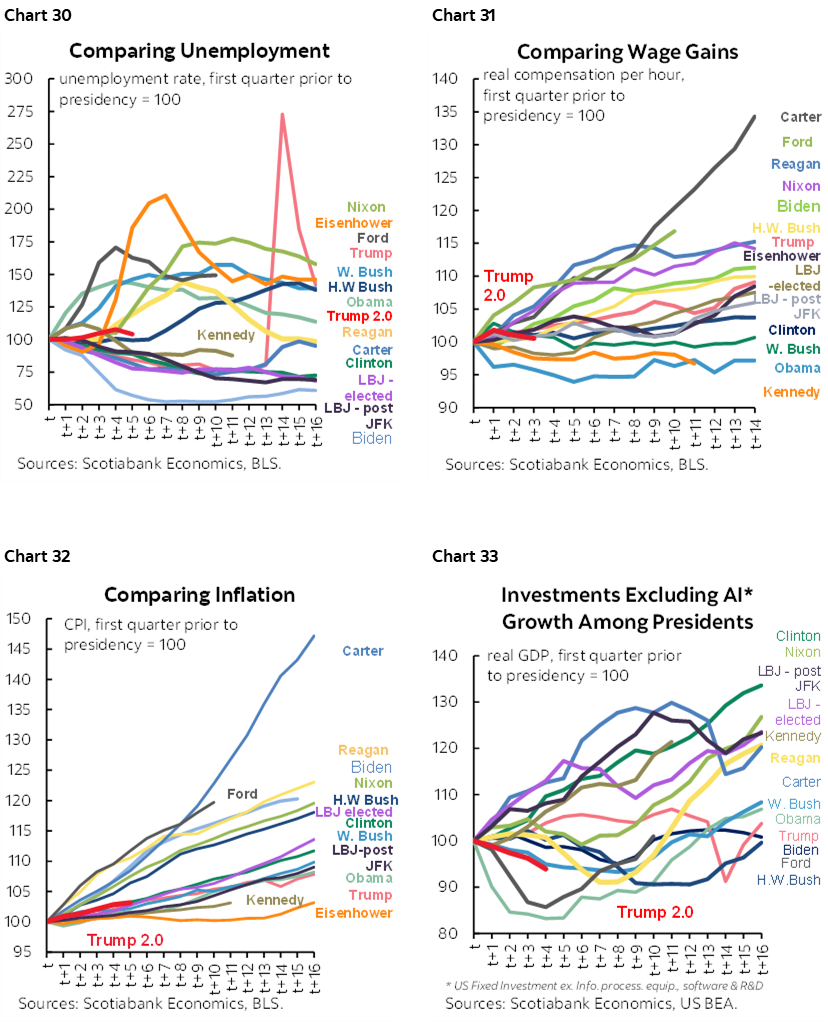
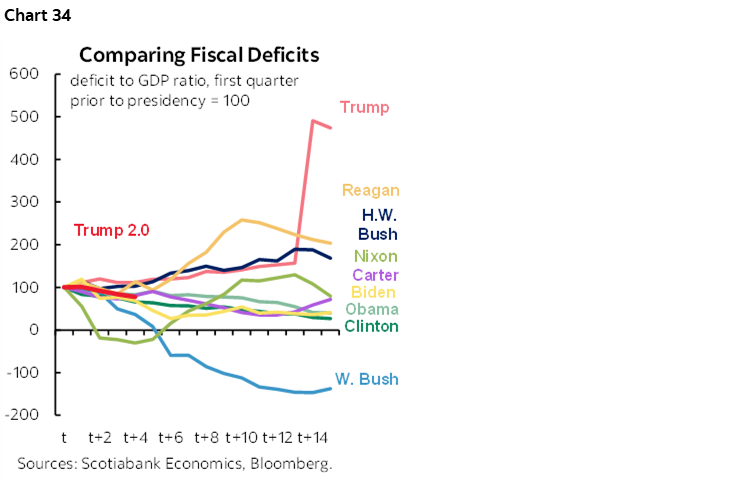
Compared to other Presidents at similar stages of their terms in office, Trump is largely an average American President to date but it’s early so a lot could change in either direction. One slight upside difference is performance of the S&P500 where he is above average but with several above him. He’s a little lower on inflation. He’s also a little lower on nonfarm payrolls and private nonfarm payrolls excluding the health sector.
CANADA’S ECONOMY—A WEAK ENDING TO 2025
What if Canada’s PM were to deliver a northern ‘state of confederation’ speech given that the one-year anniversaries of when Mark Carney became Prime Minister on March 14th 2025 and then won a minority government in the April 28th election are fast approaching?
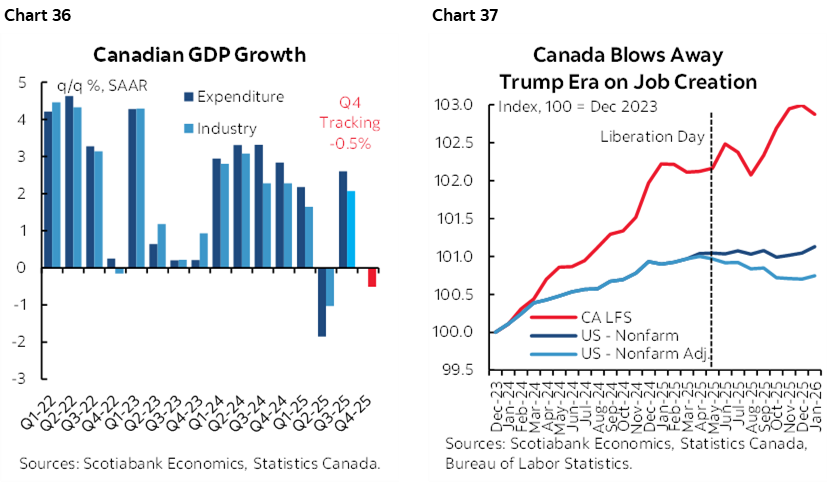
I’ll save most of that for another weekly closer to the dates, but a glimpse of it will arrive on Friday with fresh GDP figures for 2025Q4, the month of December with details, and the flash reading for January sans details. Expect the readings to be soft.
For Q4, we expect about -0.5% q/q at a seasonally adjusted and annualized rate (SAAR). December GDP was guided by Statcan to be up 0.1% m/m SA back on January 30th. My estimate with fresher data since then leans toward the same. January GDP is looking roughly flat.
The BoC had estimated Q4 growth at 0% before rebounding to a forecast 1.8% growth rate in 2026Q1. Maybe they’ll be right, but the details under the hood will also matter.
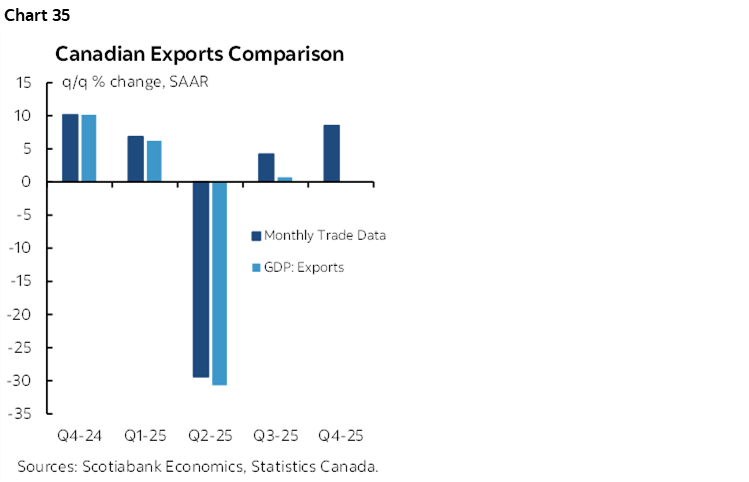
It’s possible that we will see Q3 GDP revisions. Recall that Statcan initially guesstimated trade figures for that quarter because their US compatriots were in a protracted government shutdown. Since then, we’ve learned that export volumes were higher using monthly figures including revisions compared to the initial export figures in the GDP accounts for Q3 (chart 35). Net trade contributions could be revised up in Q3 GDP, but we don’t know if that came at the expense of inventories or through higher production.
As an anniversary teaser, however, consider charts 36–37. Canada’s economy has underperformed the US. Canada’s stock market has performed better than the US in local currency terms since the US election in no small part due to commodities and banks as previously cited. Canada has posted more job growth than the US since the US started trade wars with everyone especially after adjusting nonfarm for serial overcounting.
CANADIAN BANK EARNINGS—PRICED FOR STRENGTH?
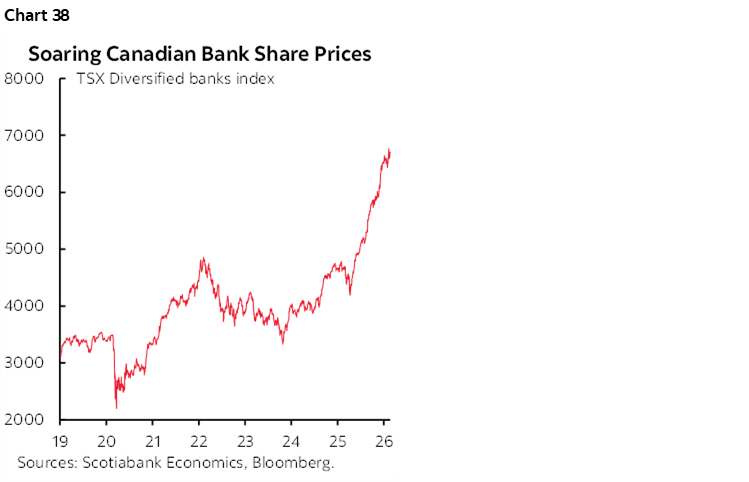
Will Canada’s Q1 bank earnings season rise to the occasion by way of supporting the massive rally in bank stocks since last April (chart 38)?
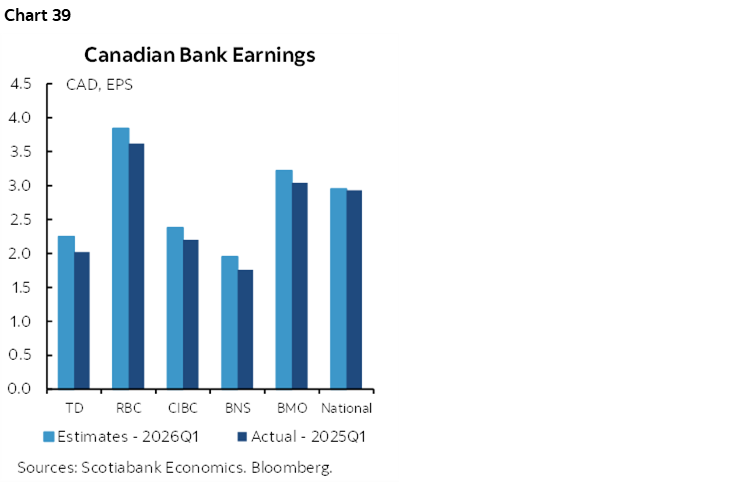
Thirty-eight TSX-listed firms will release earnings this week, but the banks will dominate given their heavy weights in equities and credit. BNS (my employer) kicks it off on Tuesday. BMO and National Bank follow on Wednesday. Thursday brings out TD, CIBC and RBC followed by Laurentian on Friday.
Chart 39 shows analysts’ expectations for Q1 compared to the same quarter last year, since earnings are not seasonally adjusted.
CENTRAL BANKS—REST UP FOR WHAT’S COMING
Lots of global central bankers will speak over the coming week, but only two regional Asian central banks will deliver policy decisions.
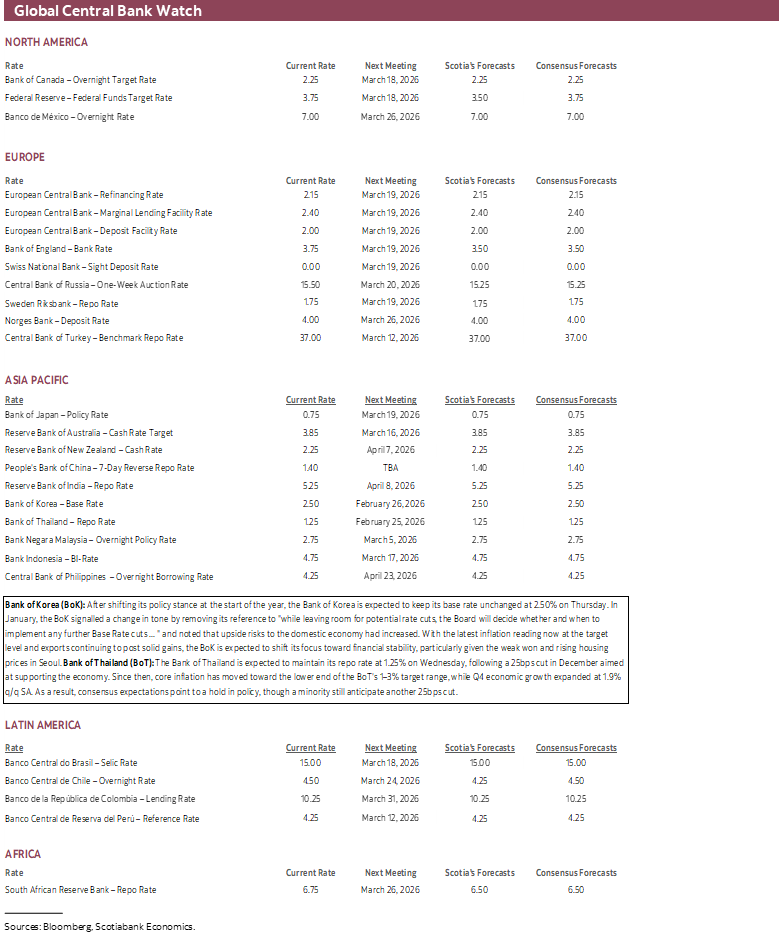
My advice? Enjoy it while it lasts. Mark off the week of March 16th for decisions by each of the Federal Reserve, Bank of Canada, ECB, Bank of Japan, Bank of England, RBA, SNB, Riksbank, Brazil, BI and CBCT. Independent central banks acting in unison like a flock of birds.
Bank of Thailand—Spreading them Out
Thailand’s central bank is expected to keep its repurchase rate unchanged at 1.25% on Wednesday. A small minority expects a cut. Markets generally expect a hold.
When it cut by 25bps at its last meeting in December, the BoT indicated a dovish bias and a willingness to adjust further while downgrading expected GDP growth. Since then, however, Q4 GDP surprised by tripling consensus expectations (1.9% q/q SAAR, 0.6% expected). Core CPI inflation remains low at 0.6% y/y. The BoT has also been taking a gradual approach to easing since last April with alternating cuts and holds.
Bank of Korea—Holding as per Guidance
Markets expect the Bank of Korea to keep its base rate unchanged at 2.5% on Thursday.
At its last decision on January 14th, the BoK unanimously held with five out of six board members indicating what Governor Rhee Chang Yong labelled as “a high chance” that the policy rate will be held unchanged until at least the April 10th decision. He said “it would be better to wait for more data and decide based on that.” The January statement also struck out reference in the prior November statement to the possibility of ‘any further Base Rate cuts.’
GLOBAL MACRO ROUNDUP
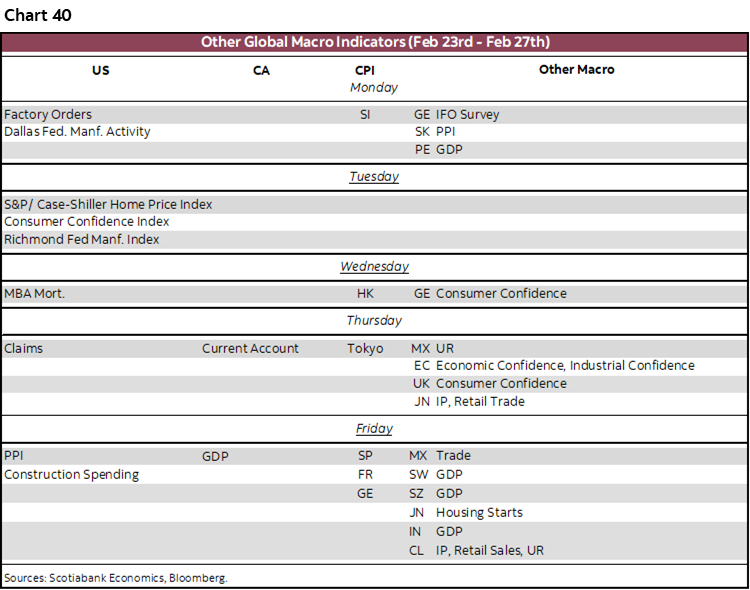
Chart 40 shows the rest of the global line-up of indicators due out over the coming week.
Australian CPI for January (Tuesday) might influence RBA hike pricing, but there is a high bar to hiking back-to-back with markets priced for a skip in March.
A few key economies kick off Eurozone CPI tracking for February. France, Germany and Spain release on Friday before Italy and the Eurozone tally the following week. Inflation traders will have keen interest, but our primary focus is upon policy moves with the ECB priced for doing basically nothing for the rest of the year. One more inflation report is unlikely to change that with the policy rate at roughly neutral.
The US line-up will be light with just a sprinkling of releases. Ones that are most likely to be potentially impactful to markets include consumer confidence in February (Tuesday) and producer prices for January (Friday).
Canada’s calendar will be dominated by GDP and bank earnings as otherwise it’s just about the lagging and often so heavily revised as to be unreliable SEPH payrolls report on Thursday.
Tokyo CPI for February (Thursday) will be closely monitored by BoJ watchers in the context of a priced policy rate hold on March 19th but over half of a hike priced for the April 28th meeting.
GDP readings will come from a few economies such as India for Q4 (Friday) with base effects among the drivers of softer year-over-year growth down to about 7%. Peru’s Q4 GDP on Monday is also expected to ease to under 3% y/y. Mexico updates the economic activity index for December on Monday that serves as a GDP proxy. Sweden’s GDP growth probably eased somewhat to just over 2% y/y in Q4 (Friday) while Switzerland’s GDP probably posted a small rebound from the 0.5% q/q nonannualized contraction in Q3.
DISCLAIMER
This report has been prepared by Scotiabank Economics as a resource for the clients of Scotiabank. Opinions, estimates and projections contained herein are our own as of the date hereof and are subject to change without notice. The information and opinions contained herein have been compiled or arrived at from sources believed reliable but no representation or warranty, express or implied, is made as to their accuracy or completeness. Neither Scotiabank nor any of its officers, directors, partners, employees or affiliates accepts any liability whatsoever for any direct or consequential loss arising from any use of this report or its contents.
These reports are provided to you for informational purposes only. This report is not, and is not constructed as, an offer to sell or solicitation of any offer to buy any financial instrument, nor shall this report be construed as an opinion as to whether you should enter into any swap or trading strategy involving a swap or any other transaction. The information contained in this report is not intended to be, and does not constitute, a recommendation of a swap or trading strategy involving a swap within the meaning of U.S. Commodity Futures Trading Commission Regulation 23.434 and Appendix A thereto. This material is not intended to be individually tailored to your needs or characteristics and should not be viewed as a “call to action” or suggestion that you enter into a swap or trading strategy involving a swap or any other transaction. Scotiabank may engage in transactions in a manner inconsistent with the views discussed this report and may have positions, or be in the process of acquiring or disposing of positions, referred to in this report.
Scotiabank, its affiliates and any of their respective officers, directors and employees may from time to time take positions in currencies, act as managers, co-managers or underwriters of a public offering or act as principals or agents, deal in, own or act as market makers or advisors, brokers or commercial and/or investment bankers in relation to securities or related derivatives. As a result of these actions, Scotiabank may receive remuneration. All Scotiabank products and services are subject to the terms of applicable agreements and local regulations. Officers, directors and employees of Scotiabank and its affiliates may serve as directors of corporations.
Any securities discussed in this report may not be suitable for all investors. Scotiabank recommends that investors independently evaluate any issuer and security discussed in this report, and consult with any advisors they deem necessary prior to making any investment.
This report and all information, opinions and conclusions contained in it are protected by copyright. This information may not be reproduced without the prior express written consent of Scotiabank.
™ Trademark of The Bank of Nova Scotia. Used under license, where applicable.
Scotiabank, together with “Global Banking and Markets”, is a marketing name for the global corporate and investment banking and capital markets businesses of The Bank of Nova Scotia and certain of its affiliates in the countries where they operate, including; Scotiabank Europe plc; Scotiabank (Ireland) Designated Activity Company; Scotiabank Inverlat S.A., Institución de Banca Múltiple, Grupo Financiero Scotiabank Inverlat, Scotia Inverlat Casa de Bolsa, S.A. de C.V., Grupo Financiero Scotiabank Inverlat, Scotia Inverlat Derivados S.A. de C.V. – all members of the Scotiabank group and authorized users of the Scotiabank mark. The Bank of Nova Scotia is incorporated in Canada with limited liability and is authorised and regulated by the Office of the Superintendent of Financial Institutions Canada. The Bank of Nova Scotia is authorized by the UK Prudential Regulation Authority and is subject to regulation by the UK Financial Conduct Authority and limited regulation by the UK Prudential Regulation Authority. Details about the extent of The Bank of Nova Scotia's regulation by the UK Prudential Regulation Authority are available from us on request. Scotiabank Europe plc is authorized by the UK Prudential Regulation Authority and regulated by the UK Financial Conduct Authority and the UK Prudential Regulation Authority.
Scotiabank Inverlat, S.A., Scotia Inverlat Casa de Bolsa, S.A. de C.V, Grupo Financiero Scotiabank Inverlat, and Scotia Inverlat Derivados, S.A. de C.V., are each authorized and regulated by the Mexican financial authorities.
Not all products and services are offered in all jurisdictions. Services described are available in jurisdictions where permitted by law.