Next Week's Risk Dashboard
- Two-week edition
- Comparing oil shocks then and now
- The method behind Iran’s strategy
- Why no one size fits all when evaluating oil shocks by country
- Monepalooza — a preview of fourteen coming global central bank decisions
- Canadian jobs — illusory softness?
- US CPI & PCE to be historical artefacts
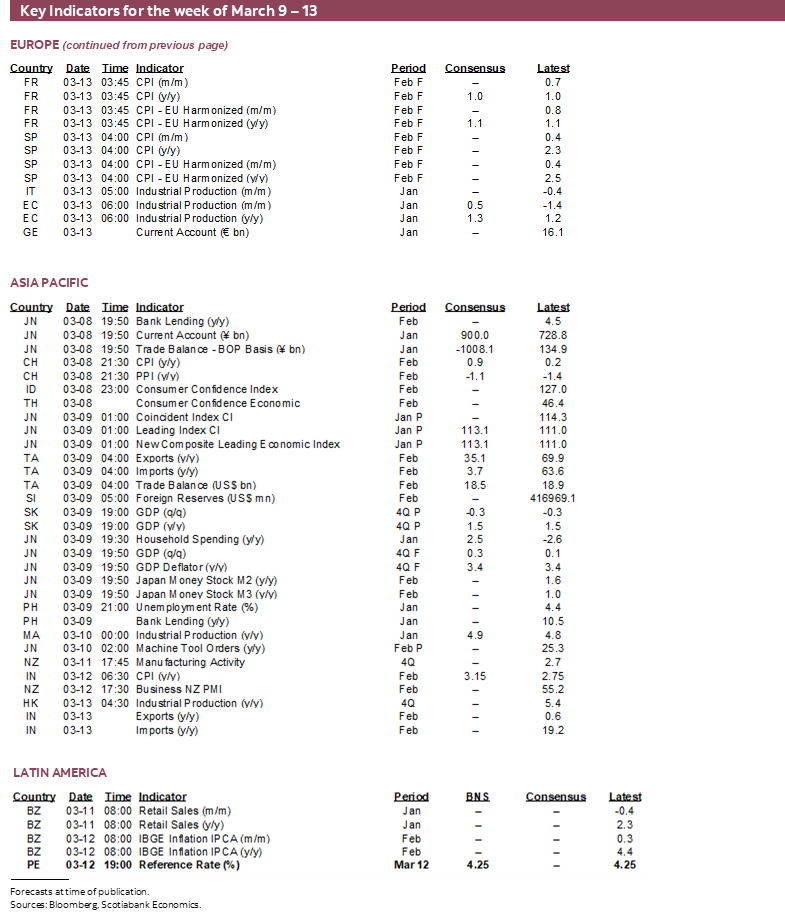
- Global indicators
Chart of the Week
This is a two-week March break edition of the Global Week Ahead. As such it will be heavily skewed toward how war with Iran could influence the stances of no less than fourteen central banks that will weigh in with updated decisions and communications. It starts slowly with two regional central banks in the first week and then a nearly unmanageable dump of a dozen others the following week.
Limited data previews will also be shared with a focus on Canadian jobs and stale US inflation updates.
IRAN’S STRATEGY BEHIND A DEEPENING OIL SHOCK
There is some understated method to Iran’s madness in attacking its neighbours across the Middle East despite isolating itself and facing retaliation. What Iran is probably trying to do is to replicate the conditions that existed during the oil shock of the Gulf War in 1990–91 in such fashion as to bring down the Trump presidency. If we’re going down, we’re taking you with us may be the rationale.
Iran is doing this by seeking to maximize damage to energy infrastructure throughout the region. If successful, then it could repeat the consequences of when Iraq razed Kuwait by literally pursuing a scorched earth policy that destroyed its oil fields and set wells ablaze. Estimates indicated 80–90% of Kuwait’s oil infrastructure was several damaged or destroyed. It took many months to repair and years to clean up the worst oil-driven environmental disaster in history.
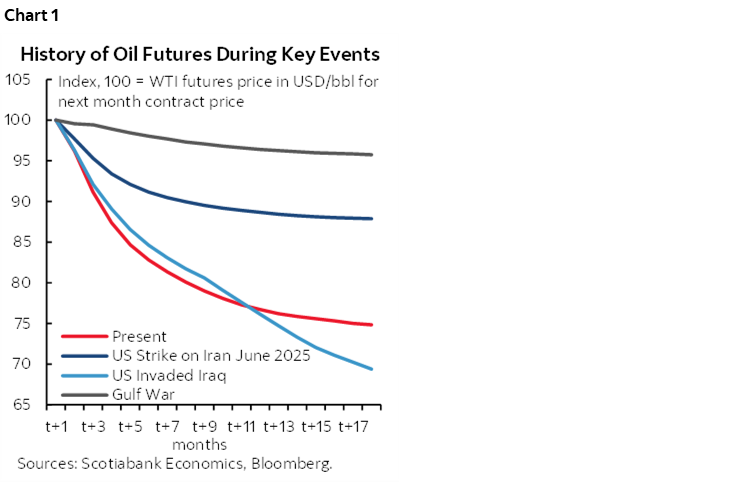
That is why oil futures markets at the time of the Gulf War signalled elevated prices for an extended period of time by comparison to the US invasion of Iraq in 2003, the bombing of Iran last year, and today (chart 1). Markets viewed the oil shock of the 1990–91 period as more permanent.
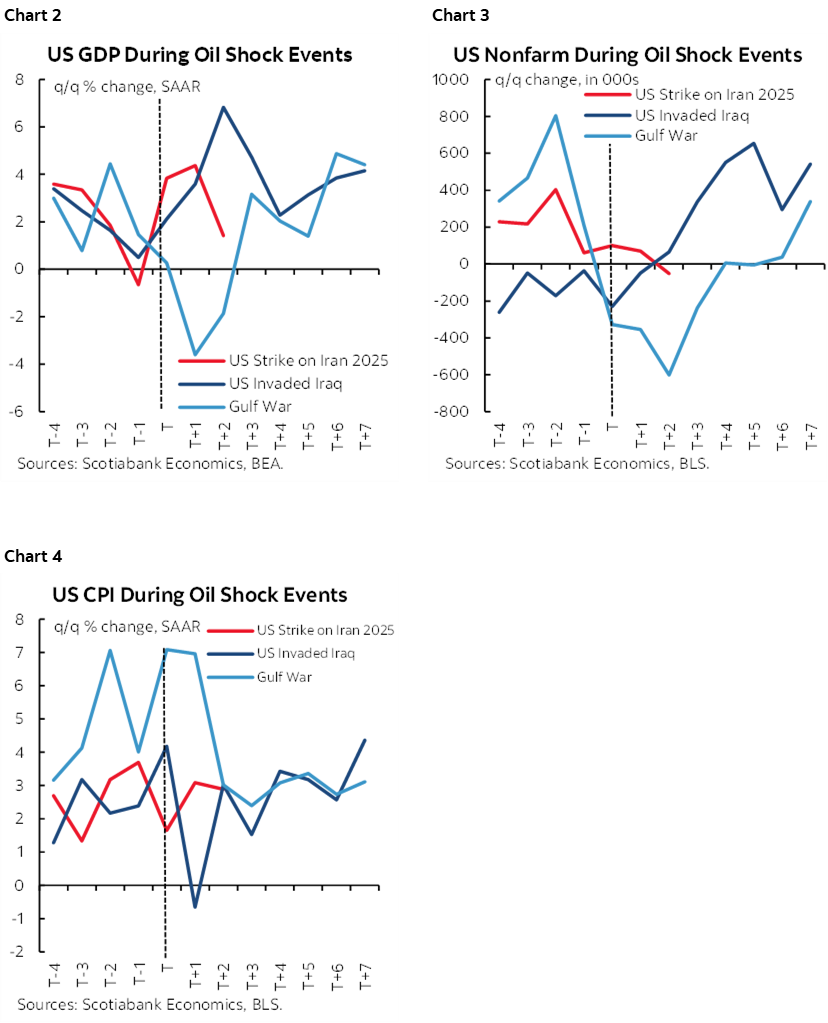
The consequences to the US economy are shown in charts 2–4. With remarkable speed US GDP contracted, job losses mounted, and inflation rose.
President H.W. Bush went on to lose the 1992 Presidential election to Bill Clinton by a 43–37.4% vote margin as Ross Perot took 18.9%. ‘Read my lips” about no new taxes didn’t help Bush either.
The risks to our forecasts are therefore rising but it would be premature to make wholesale forecast revisions at this stage and with explanations to follow.
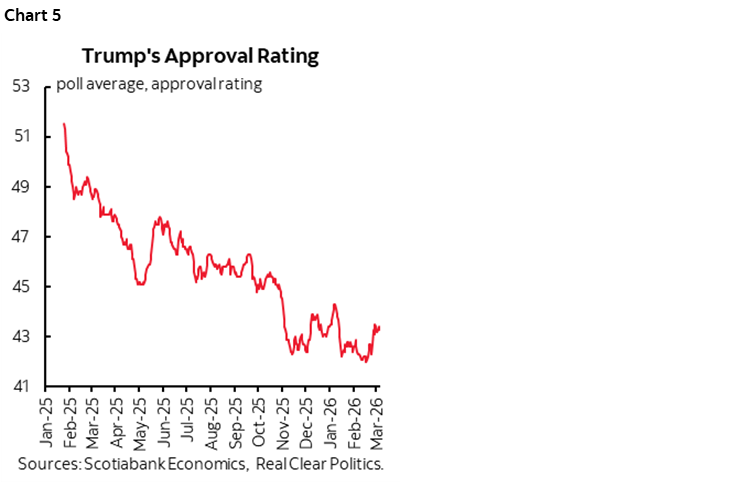
Could Iran succeed in replicating such an outcome today? Mr. Trump’s polling is falling (chart 5) and his war is generally unpopular. Polymarket betting odds are showing near-even odds of the Democrats sweeping both chambers in November and the Republicans retaining the Senate but losing the House. Beyond the difficulty of predicting American politics, there are, however, several differentiating factors between 1990–91 and today.
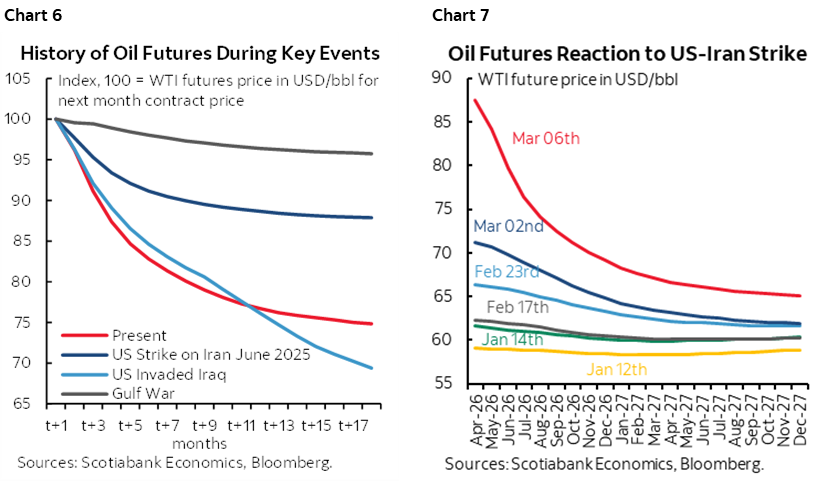
For one, oil futures prices are not as elevated relative to spot prices this time (chart 6) although the futures curve has been shifting upward with each passing day (chart 7). Futures are not necessarily accurate predictors of expected future spot prices compared to spot prices or a so-called no change forecast. Nevertheless, industrial users that hedge contracts for delivery in future are seeing much less pressure on oil prices than, say, retail buyers of gasoline and home/business heating that are more likely to pay spot prices or in some cases with regulatory lags. This serves to mitigate some of the oil shock’s effects on the broader economy relative to, say, 1990–91.
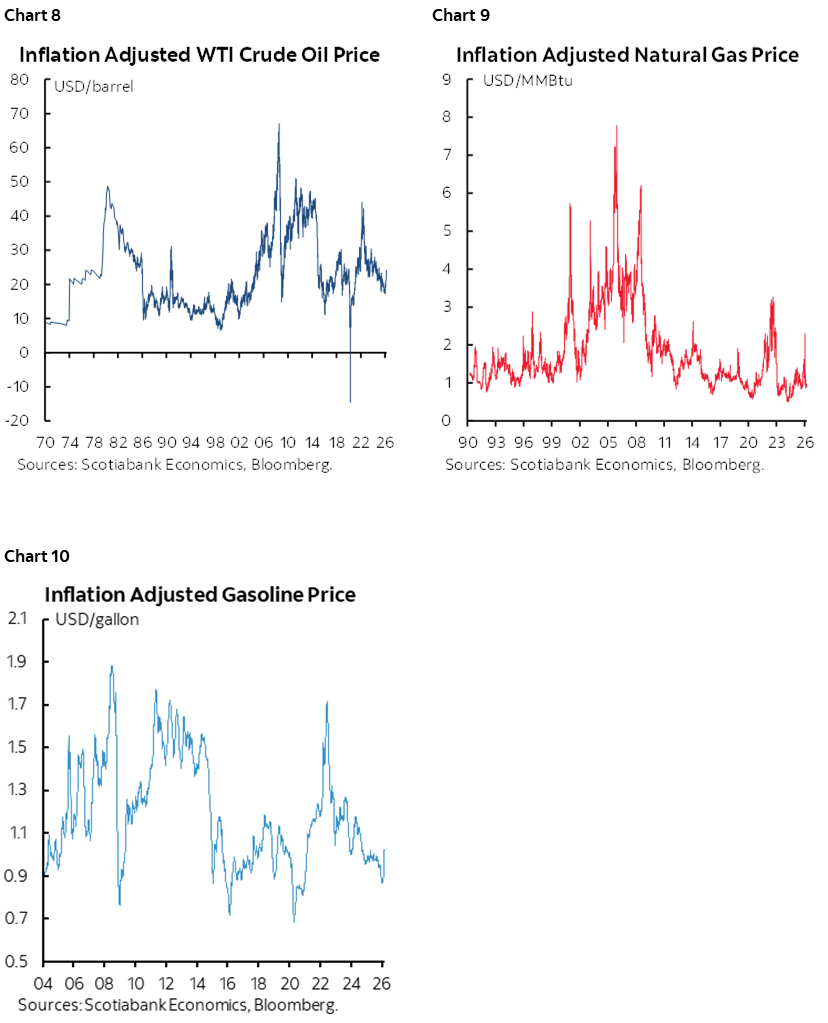
Second, the way to look at oil prices from the perspective of the overall economy is in real terms. Today’s prices are roughly around the long-run average (chart 8). The same holds true for real natural gas prices (chart 9) and real gasoline prices (chart 10). These are not devastating energy price shocks, at least not yet.
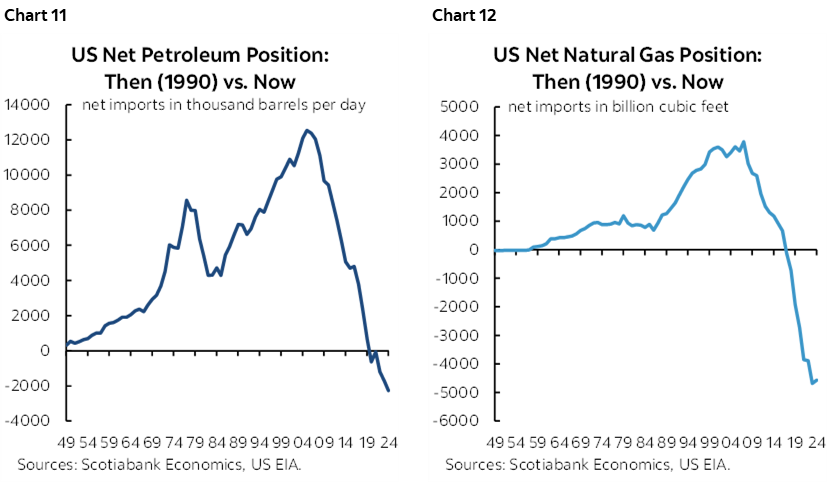
Third, the US was a large net oil and natural gas importer back then, but not so today (charts 11, 12). This means that an energy price spike hurts some and perhaps quite sharply so but can be of net benefit to the overall economy. Ditto for Canada that has long been a net energy exporter. In general, the Americas have more energy production and hence less vulnerability than, say, much of Europe and Asia.
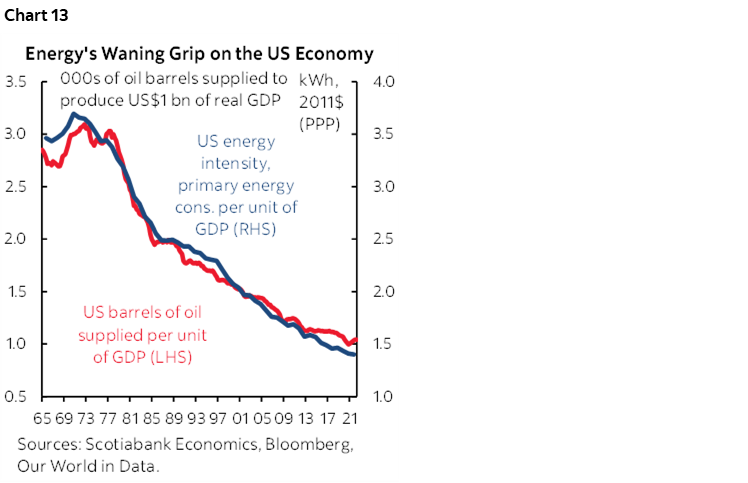
Fourth, the US economy requires less energy per unit of output than it did in the past (chart 13). The economy-wide production vulnerabilities to higher energy prices are smaller.
Fifth, the dollar was weak back in the early 1990s whereas today’s strength may limit inflation risk.
Key, however, will also be how global central banks respond. The typical playbook is to look through an oil price shock in most instances. To inflation hawks, however, they may feel like they’re being asked to look through an unusual number of supposedly temporary factors when in many cases they were never really quite comfortable with having licked inflation risk to begin with!
Because of the importance attached to how different central banks may respond and because I’ll be away next week, we’ll start with brief previews of how the following week’s onslaught of decisions by multiple central banks may unfold after addressing how the coming week’s regional central bank could behave.
CENTRAL BANKS—REGIONAL WARM-UPS
Only two regional central banks will deliver policy decisions this week. They could be the proverbial canaries in the coal mine as a tee up to the following week.
Banco Central de Reserva del Perú—Hawkish Tilt?
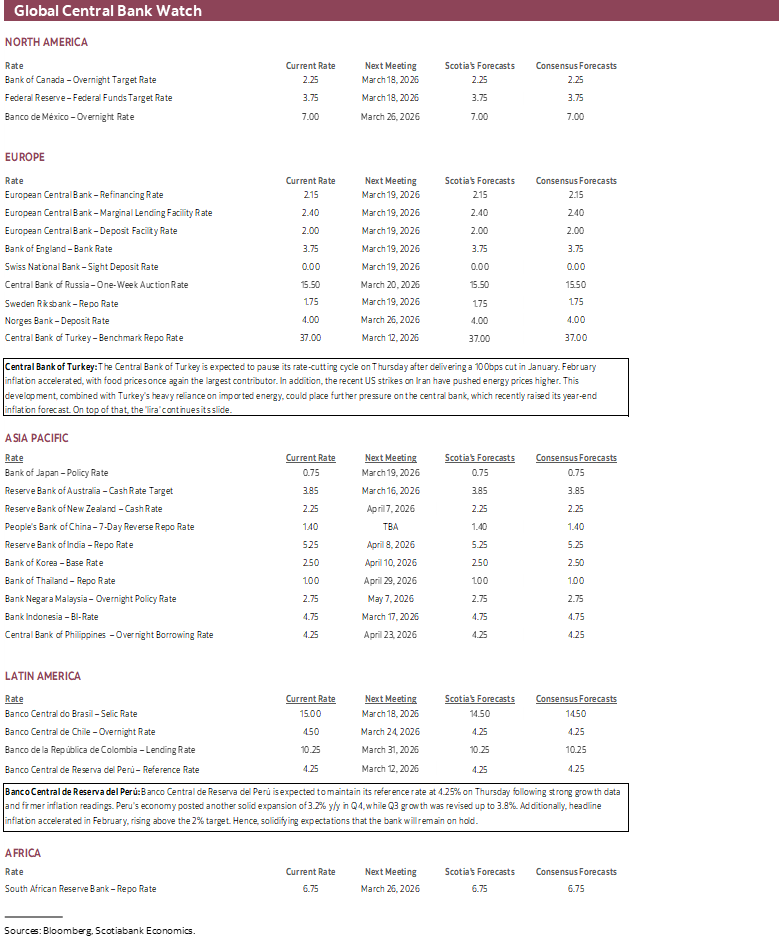
BCRP has been on hold at a reference rate of 4¼% since last August. It’s likely to extend the hold on Thursday. It may sound more cautious toward prospects for any further easing in a bit of a hawkish tilt. Peru is a net importer of oil such that the rise of oil prices in USD terms combined with currency weakness as the Sol has depreciated by about 3% since war with Iran broke out are likely to add upside risk to nearer-term inflation. This is adding to what was already a sharp upside surprise to Peru’s inflation rate in February (2.2% y/y from 1.7% prior and consensus).
Central Bank of Turkey—High and Higher
The Central Bank of Turkey is expected to pause its rate-cutting cycle on Thursday. Turkey imports almost all of its energy needs. While the lira has been little changed since the war with Iran began, it has been on a years-long depreciating trend that adds to import price pressures. CPI inflation reaccelerated to 31½% y/y in February with core at about 29½%, but the central bank downplayed the reading as driven by weather and Ramadan. They may downplay the oil shock given its preliminary nature, but it could ultimately thwart the central bank’s hopes that disinflation could enable further easing after cutting by a full percentage point in January.
MONEPALOOZA PREVIEW
As part of the two-week edition of the Global Week Ahead, I’ll provide brief previews of the second week’s round of policy decisions by central banks big and small from around the world.
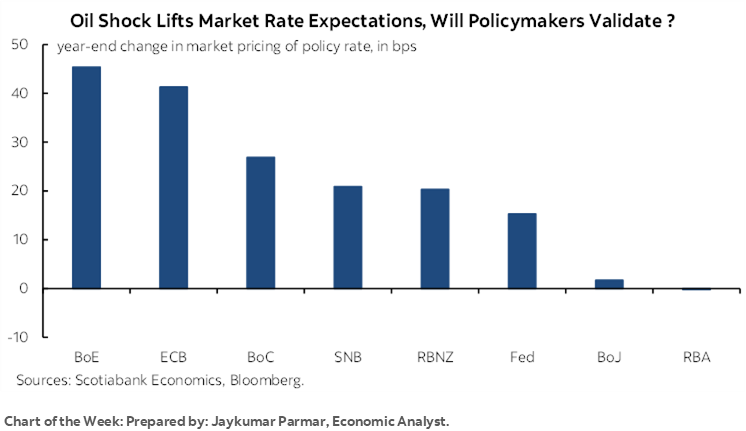
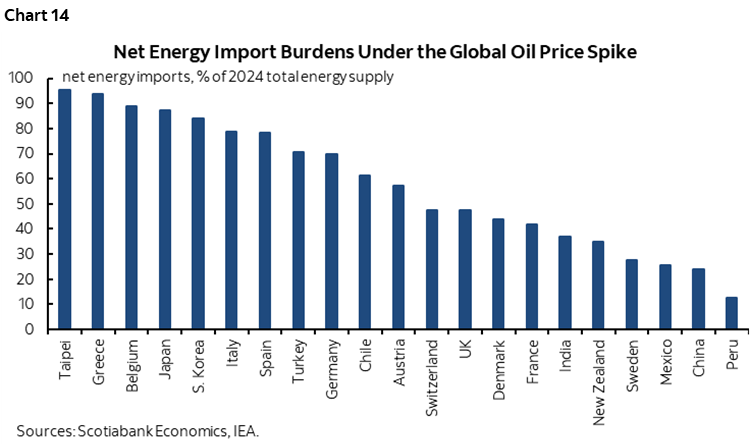
Expect considerable differentiation across the responses of global central banks. For one thing, the net energy import burdens vary sharply by country (chart 14).
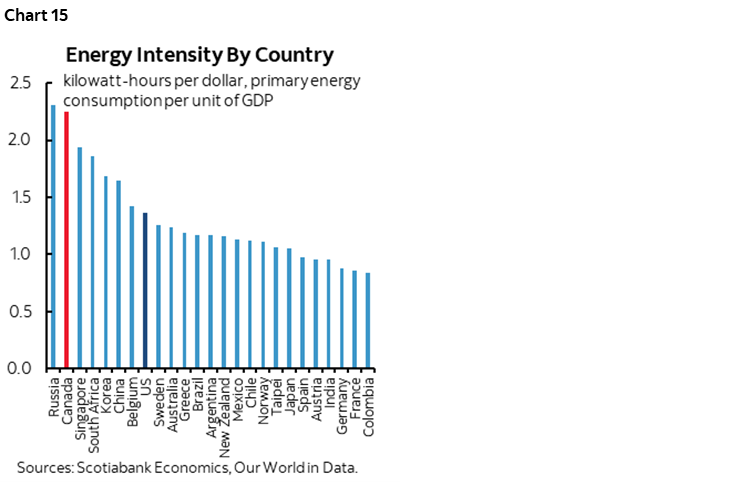
So do the energy demand intensities of GDP skewed to colder climates (chart 15).
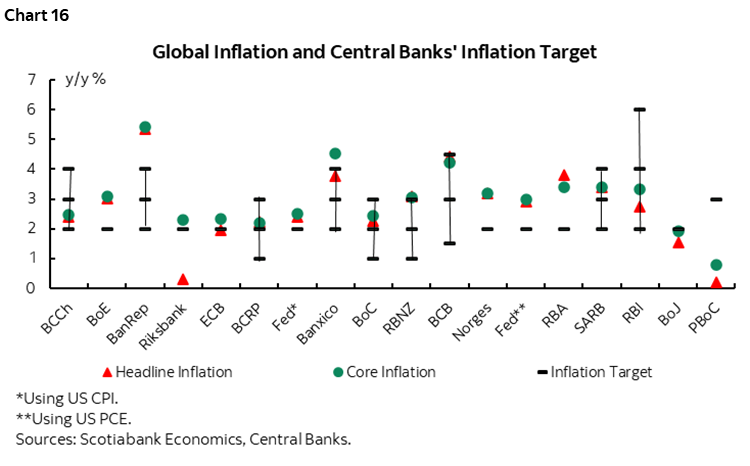
And of course, so do their starting points on inflation relative to central bank targets (chart 16).
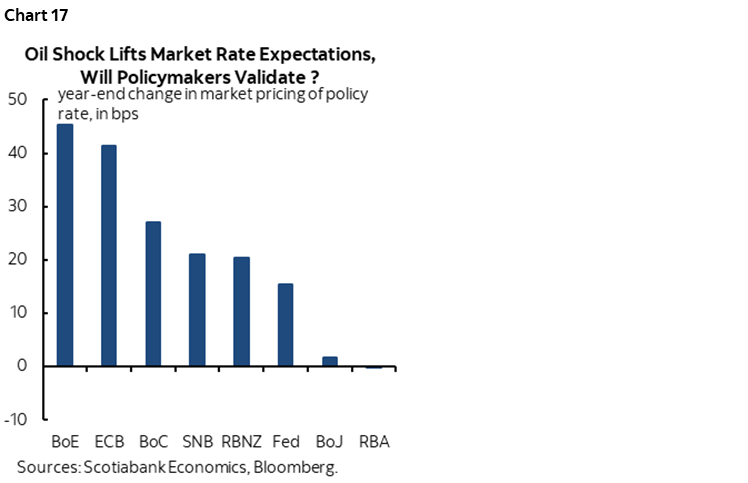
Markets are somewhat onto all of this by pricing varying responses of global central banks relative to just before war broke out (chart 17) but whether they are correct in each case is debatable. Either way, expect a shake up in relative central bank attitudes and possibly moves.
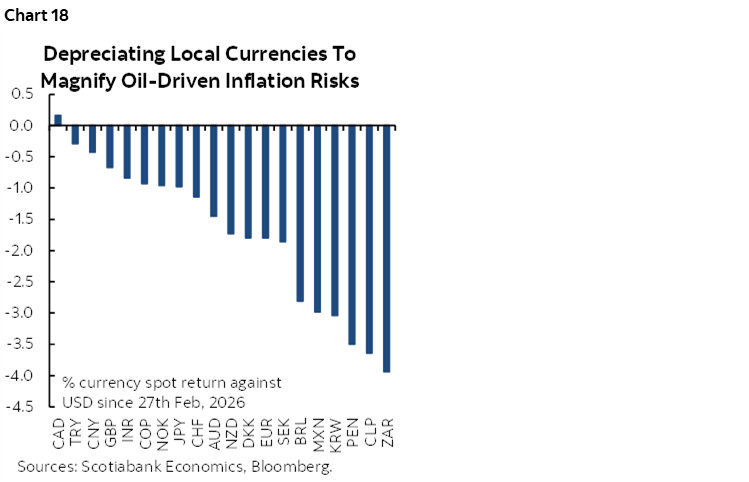
Currencies have also responded with wide variations as most—except CAD—have depreciated to the dollar (chart 18).
BOC—ANOTHER SOURCE OF UNCERTAINTY
No policy rate move is expected on Wednesday March 18th by Scotia Economics or consensus or markets. The statement and Governor Macklem’s opening remarks to the press conference land at 9:45amET and will be followed by the press conference (10:30amET). The next forecast update will be with the April decision. Policy rate guidance is likely to retain reference to it remaining “appropriate” at current levels while continuing to emphasize uncertainty. The layers of uncertainty that the BoC obsesses over are getting thicker by the day.
A lot has happened since the January 28th decision including forecasts. The BoC may emphasize strength in final domestic demand during Q4 instead of the weak GDP headline number while noting that tentative evidence of a GDP rebound in Q1 is in place.
The oil shock stemming from the war with Iran may dominate the attention, but the BoC is likely to say it’s too soon to evaluate its effects as the magnitude and duration are uncertain. Historically, the BoC has reacted in a relatively hawkish way to a sustained rise in oil prices. A net energy exporter receives imported income from the terms of trade lift that then trickles down through incomes in the household sector, improved fiscal balances, improved growth in aggregated corporate retained earnings and a more positive trade surplus. The effects can tend to add upside risk to inflation.
Canadian jobs will be updated on the Friday before the BoC and another drop could merit caution notwithstanding the importance of the details.
FOMC—IT’S ALL RELATIVE
The Federal Reserve is widely expected to leave its policy fed funds reference rate range unchanged at 3.5–3.75% on Wednesday March 18th. The statement and updated Summary of Economic Projections including the revised dot plot are due at 2pmET. Chair Powell’s second last press conference at the helm will start thirty minutes later.
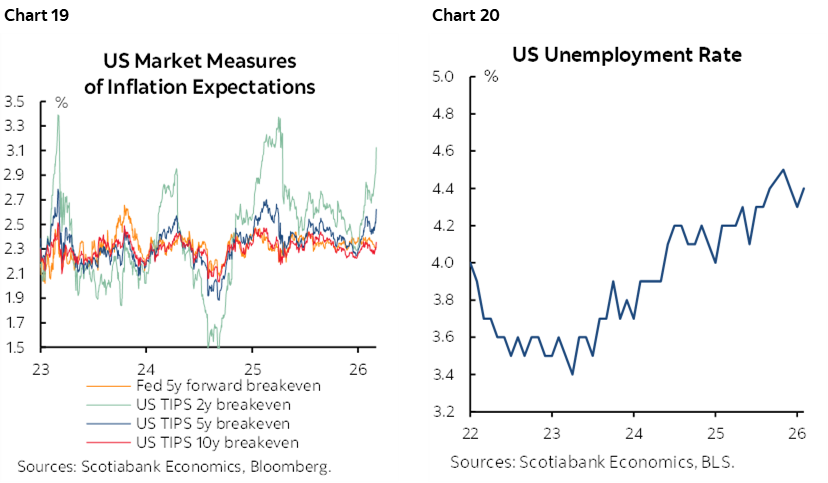
I think the FOMC is going to sound utterly paralyzed on March 18th. Both parts of the dual mandate are deteriorating and they won’t have a clue how to balance them by way of what to do in the short-term. Inflation expectations are rising (chart 19) and so is the unemployment rate (chart 20) as nonfarm payrolls continue to weaken (recap here). Hawks will be worried about inflation, more neutral-minded folks will look through some of the inflation risk to deteriorating jobs and they’ll cancel each other out with inaction until greater clarity on the extent and duration of the energy shock and the deterioration of the job market is realized.
Markets are still leaning toward 50bps of cuts this year but with material odds rising toward cutting by the June OIS contract.
It may be that the smartest thing to do would be for the Committee to leave the median Fed funds projections unchanged with just one cut this year and one more next year after which they hold flat through to the longer run. Removing cuts when they already had few may be more destabilizing than desired at a time of market turmoil. Adding more would be a tough sell in the current environment. Not overreacting at this stage is likely to be easiest to sell.
Key will be how the Committee revises its outlook for the unemployment rate relative to inflation. They may revise up the unemployment rate from 4.4% at year-end given it’s there now, but will they continue to show a pullback later? Revising up the inflation projection for 2026 is almost a slam dunk, but will they signal a) persistence beyond this year, and b) more pass through into core PCE?
All that said, we may be asking too much of the Committee. Their projections are not always internally consistent. Some forgiveness for precisely dotting the i’s and crossing the t’s is likely fair.
BANK OF JAPAN—STILL ON TRACK?
Markets are expecting the Bank of Japan to keep open the option of another rate hike at the next meeting on April 28th when Governor Ueda delivers the communications on Thursday March 19th. No material chance of action is priced for this meeting.
Prior Bank of Japan research (here, especially pp.20–21) estimated that a one standard deviation in oil prices of roughly 15% would add 0.1–0.3 percentage points to inflation inside of a year. The move in oil prices has been roughly three times that size which may imply—all else equal—that higher oil prices could add 0.3 to almost 1% to inflation in nearer-term quarters before trailing off.
Key is permanence. It’s highly premature for the BoJ to judge upside pressure on oil prices to be permanent and the futures market is not signalling such an expectation at this time.
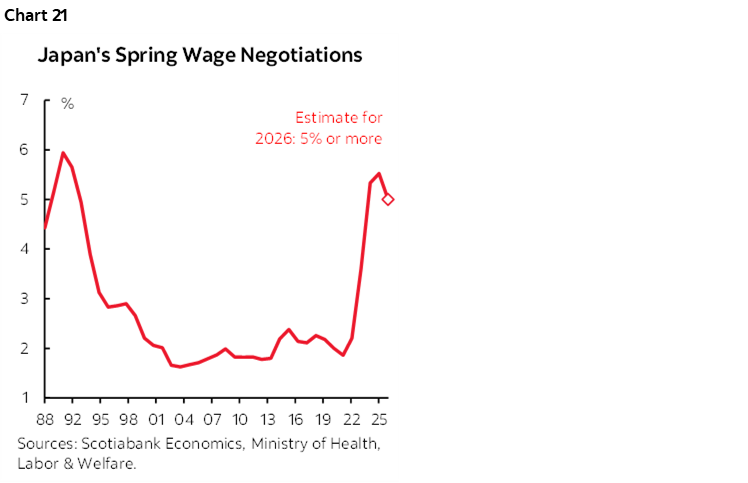
Still, another piece of evidence that the BoJ is likely still moving toward rate hikes is that the spring Shunto wage negotiations are well underway with key labour unions reporting an average rise of over 5% this year. That would extend the multi-year pattern of strong wage gains (chart 21).
In addition, some sterilization of expansionary monetary policy may be required given PM Takaichi’s plans.
ECB—DON’T DO THAT AGAIN
No policy changes are expected when the ECB delivers its decisions on Thursday March 19th. Key may be the forecasts.
Markets spent the past week bringing forward the probability of a rate hike this year. A move by year-end is now fully priced with gradually rising probability from the April decision onward.
Key will be the degree to which the Eurosystem staff macroeconomic projections update the inflation forecast. The last forecast in December expected total inflation to gradually ease to 1.9% in 2026 and 1.8% in 2027 with core inflation at 2.2% and 1.9% over the two years respectively.
Higher oil and natural gas prices put upside risk to this projection for total inflation, but only if sustained. Further, we’ll want to hear President Lagarde’s judgement being applied to the prospect of a generalized inflation shock or a relative price shock attributed to higher energy prices.
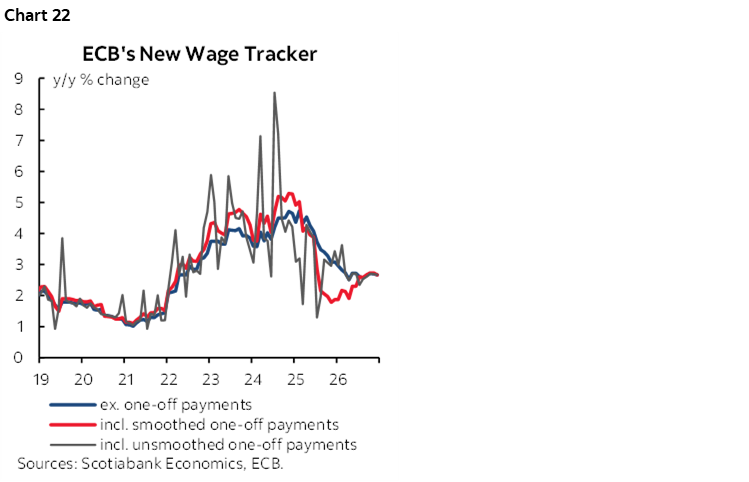
The Eurozone economy is neither in a state of material excess demand nor supply but facing downside risks to growth while wage growth has eased but remains above the 2% inflation target (chart 22). Therefore, a surge in energy prices could add to near-term inflation risk but quash inflation through second-round effects by crimping purchasing power of consumers.
If so, then the ECB would not wish to make the same mistake that former President Jean-Claude Trichet may have made in 2011 when he hiked the deposit rate on the heels of the Global Financial Crisis because of commodity-induced inflation risk only to reverse the hikes months later. Oil prices had been rising by over one-third from late 2010 to early 2011. Back then, core inflation peaked at about 1½% y/y and then began sliding back to under 1%.
BOE—EXACTLY WHY ARE YOU EASING?
Governor Bailey and the rest of the MPC are likely to pass on a rate change on Thursday March 19th while nevertheless guiding that further easing may still be feasible beyond. That may be a tougher sell this time as even with markets pricing most of another quarter-point Bank Rate cut by year-end—down from 2+ cuts that were previously priced.
With the rise in Brent oil prices has gone an increase in inflation expectations derived from inflation-linked bonds (chart 23).
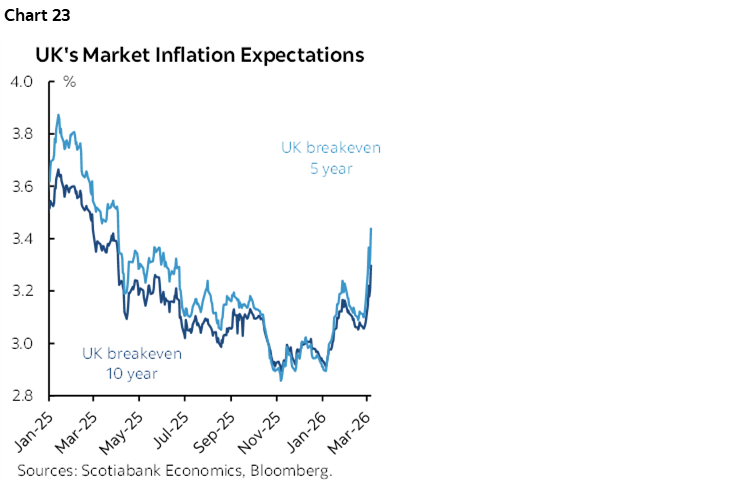
Recall that the starting point for UK CPI inflation is 3% y/y as of January with core inflation at 3.1% and services CPI up 4.4%, making the UK very different from the Eurozone’s starting point. Progress toward reduced inflation has been made even over the past six months or so, but mission accomplished is nowhere in sight especially with the uncertainty of an oil shock looming overhead. The BoE will also have an eye on labour market readings for January and February hours before the decision.
In short, the market is quite rightly questioning why the BoE would be contemplating further easing given the starting point and the added layer of uncertainty over how energy prices drive headline inflation and perhaps spill into core inflation.
RBA—TEEING UP POLICY OPTIONALITY
Despite Governor Bullock recently saying “I’m not making a prediction about March, but it will be a live meeting,” markets are only pricing about a one-in-three chance of a hike on Tuesday March 17th.
She noted “We have inflation at 3.8% headline, and we have unemployment at 4.1. The board will be actively looking at whether or not it needs to move more quickly. So I would discourage people from thinking that we necessarily only meet every quarter.”
The result is likely to be a divided consensus going into the meeting with some taking the risk of a hike call while others still pushing out the follow-up hike to January’s move until the next decision in May.
Australian markets will quickly move toward assessing the job market when fresh figures are offered on Wednesday.
CBCT—LOOKING THE OTHER WAY, FOR NOW
No change is expected in Taiwan’s discount rate of 2% when it updates its stance on Thursday.
Since Taiwan is dependent upon imported energy it is likely to passively tolerate an oil price shock for a time but raise concern should longevity unmoor inflation expectations. Markets expect the next policy rate move to be up but not until into 2027.
RIKSBANK—RINSE, REPEAT?
Sweden’s central bank is likely to stay on hold at a policy rate of 1.75% on Thursday while repeating that a rate hold is likely “for some time to come.” Prior explicit rate guidance in December pointed to the next move being up, but not until 2027 or later. Key this time will be how updated projections guide the outlook for the policy rate. It’s likely premature to expect a significant pivot in response to higher oil prices and risks to inflation and inflation expectations.
BI—RUPIAH INSTABILITY RETURNS
Bank Indonesia’s recent currency market interventions to stem the slide of the rupiah in response to the war with Iran are likely to mean that the central bank will stay on hold on Tuesday March 17th. The rupiah has been depreciating since August of last year. If deemed long-lived, the oil shock could motivate a more durable monetary policy solution than currency interventions.
BCB—PLANS ON HOLD?
Will a cut in the Selic rate be downsized or postponed compared to earlier plans when Brazil’s central bank issues its next decision on Wednesday March 18th?
Recall that at its previously decision on January 28th, BCB explicitly stated “the Committee deemed it appropriate to signal the beginning of an interest-rate easing cycle in its next meeting.”
Then oil prices soared as tensions across the Middle East built up starting in January. WTI oil has risen by about US$25/barrel since then.
Developments have prompted somewhat more cautious guidance of late. A BCB official noted “there have been developments that we cannot ignore.” Brazil’s status as a net crude oil exporter raises imported income.
SNB—LIKELY TO WELCOME DEVELOPMENTS
Thursday’s policy rate decision by the Swiss National Bank is unlikely to budget from 0%. Markets are priced for no action until hike risk after 2027.
Inflation is running close to 0% y/y and the SNB has been reticent to broach negative territory to date despite underperforming on its inflation mandate. Upside risk to inflation from higher oil prices and the Swiss franc’s depreciation during the war with Iran are likely to be welcomed particularly since the franc is still firmer than it previously was and the duration of the shock to energy prices is uncertain.
RUSSIA CB—MORE CAUTION?
Russia’s central bank may continue easing on Friday March 20th but the impact of higher oil prices and judgement over how the government will use the revenues could add caution. Accumulating downside risk to growth had kept the bank on an easing trajectory.
CANADIAN JOBS—ILLUSORY SOFTNESS?
Canada updates jobs numbers for February on Friday March 13th. If expected weakness proves to be on the mark, then it may conflict with more hawkish drivers of the Bank of Canada’s policy outlook. I’ve gone with a drop of 20k jobs and an unemployment rate increasing a tick to 6.6%.
I’ll give the arguments in a moment but never bet the farm on Canadian jobs. It’s a small sample with a ginormous 95% confidence band of +/-57k around estimated changes in the number of jobs. It’s not a totally random sample either, since the survey employs a rotating panel sample design that retains respondents in the sample for six months and rotates out one panel at the start as a new month is added. This can lead to allegations of statistical correlation across the monthly estimates.
As for the arguments in favour of a negative this time, there are two main arguments.
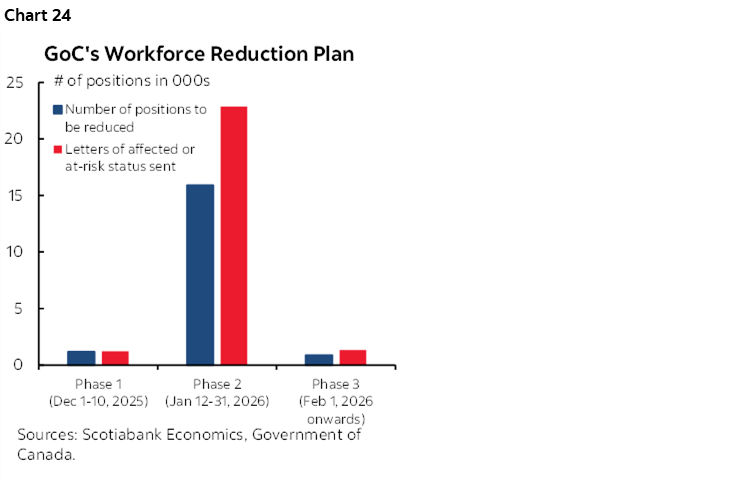
One is that the Federal government’s civil service reductions may be a weight on the report. This link provides the estimated figures over three phases and broken down by federal department. Columns #2 and #3 in the table provide the relevant numbers. Phase 2 layoffs will cover part of the change between February’s Labour Force Survey reference week of the 15th to the 21st and January’s reference week of the 11th to 17th. An unknown portion of phase 3 layoffs starting on February 1st (and hence extending over future months) may also impact the February reference week. Furthermore, some of these positions will be reduced through attrition or retirements, while some may be at risk. All totalled, the phase 2 and phase 3 layoffs total about 16k of which I’ve assumed a portion will apply to February’s numbers. Chart 24 shows the numbers by phase.
Second is a combination of what tends to happen in months of February combined with distorted seasonal adjustments. Chart 25 shows February is normally a seasonal up-month for jobs in Canada. Chart 26, however, shows that the seasonal adjustment factor has been tracking at very low levels throughout the 2020s and is trending lower. If the SA factor for February 2026 maintains last February’s SA factor or lower and we get a seasonally unadjusted gain of anywhere up to about 110k then the seasonally adjusted change in total employment would be a negative.
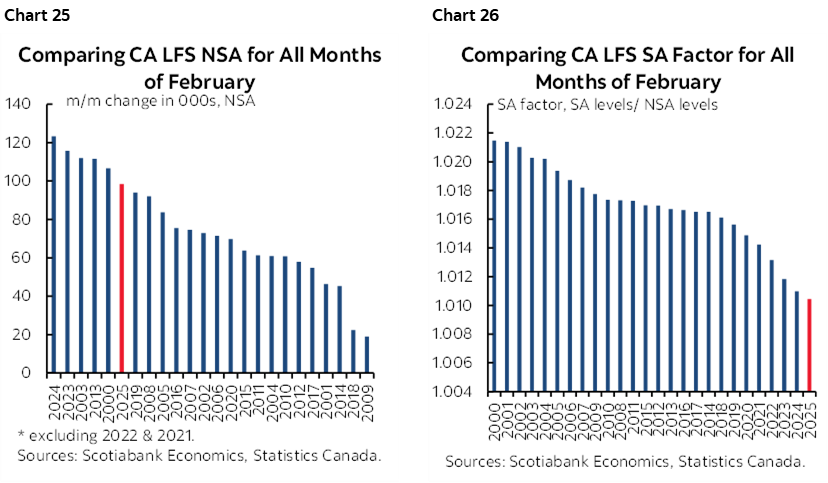
Chart 27 shows various scenarios for the seasonally adjusted change in employment given various assumptions for the SA factors and seasonally unadjusted change. Most reasonable scenarios for the seasonally unadjusted change and the SA factor reveal a weak report.
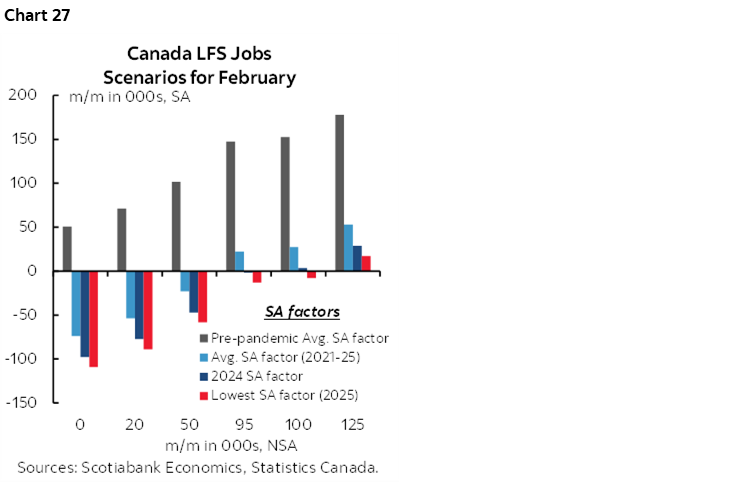
Somewhat paradoxically, if these arguments do indeed drive a weak report, then it could be a distorting illusion of sorts compared to signs of underlying health of the job market.
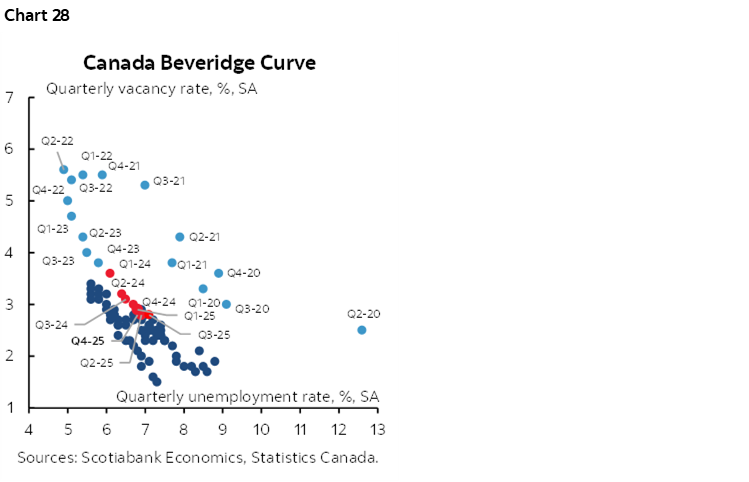
CFIB figures show that mall businesses are biased toward adding jobs. Indeed job postings are still elevated. Chart 28 shows the balance between the job vacancy rate and the unemployment rate—the so-called Beveridge Curve—and indicates a state of balance compared to extreme tightness and extreme looseness of employment conditions.
Hours worked may struggle to rise after the biggest monthly gain in January since the prior January. What could keep growth in hours in the black could be if there are rebounds in lost hours worked due to weather and sickness given a particularly bad flu season and worse winter weather than other years. It’s more likely that tracking for Q1 hours worked could chip away at the 2.3% rate at present which could rein in implications for GDP growth.
As for the unemployment rate, I’m still struggling with how believable it is that the labour force shrank by a single-month record (outside of the immediate effects of the pandemic) of 119, 000 people working or looking for work in January. A rebound is very likely in which case fewer jobs and an increase in people looking for work drives expectations for an up-tick in the unemployment rate.
US INFLATION—HISTORICAL FOOTNOTES
This week’s inflation figures may come and go as historical footnotes in the markets. Forward-looking risks are dominant and backward-looking data may do little to inform policy and market directions.
CPI for February (Wednesday) is expected to be up 0.2% m/m SA for both headline and core ex-food and energy.
PCE for January arrives Friday. It’s even more out of date in relation to forward risks, but total PCE is forecast to be up 0.2% m/m SA with core PCE up 0.3%.
Yet markets have moved past fretting over stale inflation readings. Market measures of inflation expectations often get it horribly wrong—think post-GFC, or varying stages of the pandemic as two examples—but inflation break-evens are signalling expectations for a fairly durable overshoot of the Fed’s 2% inflation goal. This builds upon pre-war evidence of building price pressures in soft data surveys that tend to precede higher inflation rates (chart 29) and rising breadth of inflation pressures (chart 30).
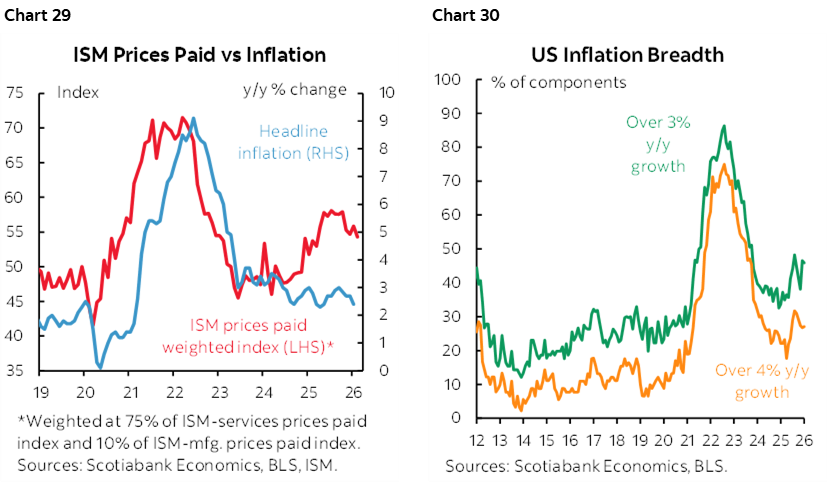
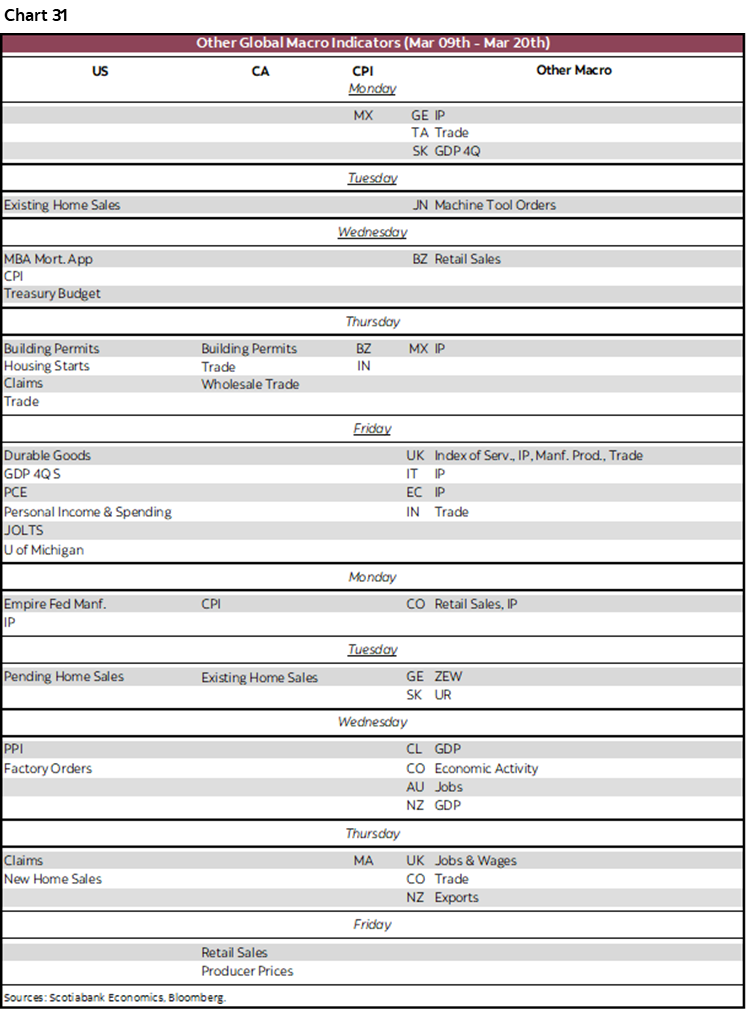
Chart 31 provides a break down of other macro readings by day and country over the next two weeks.

DISCLAIMER
This report has been prepared by Scotiabank Economics as a resource for the clients of Scotiabank. Opinions, estimates and projections contained herein are our own as of the date hereof and are subject to change without notice. The information and opinions contained herein have been compiled or arrived at from sources believed reliable but no representation or warranty, express or implied, is made as to their accuracy or completeness. Neither Scotiabank nor any of its officers, directors, partners, employees or affiliates accepts any liability whatsoever for any direct or consequential loss arising from any use of this report or its contents.
These reports are provided to you for informational purposes only. This report is not, and is not constructed as, an offer to sell or solicitation of any offer to buy any financial instrument, nor shall this report be construed as an opinion as to whether you should enter into any swap or trading strategy involving a swap or any other transaction. The information contained in this report is not intended to be, and does not constitute, a recommendation of a swap or trading strategy involving a swap within the meaning of U.S. Commodity Futures Trading Commission Regulation 23.434 and Appendix A thereto. This material is not intended to be individually tailored to your needs or characteristics and should not be viewed as a “call to action” or suggestion that you enter into a swap or trading strategy involving a swap or any other transaction. Scotiabank may engage in transactions in a manner inconsistent with the views discussed this report and may have positions, or be in the process of acquiring or disposing of positions, referred to in this report.
Scotiabank, its affiliates and any of their respective officers, directors and employees may from time to time take positions in currencies, act as managers, co-managers or underwriters of a public offering or act as principals or agents, deal in, own or act as market makers or advisors, brokers or commercial and/or investment bankers in relation to securities or related derivatives. As a result of these actions, Scotiabank may receive remuneration. All Scotiabank products and services are subject to the terms of applicable agreements and local regulations. Officers, directors and employees of Scotiabank and its affiliates may serve as directors of corporations.
Any securities discussed in this report may not be suitable for all investors. Scotiabank recommends that investors independently evaluate any issuer and security discussed in this report, and consult with any advisors they deem necessary prior to making any investment.
This report and all information, opinions and conclusions contained in it are protected by copyright. This information may not be reproduced without the prior express written consent of Scotiabank.
™ Trademark of The Bank of Nova Scotia. Used under license, where applicable.
Scotiabank, together with “Global Banking and Markets”, is a marketing name for the global corporate and investment banking and capital markets businesses of The Bank of Nova Scotia and certain of its affiliates in the countries where they operate, including; Scotiabank Europe plc; Scotiabank (Ireland) Designated Activity Company; Scotiabank Inverlat S.A., Institución de Banca Múltiple, Grupo Financiero Scotiabank Inverlat, Scotia Inverlat Casa de Bolsa, S.A. de C.V., Grupo Financiero Scotiabank Inverlat, Scotia Inverlat Derivados S.A. de C.V. – all members of the Scotiabank group and authorized users of the Scotiabank mark. The Bank of Nova Scotia is incorporated in Canada with limited liability and is authorised and regulated by the Office of the Superintendent of Financial Institutions Canada. The Bank of Nova Scotia is authorized by the UK Prudential Regulation Authority and is subject to regulation by the UK Financial Conduct Authority and limited regulation by the UK Prudential Regulation Authority. Details about the extent of The Bank of Nova Scotia's regulation by the UK Prudential Regulation Authority are available from us on request. Scotiabank Europe plc is authorized by the UK Prudential Regulation Authority and regulated by the UK Financial Conduct Authority and the UK Prudential Regulation Authority.
Scotiabank Inverlat, S.A., Scotia Inverlat Casa de Bolsa, S.A. de C.V, Grupo Financiero Scotiabank Inverlat, and Scotia Inverlat Derivados, S.A. de C.V., are each authorized and regulated by the Mexican financial authorities.
Not all products and services are offered in all jurisdictions. Services described are available in jurisdictions where permitted by law.