Next Week's Risk Dashboard
- Possible explanations for the ‘puzzle’ of resilient equities
- An Iran deal — truth or dare
- Canadian inflation is set to soar…
- …and how behaviour and policy could reinforce the effects
- How the BoC could respond
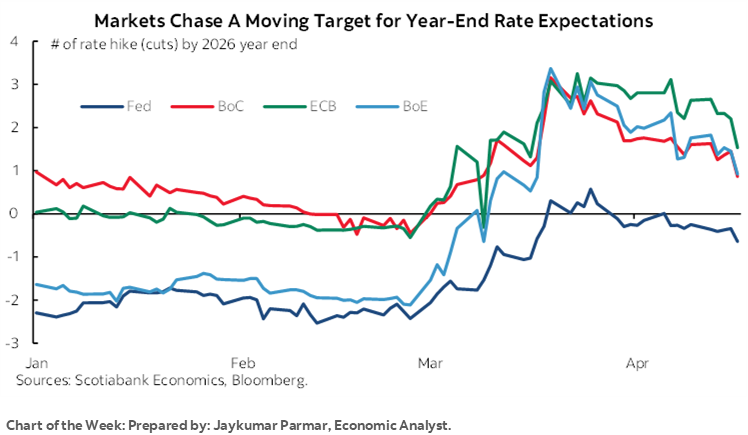
- BoC surveys to be stale on arrival as more timely gauges rise
- Warsh’s Senate hearing will be a raucous affair
- Canadian consumer spending is tracking strongly
- So are US retail sales
- BI to hold
- BSP may hike
- So might Turkey’s central bank
- Russia’s central bank shouldn’t cut, but might
- UK: Jobs, wages, CPI and retail to inform BoE’s next move
- Global PMIs to offer fresh insights into shock effects
- US earnings season continues
Chart of the Week
Why is the stock market so resilient in the face of what could be viewed as innumerable threats? That’s this week’s special topic.
As for the coming week’s developments, they will focus upon the truth or dare game going on in US-Iran negotiations after Trump guided an agreement would be achieved before the Monday market open while Iran’s headlines conflict in the context of what some label as Iran’s “managed irresolution.” Kevin Warsh’s Senate testimony, Canadian inflation and the BoC’s surveys, US earnings reports, a few EM central bank decisions and global macro data will also contribute to make the week an eventful one.
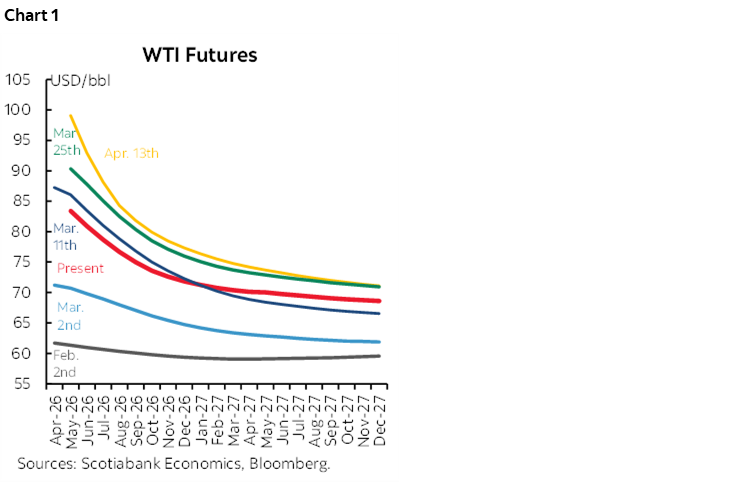
Whatever the case about negotiations with Iran, the oil futures curve has come down mostly in the very near-term with little change further out (chart 1). Position covering likely exaggerated the moves on Friday and I remain highly sceptical toward the path forward.
Kevin Warsh’s hearing before the Senate is now formally scheduled for Tuesday at 10amET, but expect a raucous affair given a letter signed by all the Dems requesting the hearing be delayed while GOP Senator Tillis digs in on opposition until the Trump administration drops its pursuit of Chair Powell. Please see the section on his testimony in last week’s weekly for more as the only thing to have changed is Trump’s renewed threat to fire Chair Powell. He cannot, but this may complicate Warsh’s hearing.
Central banks in Indonesia, the Philippines, Turkey and Russia will weigh in with decisions. Macro indicator risks will focus upon the monthly wave of global purchasing managers’ indices, Canadian inflation, BoC surveys, the UK job market, Canadian and US consumers, and inflation in Japan, the UK and New Zealand.
EXPLAINING THE ‘PUZZLE’ OF RESILIENT EQUITIES
Why is the stock market so resilient? After all, the list of cautions is rather long. War. Trade wars. Uncertainty toward the impact of high commodity prices. AI’s effects. The Fed on hold in restrictive territory while other central banks debate hiking from neutral or easier stances. Political uncertainty. And that's just a partial list.
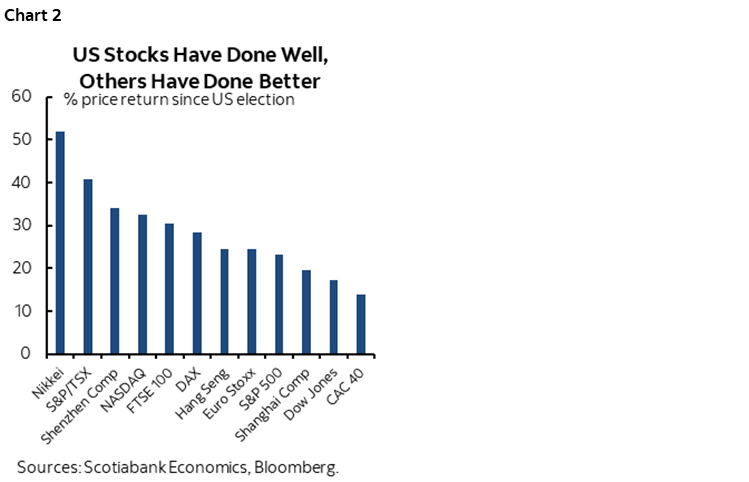
Frequently unheralded are the reasons for stock market resilience. This too is a long list and one toward which there is a stronger case. It starts, however, by acknowledging that even though the US equity market is a significant focal point, it has continued to underperform equities elsewhere since the US election which likely reflects an uncertainty premium (chart 2).
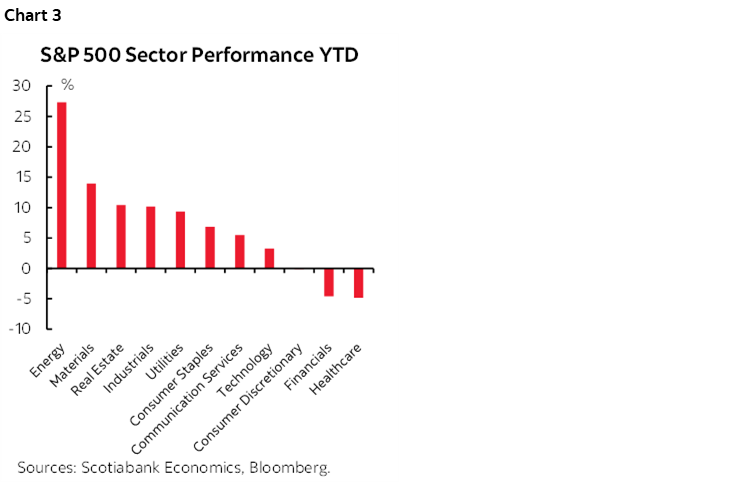
For starters, it’s vital to start with how there are multiple sector themes operating simultaneously and with their own idiosyncratic drivers, rather than crudely aggregating all stocks and trying to find common macro drivers of broad benchmarks. Chart 3 highlights the vast differences in relative sector performance this year.
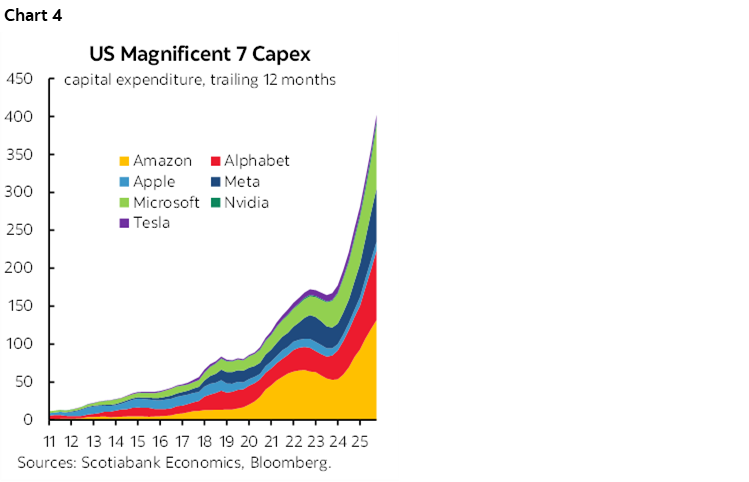
Take tech innovation for one. It marches to the beat of its own drummer, not to the drumbeat of war. We may be in the midst of the greatest wave of tech innovation in history, though that will take time to assess against a high historical bar. Commodities and supply chain disruptions can thwart but not derail investment in AI and related technologies that continues to be strong (chart 4).
Take defence and infrastructure stocks for another. Charts 5–6 point to strong gains across defence- and infrastructure-related stocks. Governments across the world are tripping over themselves to spend money upon these two areas of the global economy. Benefits will accrue to the companies, hopefully to productivity and to national security. Risks include the fact these types of investments are notorious for massive cost overruns and delays plus scepticism against the view that everyone spending much more on defence somehow makes the world safer.
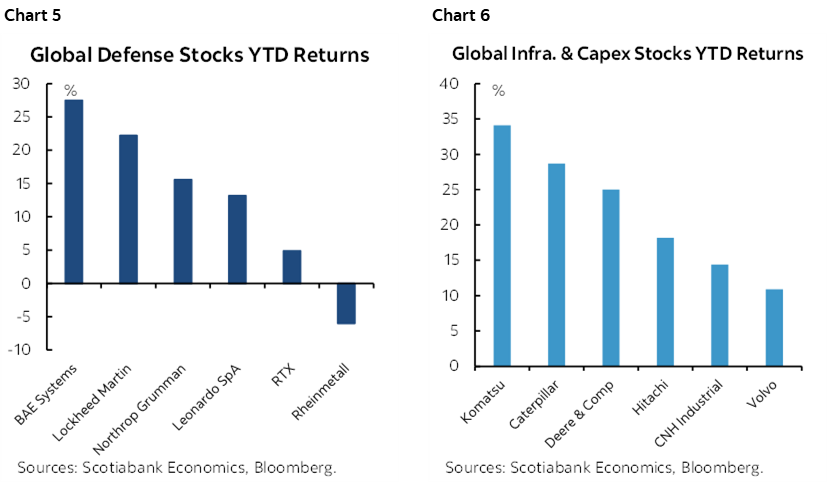
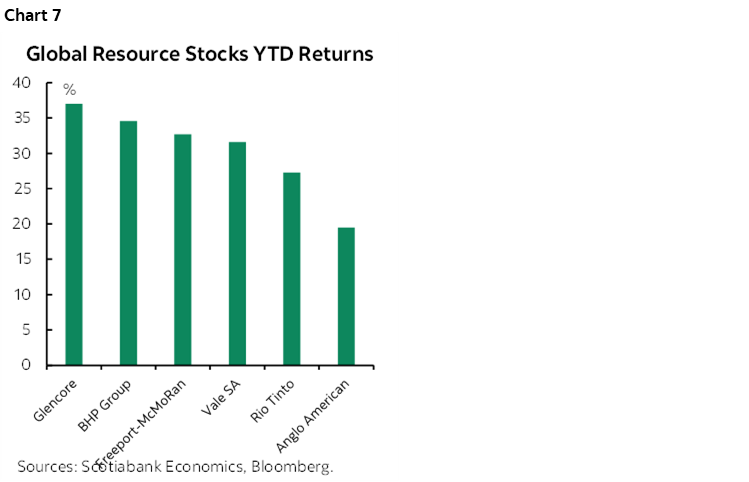
Chart 7 shows resource stocks. High commodity prices support them to a point, as long as demand destruction does not tip the balance toward more of a demand hit than a price lift to earnings. High prices benefit the energy sector’s leading performance.
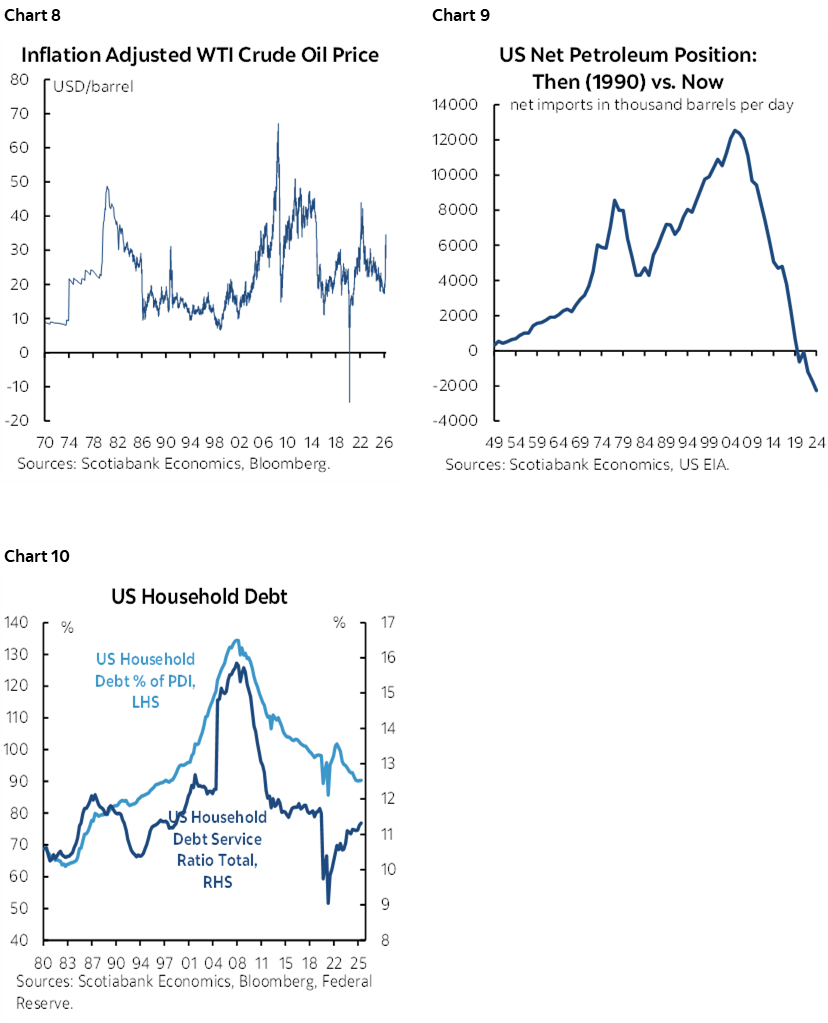
On the latter point, however, real oil prices are not particularly high (chart 8). The US economy’s sensitivity to oil is very different today (chart 9). Consumers are in better overall financial position (chart 10).
There’s no doubt there are weak sectors as well. Healthcare was one of them as flagged in the first chart in this section. Rolling back some of the Affordable Care Act subsidies may have been one driver of this.
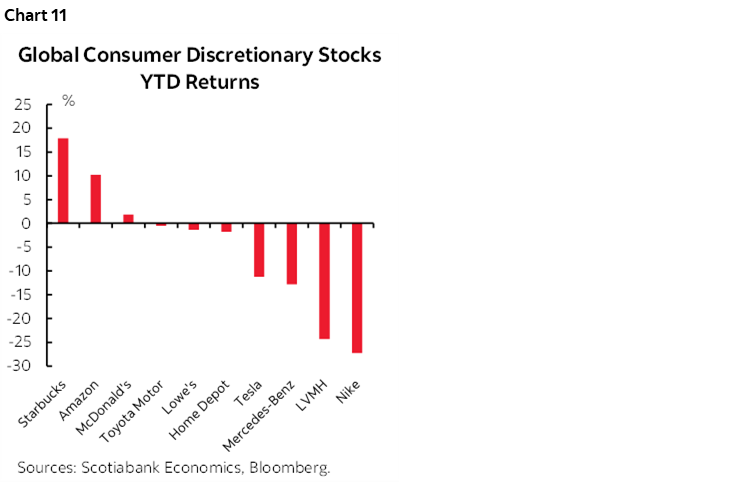
Consumer discretionary stocks have been another area of weakness with a few individual companies flagged in chart 11. There may be further downside risk as the US job market teeters and income growth dries up.
Financials have also underperformed. Deregulation may restore momentum to them and so may resurrection of expectations for modest easing by the Federal Reserve that we expect to return later this year. I wrote about what the US is doing on deregulation in last week's weekly in the US earnings section. Briefly, they include last December’s decision by the OCC to abandon 2013 restrictions on banks’ leveraged lending in favour of prudent risk management, last month’s reduction of capital standards by the Federal Reserve, prior reforms to stress tests, and efforts to open up the US$9 trillion retirement savings market to broader investments. A vibrant debate on opportunity versus risks has divided opinions including among senior Fed officials.
Chart 12 shows that stocks tend to go arm-in-arm with inflation. Stock indices are nominal gauges. Still, the S&P has outperformed inflation over time.
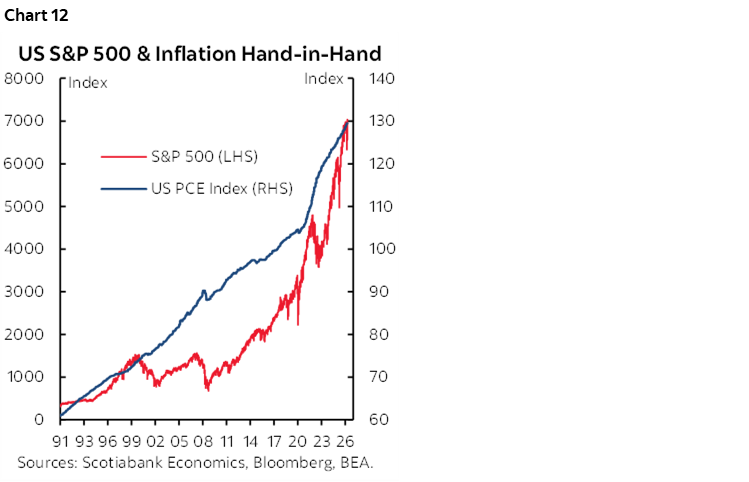
Stocks can outperform during inflationary bouts partly because the real cost of previously originated debt dwindles in unanticipated inflation shocks. So does the real cost of servicing it, with the inflation dividend flowing to equity holders.
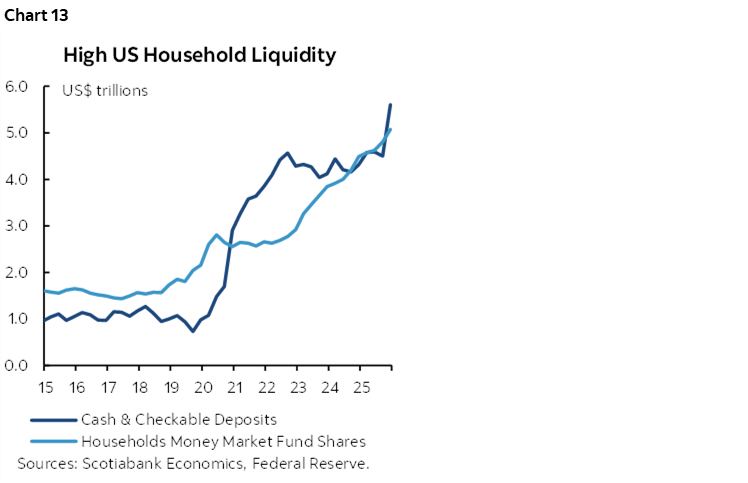
Retail is flush with cash as nervous money presents opportunity for redeployment (chart 13). Households dramatically increased holdings of very liquid cash and near-cash instruments. They socked US$1.1 trillion in extra holdings of cash and chequable deposits between just Q3 and Q4 of last year according to the Federal Reserve’s household balance sheet accounts. This is why you hear so much talk of retail money offering buy-on-dip support as cash holdings lose money due to inflation.
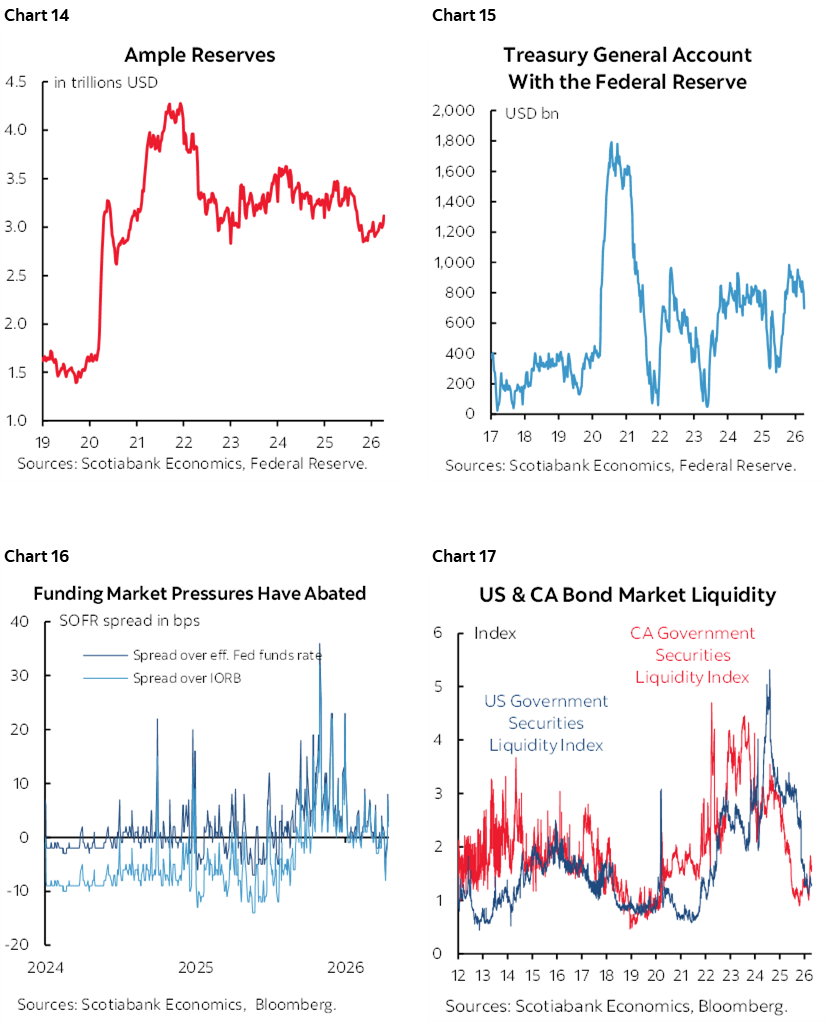
The Federal Reserve's balance sheet is also helping. A higher floor to ample reserves means more liquidity (chart 14). The Treasury General Account has stabilized after being replenished following the drain caused by last year's debt ceiling fracas (chart 15). Higher reserves and an end to Treasury draining liquidity put more money to work chasing leveraged investments within the financial system's plumbing. Funding market pressures have abated (chart 16). US Treasury market liquidity has improved as chart 17 indicates by using a measure that plots deviations from fair value; lower is better. Lower liquidity premia are constructive to base yields, corporate bond spreads and equity discount rates.
There is, of course, the risk that events spiral out of control such as in the Middle East. Uncertainty remains high. Geopolitical risk commonly results in fleeting market disturbances, except for truly big ones like global wars. The point being made in this article is that understanding the stock market is vastly more complex than generalizing about the economy and geopolitical matters.
There are also implications to resilient stocks. Financial conditions are not tightening. Central banks may not ease. High cash and lower leverage in the household sector could make them more willing or able to absorb pass through of higher costs into consumer prices.
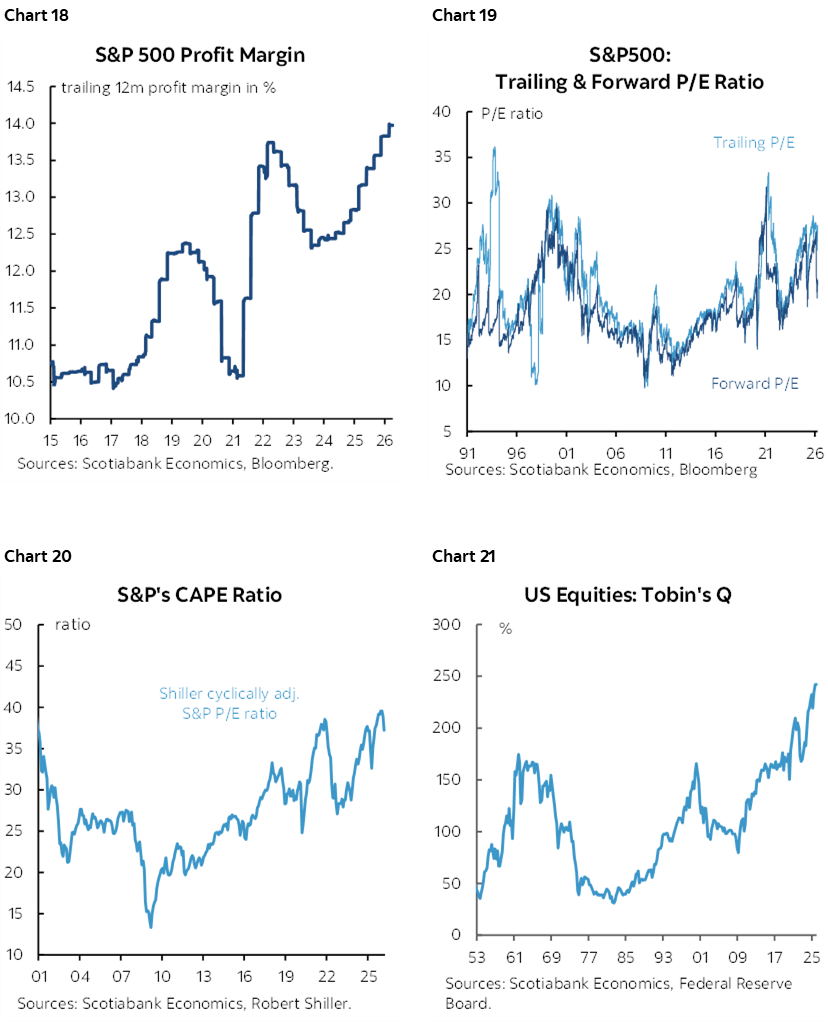
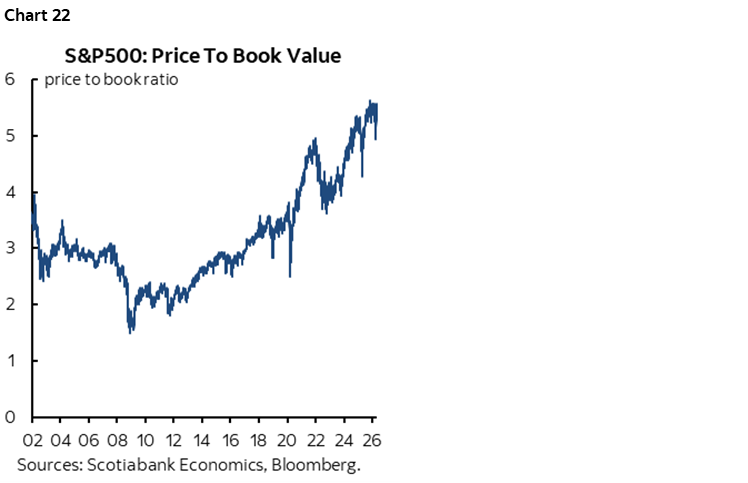
As for other metrics, profit margins remain strong (chart 18), multiples are high but not outrageous (chart 19), and yet other measures like cyclically adjusted P/E ratios are historically high yet may be unable to capture out of sample tech waves (chart 20) and Tobin’s Q—which measures valuations relative to replacement cost of assets—is at an historic high (chart 21). Ditto for simple price-to-book (chart 22). So, cheap? Certainly not. But with the forces in play, it would take high patience, nerves of steel and plenty of liquidity to lean against valuations and the varied forces at play.
CANADIAN INFLATION—SET TO SOAR AND REINFORCED BY BEHAVIOUR AND POLICY
When Statistics Canada updates CPI inflation for the month of March on Monday—yes, Monday, against past practices—it will merely confirm what consumers have already seen. Key, however, will be the path forward for inflation, how consumers behave, and how this behaviour will come to be influenced by policy measures. No policy decisions will hang on this one report.
March CPI to Spike Higher
March CPI is forecast to jump from 1.8% y/y in February to 2.4% on the back of an estimated 0.9% m/m seasonally unadjusted jump in prices as per the polling convention. Gasoline on its own should contribute about 0.6 ppts of the 0.9% rise. In seasonally adjusted terms that would translate to around 0.6% m/m for total CPI using last year’s seasonal adjustment factor that reflects a recency bias to how they are calculated. Some other estimates within consensus are higher.
April Will Extend the Pattern
More of this lies ahead. When April CPI arrives on May 19th it’s likely to show another strong pop higher amid multiple influences. A very preliminary estimate leans toward another jump to 2.9% or maybe even 3% y/y.
This estimate is based upon preliminary tracking of another 0.4% weighted m/m contribution from gasoline prices minus about a tenth deduction for the weighted and prorated impact of the 10-cent elimination of the fuel excise tax on April 20th. That fuel tax effect assumes that refiners and retailers do not raise their prices to crowd in the space left by the tax cut.
There is also the fact that the cut to the consumer portion of the carbon tax a year ago will drop out of the numbers. The carbon tax cut in April 2025 lowered the price level all else equal and hence served to drag down y/y inflation readings but that effect stops this April.
Pass Through to Core Inflation?
What happens thereafter depends partly on the longevity and magnitude of the broad commodities shock including food, energy, metals, potash, uranium etc. On oil, for instance, we use oil futures as a guide not because they accurately predict expected future spot prices but because we find what they are currently signalling to be the most plausible outcome—not hanging out at spot prices indefinitely, but not going back to January levels either and due to higher geopolitical risk premia, damage to commodities infrastructure, and higher shipping and insurance costs.
What happens after April also depends upon pass through and whether the fuel excise tax is indeed allowed to expire in September at the end of the summer driving season. My hunch is that it may well be extended. There are several other matters to consider on pass through.
For one, the BoC’s preferred core measures of inflation exclude the direct effects of changes in indirect taxes like the carbon tax and fuel excise tax and should be unaffected. They do not exclude potential indirect effects. For example, the fuel tax cut frees up some income effects to potentially act as a marginal upward influence upon other prices.
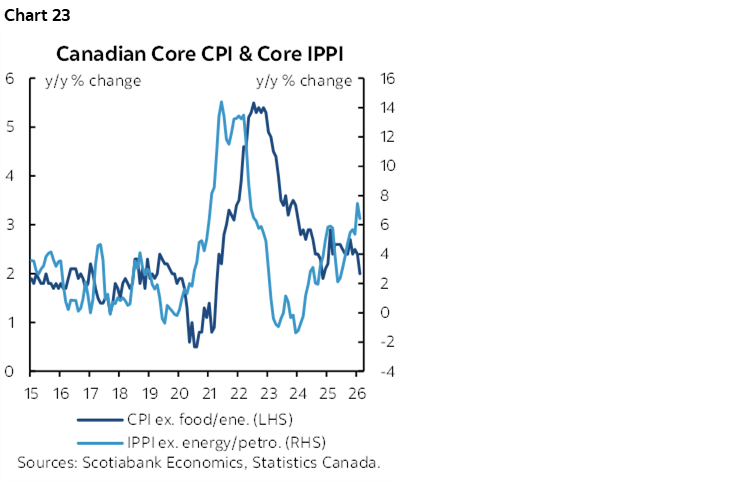
For another, more general pass-through risk into core inflation readings was already evident before the war between the US, Israel and Iran. Chart 23 shows the connection between core industrial prices (ie: ex-energy) and core CPI inflation. Soaring industrial prices tend to pass through to consumer inflation with a lag. This is one reason we were inclined to view the recent soft patch in underlying consumer price inflation as another temporary dip much like early 2024. Hence our view on inflation is not just a war and commodities story. Another update of raw and industrial product prices arrives on Thursday for the month of March.
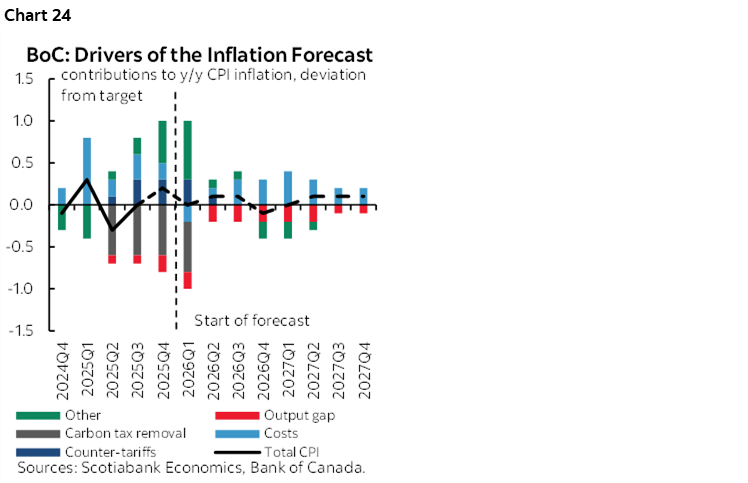
For another, the BoC was already concerned about the impact of cost pressures being passed through to inflation as an offset to limited slack via a mildly negative output gap. Chart 24 is reproduced from their January MPR. I would watch for the BoC to raise the estimated cost drivers of inflation in the April MPR.
This pre-existing momentum in underlying core inflationary pressures now faces likely pass through of the broad-based rise of commodity prices. It’s silly to argue otherwise since we already have evidence that pass through is occurring in company announcements. A small example is pass through of fuel into airfare and curtailment of routes. I’ve also seen several personal anecdotes of fuel surcharges being added by companies. When the BoC’s commodity price index soared in the past it usually meant a meaningful pick-up in core inflation with the granddaddy of such experiences being in 2022.
How Will Behaviour Influence Inflation?
How people change behaviours can have competing effects on inflation.
For one thing, inflation expectations also matter. On that, however, Canada’s measures are poor.
The highest frequency and freshest gauge comes from the CFIB—a small business association and lobby group. Small businesses indicated more aggressive plans to raise prices over the coming year in the April survey (chart 25). This risks a domino effect that feeds upon itself once again. Their plans push to the top end of the BoC’s 1–3% inflation target range and pressure the target. This tends to be correlated with the Bank of Canada’s measure of businesses’ inflation expectations but with a reporting lag.
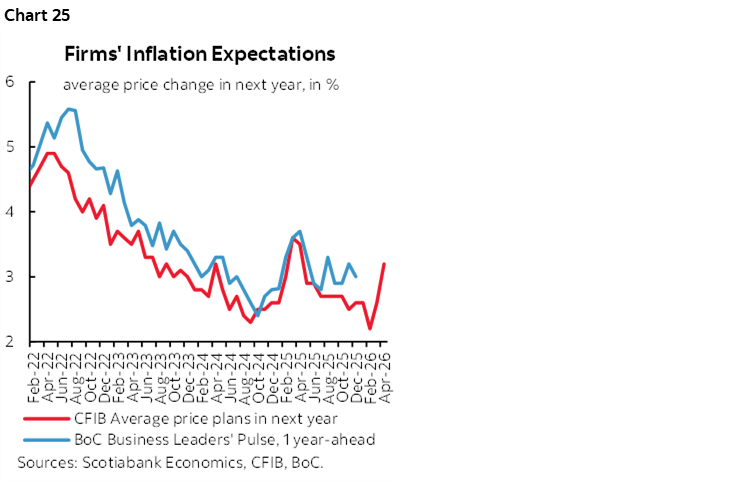
That’s because the BoC surveys are always many weeks behind developments. When the Q1 editions of the BoC’s consumer and Business Outlook surveys arrive on Monday they will be sampling opinions around the month of February while the Business Pulse survey will offer a little fresher evidence over Q1. Further, Canada’s measures of inflation expectations are also poor; real return bonds are the source of breakevens but supply disruptions combined with a tendency of pensions and other long-term investors to buy and sit on them result in limited usefulness of the measures.
An added behavioural matter is how consumers will respond to paying more for a lot of items including necessities like fuel and groceries. Will they spend more upon what they must and less on everything else and therefore potentially retrench in a way that exerts disinflationary pressures in other categories?
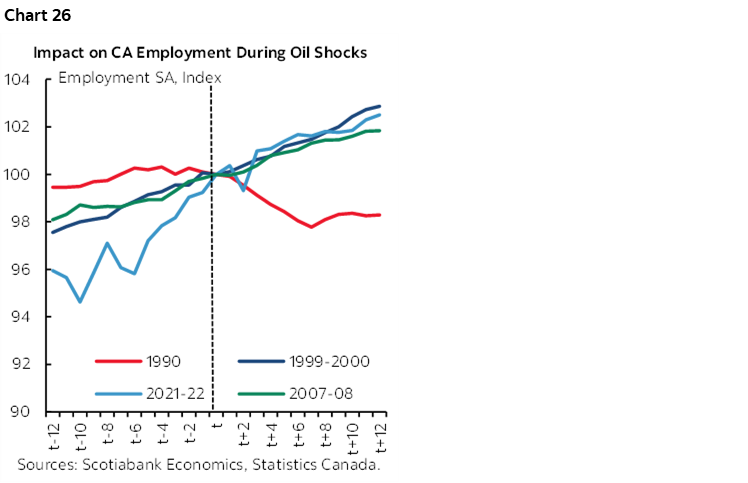
That’s not what happened when oil prices soared in 2022 on the back of the Russia-Ukraine war; consumers kept spending but smoothed through the shock effects by eroding their rate of saving. The personal saving rate collapsed to zero that year as consumers chose to maintain their standard of living and avoid abrupt changes in their consumption patterns by looking through the commodity surge. I would expect consumers to do something similar this year. Furthermore, with the exception of the oil shock in the early 1990s that was correlated with many other things going horribly wrong in Canada, employment growth tends to hold up rather nicely in oil shocks (chart 26).
Policy Responses Will Smooth Behaviour
They may be more inclined to do so this time. That’s because how consumers behave is also influenced by policy. The Carney administration is diving on the grenade of higher basic prices.
The announcement in January about large increases in GST rebates starting in Q2 and no later than June will have lasting effects upon incomes. The one-off GST rebate lump sum payout in Q2 equal to 50% of last year’s GST rebate is expected to accelerate personal disposable income (PDI) growth from a base case run rate of about 2½% q/q annualized to over 6%. Thereafter the GST rebate will be increased by 25% from Q3 through to 2030. By Q3, for example, PDI growth will slow markedly toward 1–2% q/q SAAR before picking up again in Q3. Eliminating the fuel excise tax on gasoline and diesel adds almost another $4 billion per quarter to fuel savings.
Costs, costs, costs
Back to the cost-oriented drivers of inflation risk.
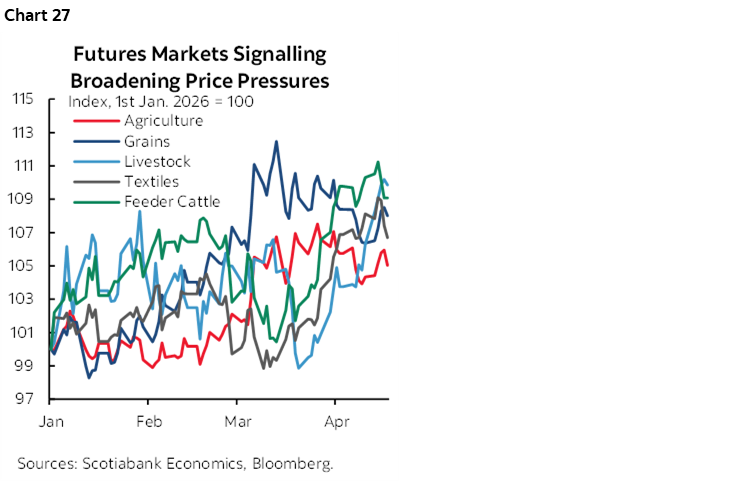
- Broad commodities: It’s not just about potential pass through of energy prices as chart 27 demonstrates. Companies are already announcing pass through effects. I’ve even heard of landscape suppliers passing on fuel charges and landscaping companies in turn passing them on to their retail customers.
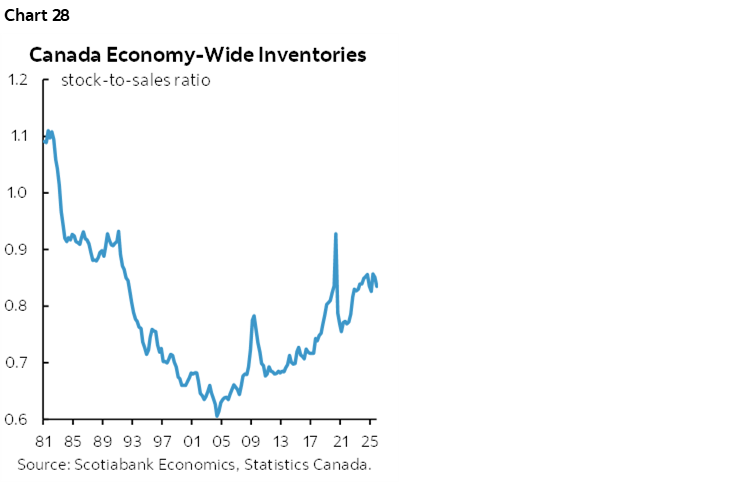
- Inventories: Stockpiling relative to inventories is elevated (chart 28). Some may be undesired. I think much of it is an abandonment of just-in-time management as border frictions soared after Brexit, Trump 1.0, the pandemic, wars, and Trump 2.0. With higher stockpiling go higher storage and financing costs which get passed onto a variety of stakeholders likely including consumers.
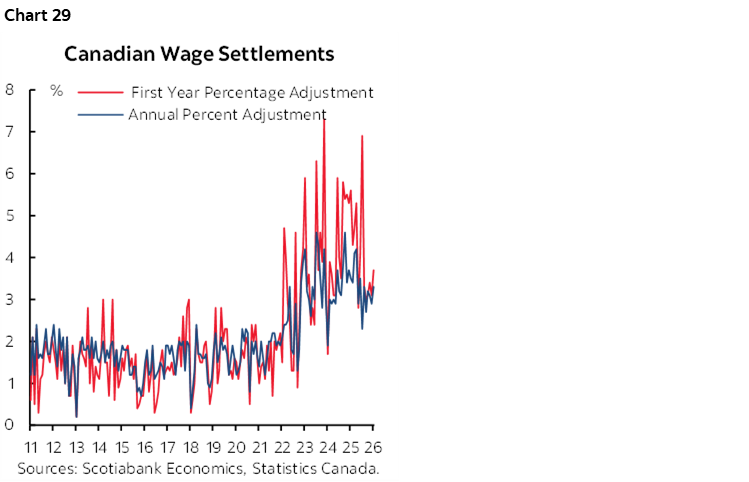
- Wages and productivity: Wage growth is solid either controlling for compositional changes or not and productivity is not. Wage settlements in contract negotiations remain strong within the one-third of the workforce governed by collective bargaining agreements (chart 29). The combined effects mean weaker revenue growth and elevated costs that create a margin squeeze that is passed onto a variety of stakeholders including consumers. This is why we talk of wages and productivity as carrying potential inflation risks when one doesn’t pay for the other.
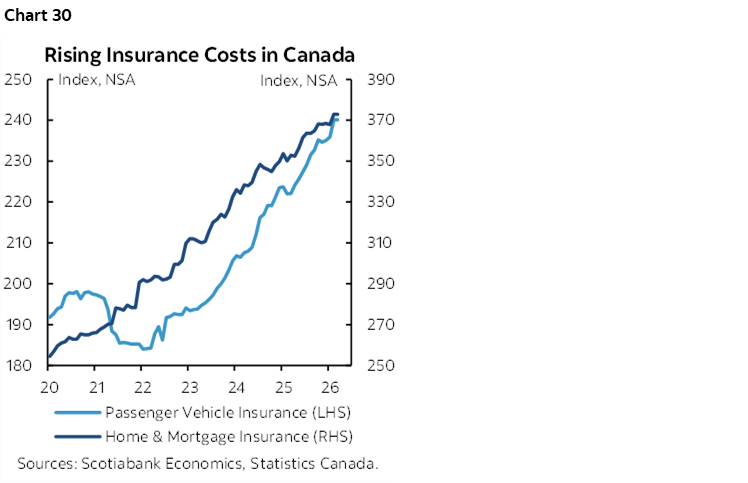
- Insurance: Yes, transiting the Strait of Hormuz is rather dicey business these days, but Canada has its own homegrown insurance challenges (chart 30). Measured within CPI that makes quality adjustments, homeowners’ insurance premiums have risen by 30% since 2022 with vehicle insurance premiums up by a similar amount; neither looks to be about to reverse.
- Supply chain upheaval: As trade policy divides the global economy, companies are sent scurrying to find new suppliers and new customers. This means management time, new workers, and new investments to retool and reorient. All of that involves costs being borne by someone across supply chains—including consumers.
Weighed against these drivers is a modest amount of economic slack. A negative output is estimated to be under -1% of potential GDP. The supply side is now getting dinged while growth is estimated to be improving somewhat in Q1, therefore limiting the amount of slack. The unemployment rate of 6.7% is forecast to decline to 6% as labour supply shrinks along with tighter immigration policy and the quirky methodology behind the Labour Force Survey catches up. This is not enough slack to make a difference through an effort to write off all other forms of inflation risk.
The BoC’s Challenge
When he spoke at the Spring meetings of the IMF and World Bank, Governor Macklem said “We’re all feeling like you don’t want to jump too early and raise interest rates and lower growth, particularly when growth is pretty weak. On the other hand, you don’t want to be late and let inflation get entrenched.” He went on to emphasize the role of medium- and longer-term inflation expectations that, as previously noted, are of very poor quality and lagging in Canada. We will only begin to get BoC measures of this in their quarterly surveys when the July editions arrive.
All of which brings us back to reiterating a few core views on the BoC. Do you repeat the pandemic and look through all of the warning signs on inflation and inflation risk and stay on hold, or do you act more pre-emptively in a risk management sense this time?
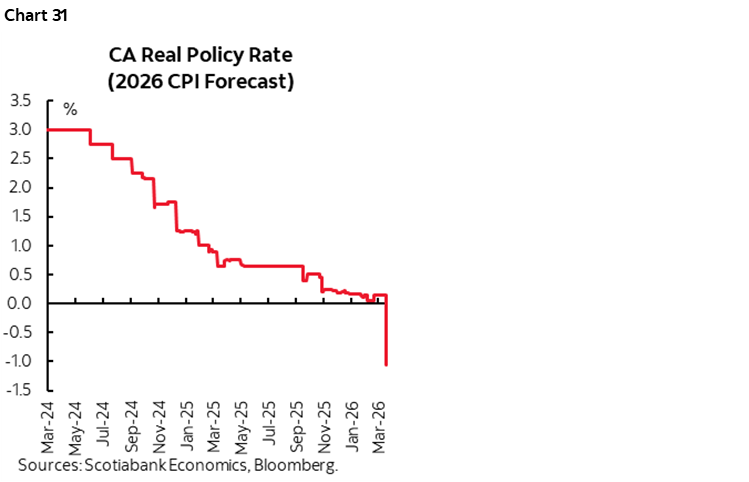
Doing nothing has meant that BoC policy has eased. That’s because the measure that matters most is the real policy rate—adjusted for inflation—and it has plunged (chart 31). The nominal policy rate of 2.25% minus our expected year-end inflation rate of 3¼% could yield a decline in the real policy rate toward -1% compared to what we previously had before raising our inflation outlook by about a full point. The real policy rate is what matters in judging the stance of monetary policy and is how any macroeconomic model would judge the policy stance.
Is it appropriate to ease in a commodity producing economy? With inflation risk elevated? With cost of living pressures facing a fiscal response that is likely to see added fiscal stimulus in future? If you’re sure that pre-war and war-related inflation risk all goes away in short order without resulting in altered behaviour measured through inflation expectations, company pricing behaviour, and wage setting exercises then perhaps.
But that’s a high stakes gamble at a central bank that made the wrong bet in disastrous fashion the last time. It waited until it had all the evidence of a severe inflation problem before hiking and we went from 0.25% to 5%. Had it dispassionately focused upon inflation like the Bank of Korea that hiked in 2021 without focusing upon pushing the boundaries of maximum employment while looking through inflation then the policy rate in Canada might have levelled off much lower than 5%. Not as many mortgage borrowers would have been reeled in and then subject to massive resets.
Enter risk management. There is little to no harm to sneaking in a slight hiking bias to manage things in a risk management sense. Hike 25bps with a circumspect neutral bias that’s data dependent and see what happens. If it’s wrong, reverse with little to no damage. If it’s the right course of action, keep going in which case the catch-up pain could be much less later on.
In short, the BoC should not count as highly upon putting all of its eggs in one basket on one single wishful way of thinking about future inflation risk. A risk management approach that balances the risks in gradualist fashion may be more appropriate this time.
And yes, there would be some damage to the demand side if significant tightening unfolded, yet at present we only have 75bps worth of hikes. That would merely neutralize the easing of the real policy rate by contrast to the hysteria over hiking by any amount at any time. Should more tightening than we forecast be required then the entire point of the exercise would be to constrain demand in the face of what would be upgraded risk to the supply side. There is no such thing as immaculate disinflation. Therefore, arguing that you can’t hike because you might break a few teacups is as insensible now as it was then.
There will always be risks—key is to balance them. Trade policy, for instance, is a risk to both supply and demand as Governor Macklem has gone to great lengths to emphasize in speech after speech on trade policy. We remain cautiously optimistic toward trade negotiations around USMCA/CUSMA renewal. An agreement is well within reach. Trump’s falling poll numbers and rising likelihood that the GOP loses at least one chamber on November 7th would mean negotiating with the Democrats in a new Congress in January—on Democrats terms, not GOP terms. Getting an agreement in place before then may matter more to the US than Canada.
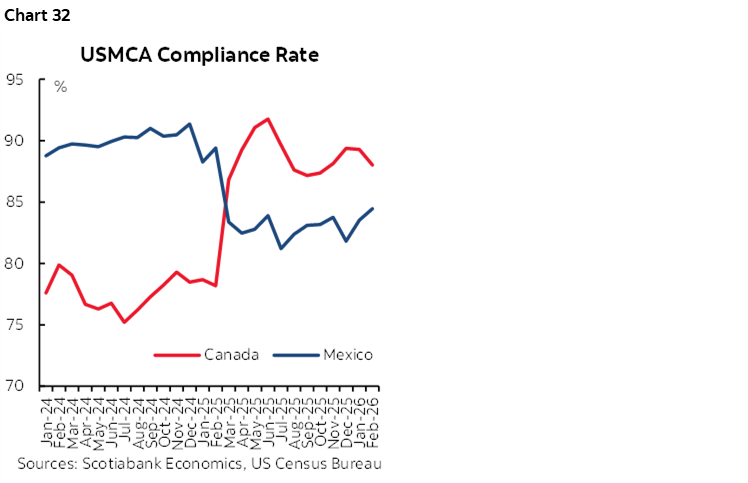
In the meantime, as long as the CUSMA carve-out is maintained, then the high compliance factor with almost 90% of exports exempt from tariffs (chart 32) coupled with CAD depreciation from 1.20 USDCAD a few years ago to 1.38 now has meant an improvement in the price competitiveness of the vast majority of Canada’s exports to the US. The trade shock risks being as overstated as a macro risk as the mortgage reset narrative.
CENTRAL BANKS—HAWKS AND DOVES
Four regional central banks will weigh in with updated decisions this week.
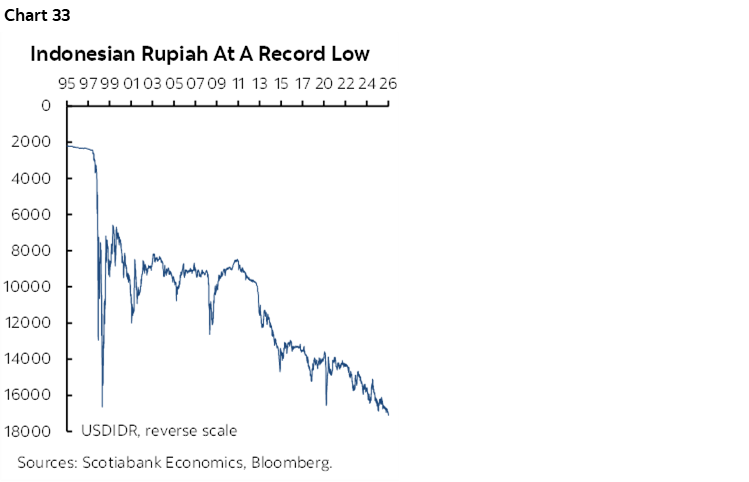
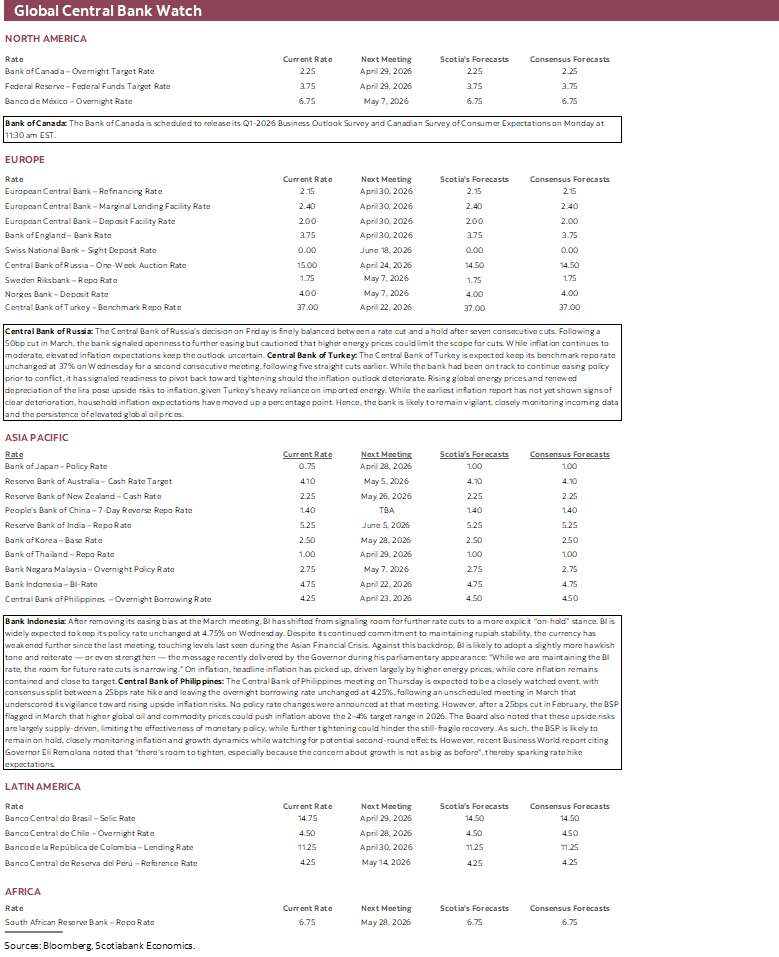
Bank Indonesia (Wednesday) is expected to leave its policy rate unchanged at 4.75%. Ensuring rupiah stability in the face of an import price crunch is likely to motivate somewhat of a hawkish bias (chart 33). Always be very, very careful with this central bank given its strong appetite for springing surprises.
Turkey’s central bank is expected to leave its one-week repo rate unchanged at 37% with some forecasting a 300bps increase (Wednesday). Higher energy prices have posed renewed concern alongside the falling lira.
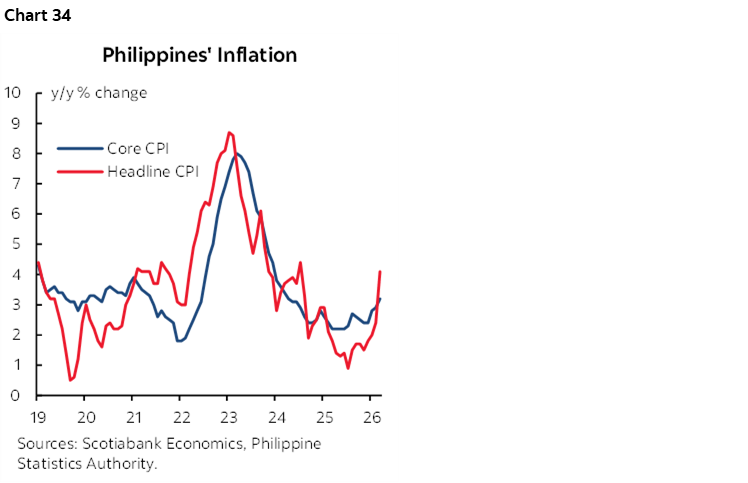
The Philippines’ central bank (Thursday) is expected to hike by 25bps on Thursday. This one’s a little bizarre. They held an emergency meeting in March in order to….do nothing. Well, nothing by way of concrete action, but the Board warned about upside risks to inflation that are already in motion (chart 34).
The Russian central bank closes out the week with an expected 50bps cut to 14.5% on Friday. The central bank’s dovish bias in March faces risk of a hawkish surprise in the face of higher oil prices and inflation risk.
GLOBAL MACRO
The global line-up of calendar-based macro risks will also include important readings from across multiple regions. I’ve tag teamed on this section with my colleague Jay Parmar.
Global PMIs
The preliminary PMI releases across major economies will offer an early read on economic conditions in April, capturing for the second consecutive month the potential fallout from heightened tensions in the Middle East.
Australia Japan release on Wednesday night (ET as always) followed by India, the UK, Eurozone and then the US into Thursday morning.
March’s PMI data pointed to a sharp global slowdown, alongside a renewed intensification of price pressures—broadly in line with market expectations.
April’s data will therefore be important in shaping views on near‑term momentum, helping to clarify whether the slowdown is deepening or whether activity is stabilising at weaker levels for now. As with previous releases, the key areas to watch will be the various price‑pressure components, as well as qualitative commentary from firms and purchasing managers, which should shed light on supply‑chain disruptions, cost pass‑through dynamics, and overall business sentiment.
Tracking a Canadian Consumer Rebound
Canadian retail sales for the month of February and the preliminary estimate for March will be released on Friday. Statcan had previously guided that February’s nominal sales were tracking a gain of almost 1% m/m SA. That may be revised, which isn’t uncommon, and required details like volumes versus prices and sector breakdowns will be offered. March is a bit of a wildcard and only the headline preliminary estimate will be offered.
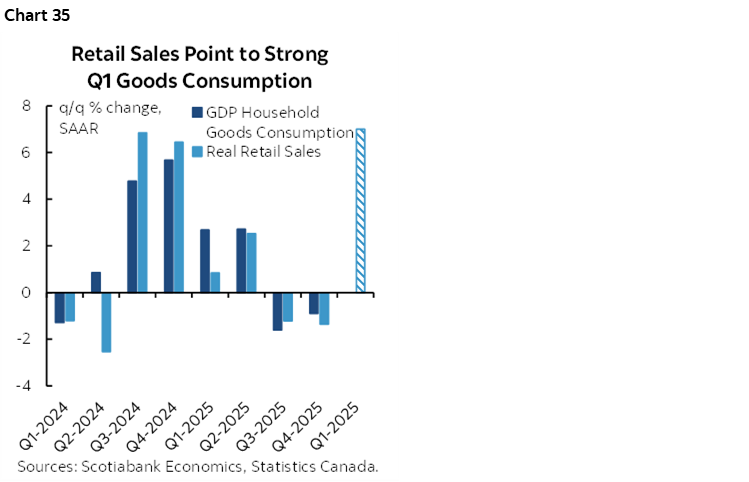
Q1 is tracking the fastest growth in retail sales volumes since 2024H2 (chart 35). That’s based on the Q4 average, the surge in January and our estimate of the volume portion of the preliminary guidance for February’s sales while holding March unchanged to focus the math on what is known. We’ll learn more this week, but this measure correlates very strongly with goods spending by consumers within the GDP accounts that is also shown in the chart.
Yet it also fits into a picture in which Q1 GDP may be tracking as high as about 2% q/q SAAR. That’s based upon monthly GDP up to January, an estimate for February based on Statcan’s preliminary guidance and our tracking, and little assumed growth in March. The estimate uses monthly GDP on a production basis versus the convention—such as the BoC’s forecasts—to use expenditure-based GDP. The latter would also consider a potential rebound from the massive drag on Q4 GDP from inventory depletion that knocked a weighted 4+ percentage points off of Q4/Q3 GDP growth.
US Consumers Probably Came on Strong in March
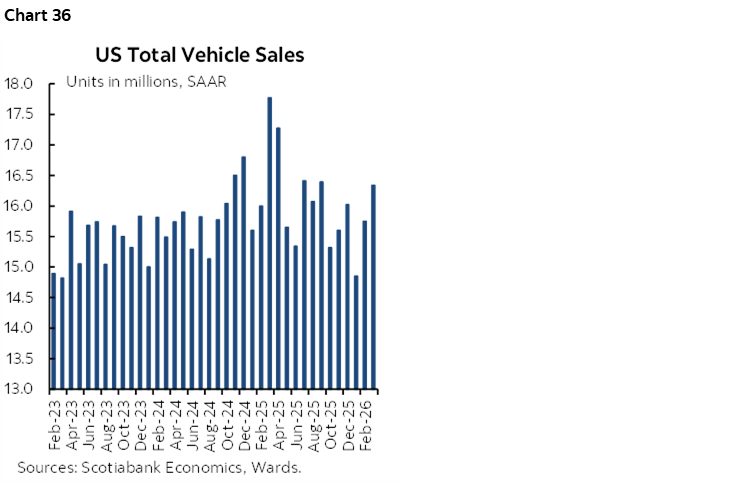
Tuesday’s update on retail sales during March is expected to post a strong gain of over 1% m/m in nominal terms and my estimate is 2%. Higher auto sales (chart 36) and gasoline prices plus a more moderate gain in sales excluding those categories are the drivers.
A wave of earnings reports pivots toward greater breadth compared to the first week’s focus upon financials. Pending home sales and jobless claims offer otherwise light risk.
UK's Inflation and Jobs
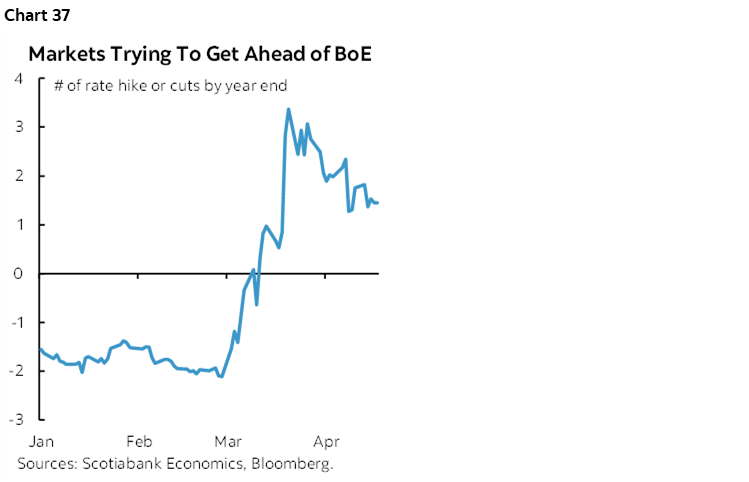
Bank of England (BoE) watchers will be closely monitoring the upcoming labour market, wage, and inflation data releases scheduled for Tuesday and Wednesday, respectively.
These updates will matter again—particularly for markets attempting to front‑run the central bank on the number of rate hikes expected this year (chart 37). Before turning to the data, however, a key point to note is the ongoing deterioration in the quality of UK labour market statistics. The ONS continues to face challenges with response rates and sample representativeness, and plans to repair the data and complete the transition to the Transformed Labour Force Survey (LFS) have been further delayed, now pushed back to 2027.
After starting the year with consecutive but modest job gains in UK payroll employment, consensus expectations point to low single‑digit growth in March, with the unemployment rate seen holding steady at 5.2%. While it is still early, the Bank of England will be keen to assess whether any signs of damage are emerging in the labour market, particularly given the data quality caveats.
The key focus, however, will be wages. Earnings growth was flat in February, yet at the March meeting the BoE revised up its projection for private‑sector wage settlements in 2026 from 3.4% to 3.6%, while explicitly warning about the risk of second‑round wage effects. This places added importance on the upcoming wage data despite measurement uncertainty.
On inflation, headline CPI is expected to jump sharply (+0.6% m/m), largely reflecting higher energy prices. That said, the Bank of England’s focus will be firmly on core CPI and services CPI, where pass‑through effects from energy costs are more likely to become entrenched. Consensus expectations are for both measures to remain elevated, broadly in line with February levels.
Overall, the Bank of England is likely to hold policy unchanged in April, in line with the Governor’s recent guidance emphasizing caution and a reluctance to form strong judgments amid significant uncertainty around pass‑through effects to the broader economy. As such, policymakers will treat these releases as an initial snapshot rather than a decisive signal, using the data to begin assessing the extent of any economic damage already incurred and to evaluate whether second‑round effects—particularly through wages and services inflation—are starting to gain traction.
The UK week wraps up with Friday’s retail sales volumes during March. Total sales are projected to be flat to lower over February as higher prices crimp spending.
Light in LatAm
The line-up for this week will be very light. Colombia and Mexico refresh monthly GDP proxies for way back in February on Monday and Friday respectively. Mexico also updates retail sales during February (Thursday), bi-weekly CPI (Thursday) and the unemployment rate in March (Friday).
Asia-Pacific Inflation
Kiwi inflation probably accelerated in Q1 with the oil surge that was back-end loaded to the end of the quarter. CPI on Monday evening (ET) is expected to jump by 0.8% q/q SA nonannualized but key will be the breakdown of tradeable and non tradeable components.
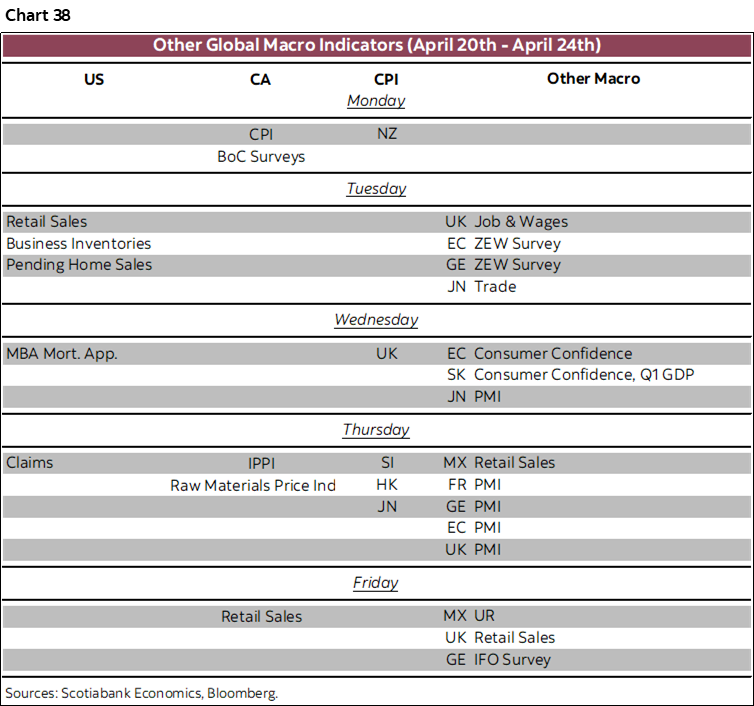
Japanese CPI (Tuesday) is likely to just follow the previously released Tokyo gauge higher toward 1.4% y/y on Thursday.
Chart 38 provides the customary line-up by day.

DISCLAIMER
This report has been prepared by Scotiabank Economics as a resource for the clients of Scotiabank. Opinions, estimates and projections contained herein are our own as of the date hereof and are subject to change without notice. The information and opinions contained herein have been compiled or arrived at from sources believed reliable but no representation or warranty, express or implied, is made as to their accuracy or completeness. Neither Scotiabank nor any of its officers, directors, partners, employees or affiliates accepts any liability whatsoever for any direct or consequential loss arising from any use of this report or its contents.
These reports are provided to you for informational purposes only. This report is not, and is not constructed as, an offer to sell or solicitation of any offer to buy any financial instrument, nor shall this report be construed as an opinion as to whether you should enter into any swap or trading strategy involving a swap or any other transaction. The information contained in this report is not intended to be, and does not constitute, a recommendation of a swap or trading strategy involving a swap within the meaning of U.S. Commodity Futures Trading Commission Regulation 23.434 and Appendix A thereto. This material is not intended to be individually tailored to your needs or characteristics and should not be viewed as a “call to action” or suggestion that you enter into a swap or trading strategy involving a swap or any other transaction. Scotiabank may engage in transactions in a manner inconsistent with the views discussed this report and may have positions, or be in the process of acquiring or disposing of positions, referred to in this report.
Scotiabank, its affiliates and any of their respective officers, directors and employees may from time to time take positions in currencies, act as managers, co-managers or underwriters of a public offering or act as principals or agents, deal in, own or act as market makers or advisors, brokers or commercial and/or investment bankers in relation to securities or related derivatives. As a result of these actions, Scotiabank may receive remuneration. All Scotiabank products and services are subject to the terms of applicable agreements and local regulations. Officers, directors and employees of Scotiabank and its affiliates may serve as directors of corporations.
Any securities discussed in this report may not be suitable for all investors. Scotiabank recommends that investors independently evaluate any issuer and security discussed in this report, and consult with any advisors they deem necessary prior to making any investment.
This report and all information, opinions and conclusions contained in it are protected by copyright. This information may not be reproduced without the prior express written consent of Scotiabank.
™ Trademark of The Bank of Nova Scotia. Used under license, where applicable.
Scotiabank, together with “Global Banking and Markets”, is a marketing name for the global corporate and investment banking and capital markets businesses of The Bank of Nova Scotia and certain of its affiliates in the countries where they operate, including; Scotiabank Europe plc; Scotiabank (Ireland) Designated Activity Company; Scotiabank Inverlat S.A., Institución de Banca Múltiple, Grupo Financiero Scotiabank Inverlat, Scotia Inverlat Casa de Bolsa, S.A. de C.V., Grupo Financiero Scotiabank Inverlat, Scotia Inverlat Derivados S.A. de C.V. – all members of the Scotiabank group and authorized users of the Scotiabank mark. The Bank of Nova Scotia is incorporated in Canada with limited liability and is authorised and regulated by the Office of the Superintendent of Financial Institutions Canada. The Bank of Nova Scotia is authorized by the UK Prudential Regulation Authority and is subject to regulation by the UK Financial Conduct Authority and limited regulation by the UK Prudential Regulation Authority. Details about the extent of The Bank of Nova Scotia's regulation by the UK Prudential Regulation Authority are available from us on request. Scotiabank Europe plc is authorized by the UK Prudential Regulation Authority and regulated by the UK Financial Conduct Authority and the UK Prudential Regulation Authority.
Scotiabank Inverlat, S.A., Scotia Inverlat Casa de Bolsa, S.A. de C.V, Grupo Financiero Scotiabank Inverlat, and Scotia Inverlat Derivados, S.A. de C.V., are each authorized and regulated by the Mexican financial authorities.
Not all products and services are offered in all jurisdictions. Services described are available in jurisdictions where permitted by law.