Next Week's Risk Dashboard
- Why markets should be on high alert toward escalation with Iran
- Nonfarm payrolls preview
- Canada’s economy — soft growth, soft supply side
- Powell is unlikely to follow in Lagarde’s footsteps
- BanRep expected to deliver another mega hike
- Global Macro —March inflation, China PMIs, US retail sales
Chart of the Week
Key developments over the coming week will include monitoring the risk of escalating tensions in the Middle East, Friday’s nonfarm payrolls into holidays across most global markets that will extend reactions into the following week, updates on Canada’s economy, an expected central bank mega hike, Chair Powell’s remarks, and a number of top shelf global macro readings.
MARKETS ON HIGH ALERT
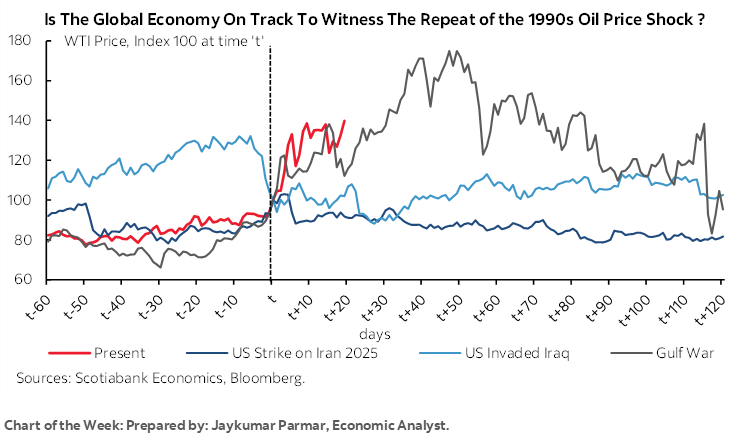
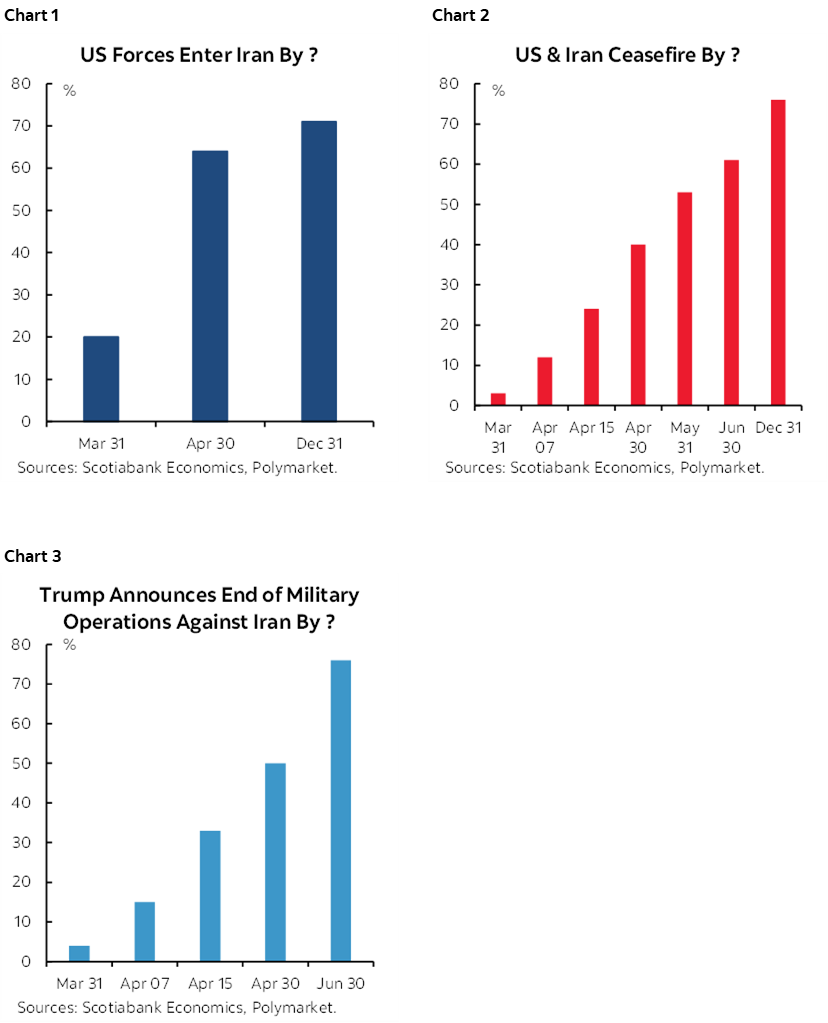
The prime market risk over the coming week is likely to be focused upon the risk of escalation in the Middle East. Markets would be wise to view President Trump’s 10-day suspension of attacks on Iranian energy assets sceptically as the betting crowd digs in on the duration of the conflict while key figures like the ECB’s Lagarde warn of much longer-lived challenges (charts 1–3).
For one, the President’s claim that “we’ve won this war” is curiously juxtaposed against ongoing troop build ups including a late week report that the Pentagon is looking at adding another 10,000 troops into the region. That would raise the total number of troops in the region to about 60–65k which is still only about 10% of the troop surge during Operation Desert Storm (here).
Second, never take Trump’s deadlines seriously. This piece reminds us that two-week extensions are a favourite tactic of Trump’s across many issues but that he usually violates his own deadlines and in both directions.
Third, one such example was last summer. Trump said this on Thursday June 19th 2025:
“Based on the fact that there’s a substantial chance of negotiations that may or may not take place with Iran in the near future, I will make my decision whether or not to go within the next two weeks.”
And then Operation Midnight Hammer bombed Iran two days later over June 21st –22nd.
Another example was that negotiations were continuing in late February this year and Iran’s foreign minister sounded optimistic toward agreement right up until Trump issued the order on the afternoon of Friday February 27th to attack. Operation Epic Fury began strikes at 1:15amET on Saturday February 28th.
Is the exact same tactic being employed once more? If so, then be on guard for nearer term actions and possibly into this weekend or early next week.
Finally, all signs indicate that Mr. Trump is fabricating claims that Iran is interested in negotiating which I’ll come back to next. If Iran’s regime learns from Trump’s deadlines, then they won’t be letting their guard down on this one.
Iran’s Negotiating Positions
Iran’s counter-demands to the US set their conditions for a ceasefire and are nonstarters while the war looks set to be extended for much longer. Here are its demands.
1. A complete cessation of the adversary’s “aggression and assassination” operations.
2. Establishment of concrete mechanisms to ensure the war is never again imposed upon Iran.
3. Guarantees and clearly defined procedures for payment of compensation and reconstruction costs resulting from the war.
4. Cessation of hostilities across all fronts and across all resistance groups involved throughout the region.
5. International recognition and guarantee of Iran’s sovereign right to exercise jurisdiction over the Strait of Hormuz.
As conditions for a ceasefire, they say “No negotiations will take place before this,” and reiterated that Iran’s “defensive actions” will continue until all the above conditions are fulfilled.
Fat. Chance. So much so that Iran is effectively daring the US to escalate. Imagine a US taxpayer funded version of a Marshall Plan to rebuild Iran that flows straight into the pockets of what’s left of the regime and the Revolutionary Guard. A guarantee not to attack in future would be worthless anyway; ask Ukraine about long-term guarantees with 1994 in mind. Stopping “hostilities across all fronts” and “all resistance groups” presumably includes Iran’s proxy groups like Hezbollah which is going nowhere. And having over control of the Strait of Hormuz is never going to happen. The ability of the US to control Israel is limited.
The US administration may have seriously underestimated what it was getting into with Iran and so it’s unclear how to extricate itself without being perceived to have largely failed to achieve the prime objectives of regime replacement, removing enriched uranium stockpiles and effectively eradicating the nuclear program and its staff.
Iran is not a democracy. Iran does not face any election timeline like the US does. Iran is not an openly capitalist economy. Iran is used to hardship. Iran has fought many vicious wars and experienced enormous suffering. Iran’s geography makes escalating a conflict a high-risk venture. Iran has friends in low places with similar characteristics. Iran’s vicious tentacles reach across the world. Iran’s regime hates the west and everything it stands for. It’s naïve to assume that hordes of Iranians will rise up against the regime versus embracing nationalism against a bigger perceived enemy that is attacking them; the enemy of my enemy is my friend.
NONFARM—A TRULY GOOD FRIDAY?
Nonfarm payrolls are slated for another update on Good Friday. The first thing is to ask what are you thinking putting the world’s #1 macroeconomic indicator on a day when most global markets will be shut and US equity markets will be shut? The government is often shut when it shouldn’t be and sometimes open when others are not. Go figure.
I’ve estimated a gain of 80,000 nonfarm payroll positions for the month of March. The unemployment rate is estimated to decline a tick to 4.3%. If those estimates are anywhere close to the mark then they could be viewed as constructive to growth from an equity standpoint, but reinforcing market pricing for the Federal Reserve to be on a protracted hold. Downside risk to payrolls may become more acute after this week’s estimates.
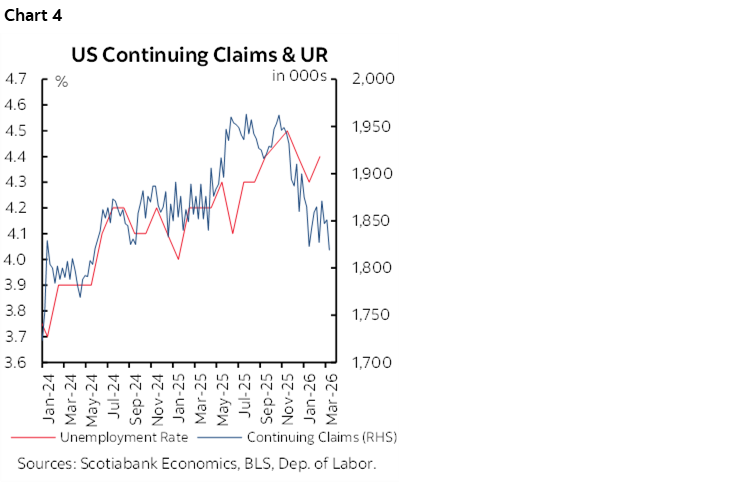
The unemployment rate comes from the companion household survey that has been wickedly volatile. I’m expecting a job rebound in that survey to outpace the labour force change, but the other driver is that continuing claims have been trending lower. Continuing claims serve as a measure of the duration of job loss and are highly correlated with the unemployment rate for intuitive reasons (chart 4).
As for the nonfarm call, here are the main ingredients:
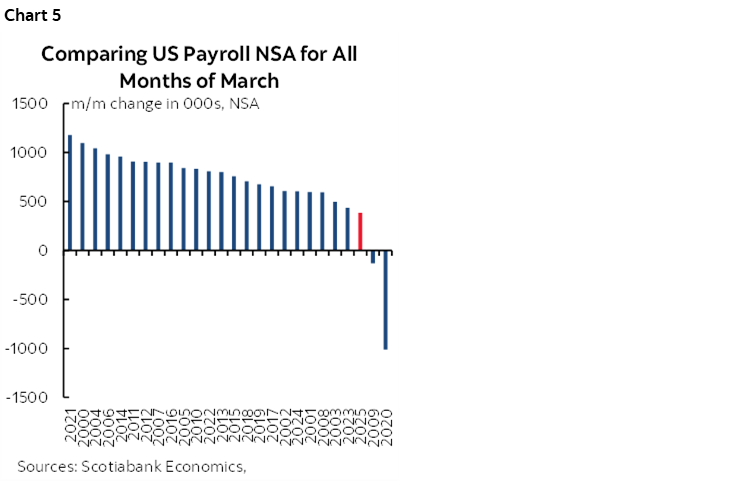
- March is normally a fairly strong seasonal up-month for hiring (chart 5) with arguments below supportive of going with about +400k m/m NSA. Applying a low SA factor in keeping with the prior March and the recency bias to how they are calculated could translate into about a 60k SA gain for starters.
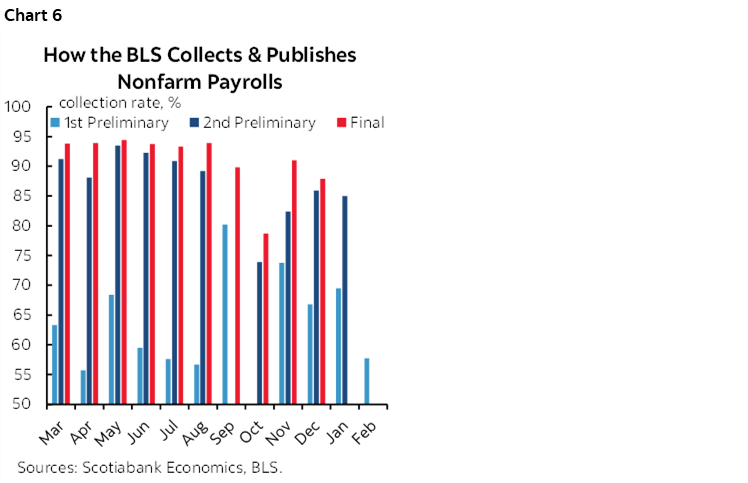
- Revisions to February nonfarm payrolls could be quite negative. Nonfarm is stuck in a pattern of serial overestimation which could be particularly acute this time since the sampling rate was among the worst on record (chart 6).
- The funding issues surrounding the Department of Homeland Security could knock tens of thousands off nonfarm payrolls in March. Out of 260,000 DHS employees, estimates suggest that 90% worked but without pay. That means around 25–30k gets lopped off payrolls and there could be negative spillover effects upon other types of jobs like discouraging air travel.
- Weather: I know, I know, economists and weather, the comedians among you may joke. This one’s a wild card but it could be a mild positive this time. Weather added about 50,000 to February nonfarm payrolls according to the San Francisco Fed’s estimate which could make it harder to post a positive weather effect in March over February’s reference period. Still, temperatures were unusually warm across much of the US in March and could aid weather sensitive sectors like construction and leisure industries although large snowstorms hit the Midwest and eastern seaboard in the reference period.
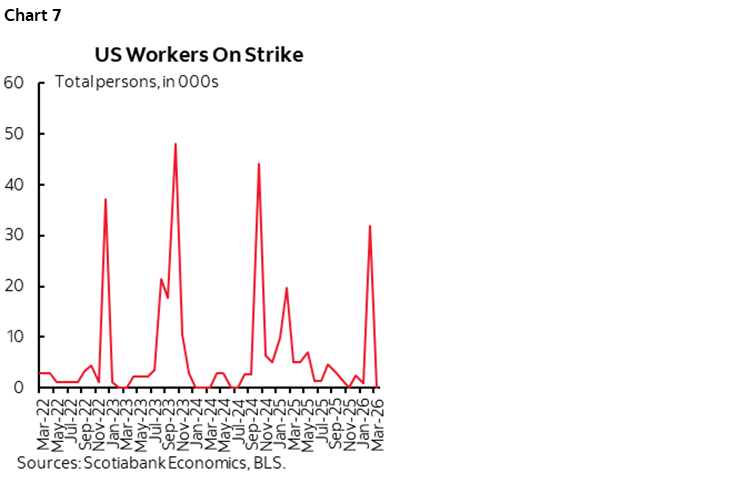
- Health hiring could get a boost from the end of the nurses’ strike in New York. That could add back about 30k as strike counts fell back to zero in March (chart 7).
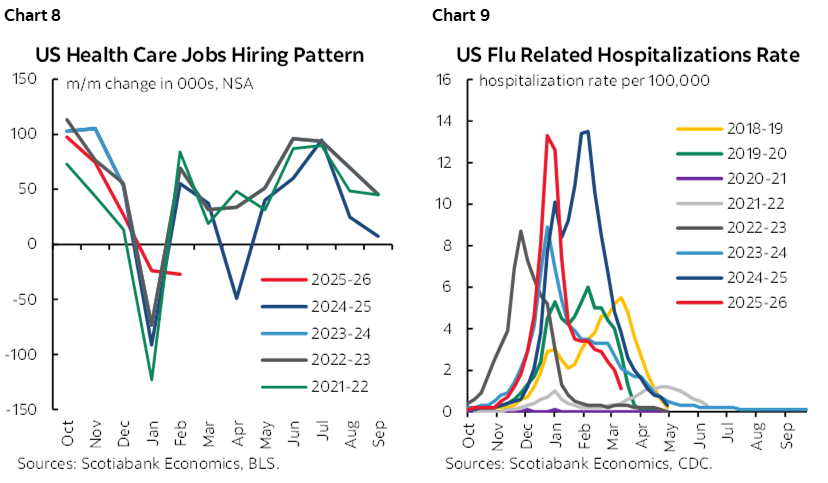
- Health hiring is usually positive in March (chart 8), although we’ve tamped this down somewhat because the flu season has utterly collapsed in upon itself. It started late such that early hiring in September–October was too much, then soared in January so hiring caught up, then cases collapsed in February and March by more than seasonally normal which could mean fewer on-call health workers were brought in (chart 9).
- A wildcard uncertainty is when the curtailed ACA subsidies at the end of 2025 may begin to crimp health sector hiring.
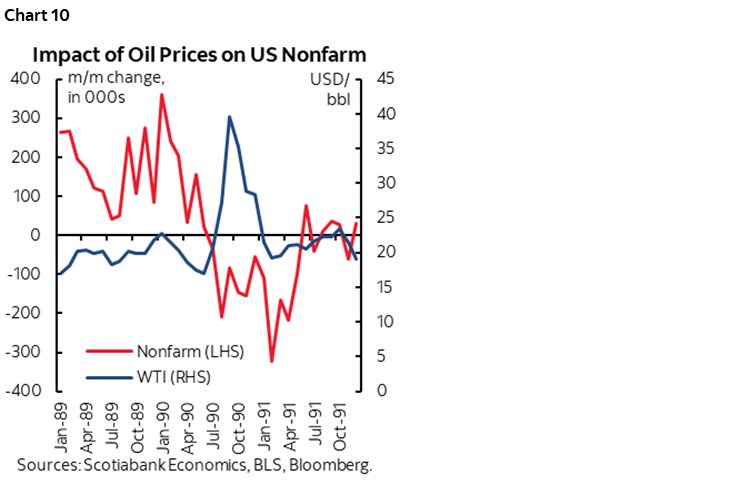
The biggest wildcard of all is when the war and the accompanying commodities shock will impinge upon hiring activity. Historically in reasonably modern times the only real comparator in terms of a sudden large war-driven spike in oil prices of this magnitude was in 1990–91. Payrolls fell almost immediately and—like today—had been weakening for some time in advance (chart 10). The attacks on Iran by the US and Israel at the end of February were between nonfarm reference periods this time and intensified as the month wore on. I would watch for a more negative impact upon hiring sentiment the next time we’re at this.
As for other advance readings, they’re never really all that helpful but ADP private payrolls (Wednesday) are looking set for a gain of around 35k based on slightly shaved weekly tracking so far. JOLTS job openings and layoffs for the prior month of February (Tuesday), as well as Challenger layoffs for March (Thursday) and Revelio’s gauge are still pending. Revelio’s initial pre-revision estimate, however, doesn’t really help despite its popularity. Job postings are largely moving sideways. Consumers continue to indicate difficulties in finding employment in measures like consumer confidence jobs plentiful.
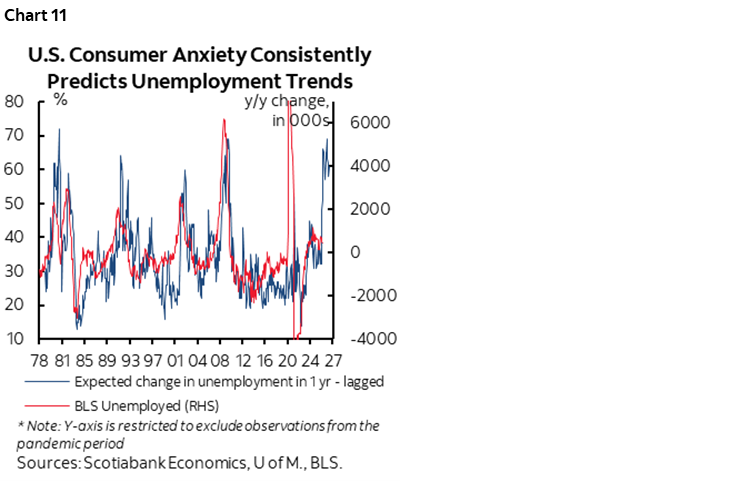
As for where we’re going in future, I still like chart 11 as a guide. It plots the UofM sentiment gauge’s measure of respondents who expect more unemployed over the coming year against the actual change in the number of unemployed lagged by a year. Note the tight fit and the warning about what lays ahead. It’s soft data, but with an exceptionally strong track record other than the very start of the pandemic shock for obvious reasons. That said, consumers are closer to hearing about their employers’ plans than outside forecasters.
CANADA’S ECONOMY—SOFT GROWTH
Canada updates GDP figures with details for January along with preliminary guidance for February sans details on Tuesday. Combined they will improve our tracking of Q1 economic growth. February could be the key and it might modestly improve Q1 growth tracking while nevertheless being stale data in the face of forward-looking developments in commodity markets.
January was initially guided by Statcan to be “essentially unchanged” back on February 27th. That preliminary reading may have worsened since then. Hours worked were up by a healthy 0.6% m/m SA which matters because GDP is hours times labour productivity. For productivity we need to consider activity readings and they looked pretty weak across manufacturing, housing and wholesalers for instance. Only retailers appeared to benefit from higher volumes as input to the sector’s GDP value-added estimates.
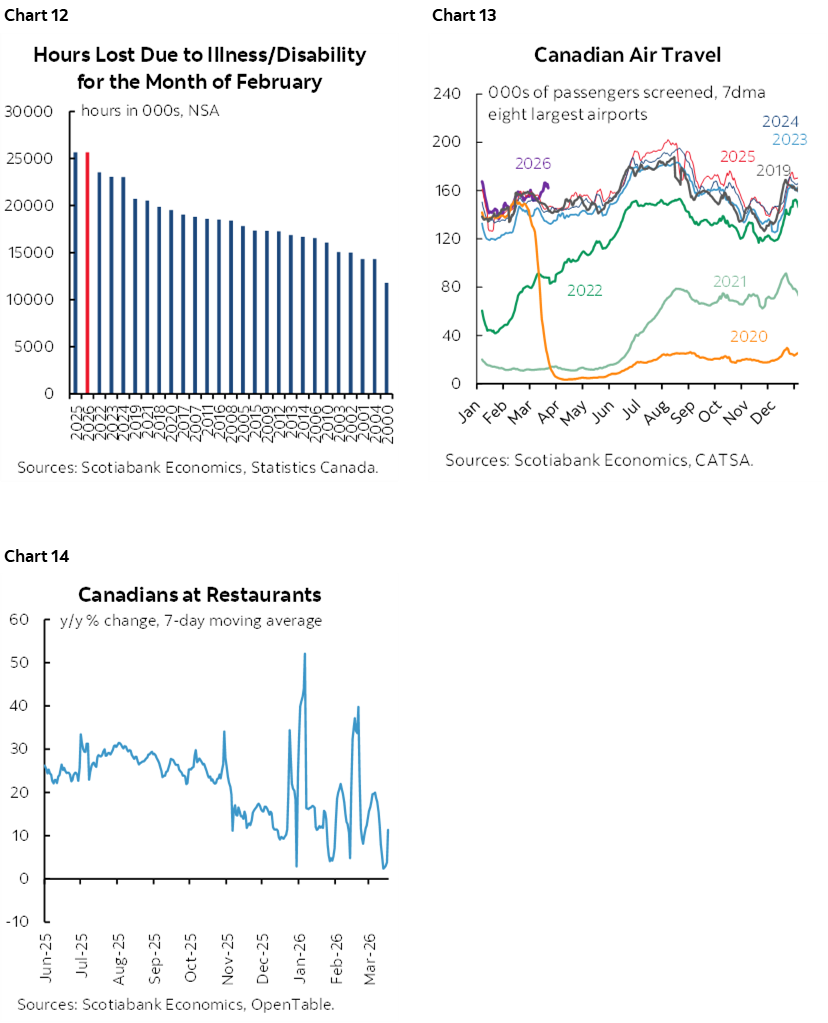
February GDP tracking faces the opposite dynamic and could post a healthy ¼% m/m gain. Hours worked fell by 1.1% m/m SA because of weather and especially sickness as the flu drove lost hours to a record high (chart 12). Yet activity readings like volume measures in housing, manufacturing, wholesalers and retailers picked up. Service sector proxies like air travel are also looking buoyant (chart 13) and so are restaurant bookings (chart 14).
Adding it all up could give Q1 GDP growth of around +¾% q/q SAAR using monthly GDP. That’s not great at all, but the supply side is undergoing negative shocks through falling population and the war-related shocks to global commodity markets that will ripple through supply chains.
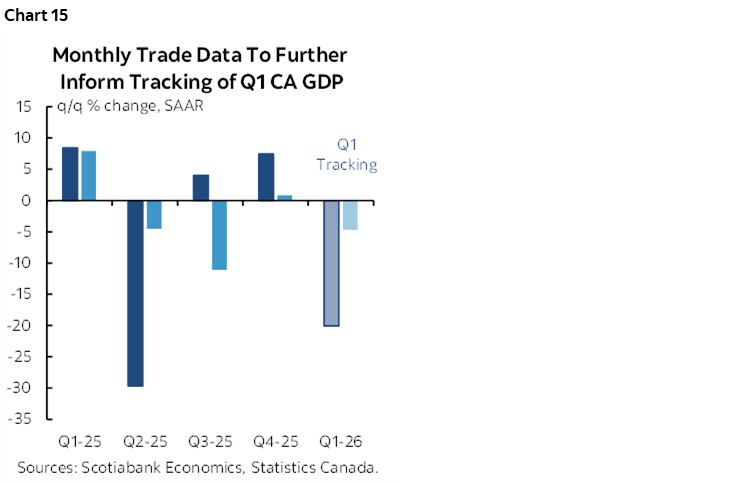
Also keep an eye on Thursday’s trade figures for February. They’ll further inform our tracking of quarterly expenditure-based GDP as opposed to monthly income-based GDP. With trade figures up to January it looks like a sharp drop in export and import volumes is being tracked as a reversal of solid export gains over 2025H2 (chart 15). Connected to this will be our expectation that the drag on GDP growth from inventory depletion in Q4 will reverse toward being a somewhat positive addition in Q1. On net, that has us tentatively forecasting Q1 GDP growth of 1.3% q/q SAAR on an expenditure basis which is the convention.
Believe it or not, that wouldn’t be bad at all. The reason for this is that the supply side is growing slowly. Potential GDP growth—a difficult to measure concept tracking the ability of the economy to grow without fanning inflation—is probably in that similar ballpark. In turn, Canada’s economy may not be adding to slack while other drivers of inflation are pointed sharply higher.
CENTRAL BANKS—BANREP ON A MISSION; WILL POWELL FOLLOW LAGARDE?
Watch for plenty of central bank speak over the coming week but only one policy decision.
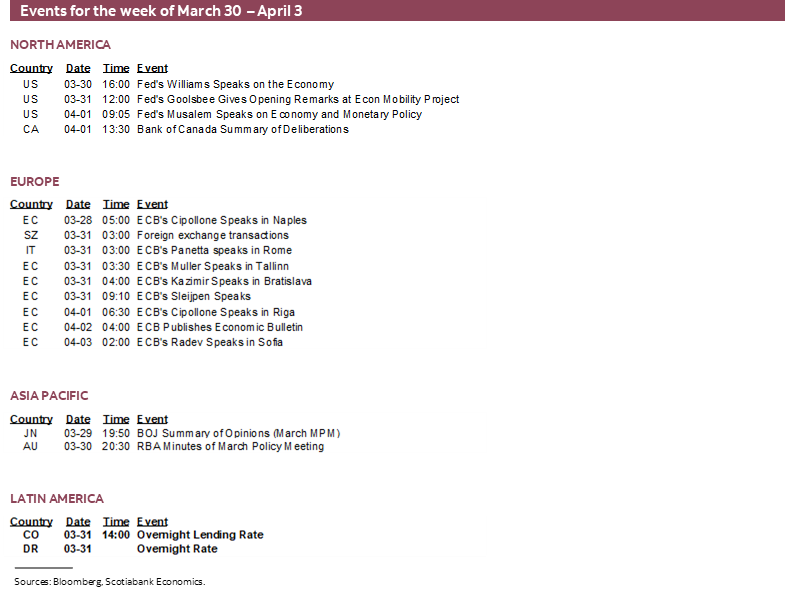
There will be scheduled appearances by multiple Federal Reserve and ECB officials over the week. That includes Chair Powell in a moderated discussion before Harvard economics students on Monday (10:30amET). The tone is likely to emphasize inflation concerns over labour markets for now. Key may be whether he follows in ECB President Lagarde’s footsteps when she sounded increasingly alarmed about developments in this interview within The Economist.
Lagarde said “Most people are actually talking about years” in terms of the time it will take to repair damage to energy infrastructure and emphasized supply chain inflation concerns while emphasizing decisive action if inflation pressures broaden.
Powell faces different circumstances so he may resist. The Fed is the only major central bank that is in restrictive territory into an inflation shock and therefore perhaps somewhat better positioned.
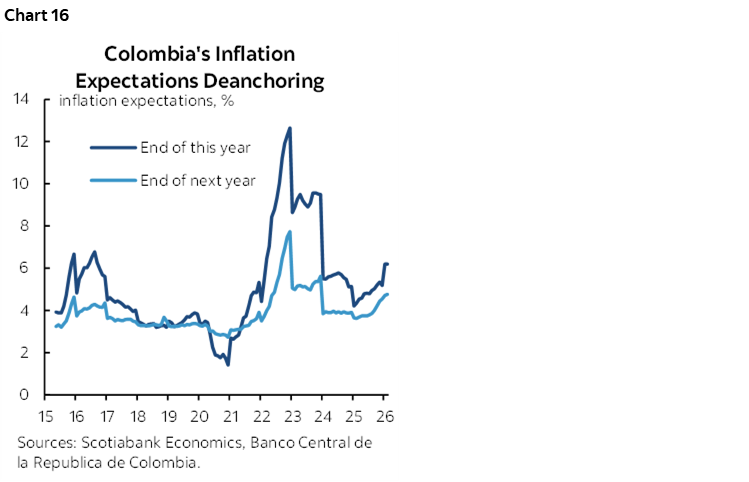
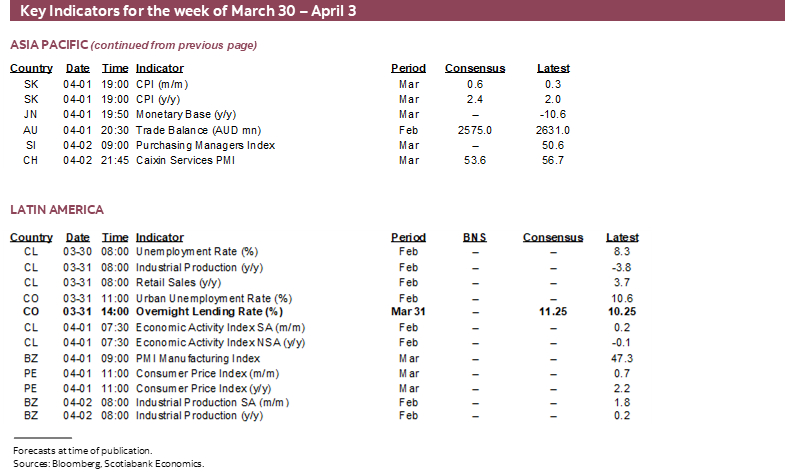
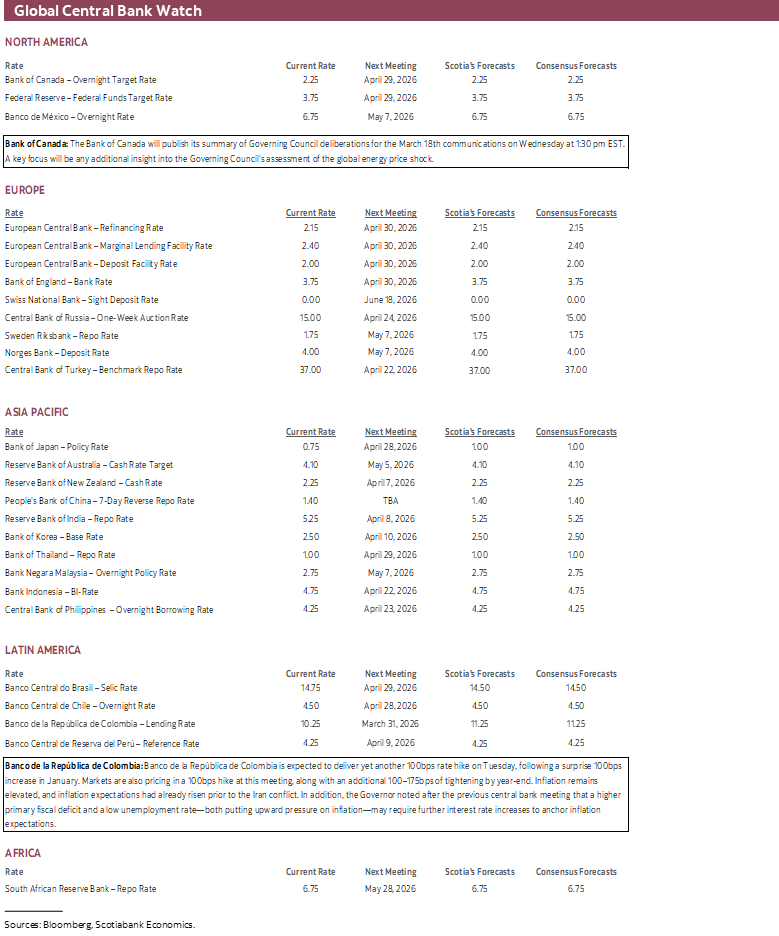
As for Colombia’s central bank decision on Tuesday, most economists expect a 100bps hike to 11.25%. It’s also largely priced by markets. It would follow the previous 100bps hike in January. Clearly, it’s a central bank on a mission. That mission is titled inflation curtailment. Inflation at 5.3% y/y in February and 5.2% on core faces sharp upward pressure once higher commodities really start to hit in March’s readings. Inflation expectations are also taking off (chart 16).
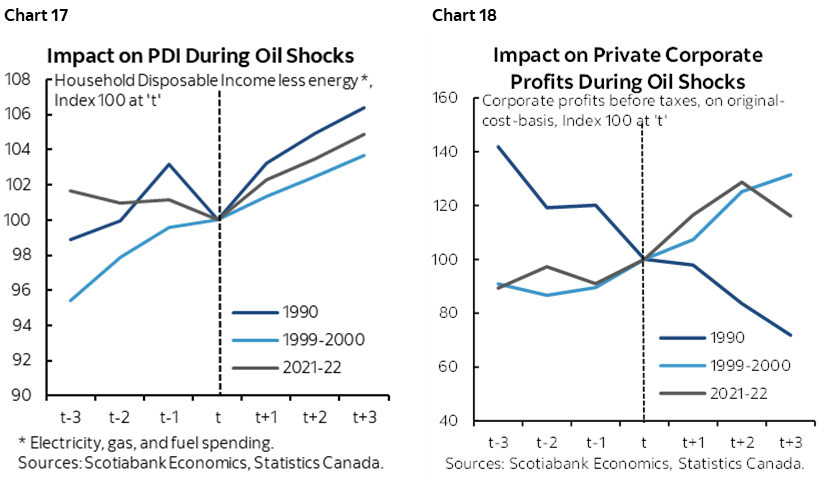
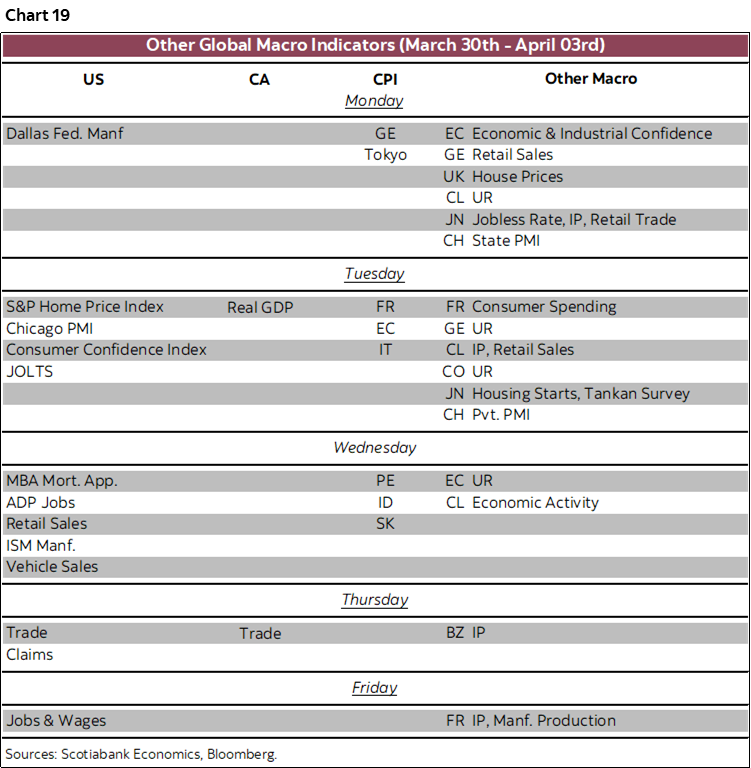
On Wednesday, the BoC releases its not-minutes ‘Summary of Deliberations’ through the whole decision-making process leading up to the March 18th communications. I don’t expect much of anything truly new. The BoC’s message has been cautious on the economy to date while warning it won’t let inflation risk spread like the last time. Watch for preliminary discussions on the impact of the energy shock on the economy. As charts 17 and 18 depict, household incomes and corporate profits tend to keep rising after recent energy shocks with the exception being the 1990–91 period. Everything went wrong at that time including a double digit BoC policy rate in the early days of inflation targeting with Governor Crow at the helm, an over 400bps 2s spread over the US, fiscal policy run amok, ratings downgrades, unflattering WSJ references to Canada being a ‘banana republic’, political tensions, adjusting to the Canada-US Free Trade Agreement and then NAFTA etc etc.
GLOBAL MACRO—ONLY THE FRESHEST, PLEASE
Multiple regions of the world economy will offer up limited data risk but only the freshest readings may garner attention in the face of the evolving energy shock. Jay Parmar and I offer the following comments.
In the coming week, we will receive a fresh round of first-hand inflation readings for March from several countries following the Middle East conflict that triggered a spike in energy prices. Although it is still early, the key focus will be on assessing the persistence of energy inflation and, more importantly, the degree to which higher energy prices are spilling over into other components.
Spain has already reported its figures. Germany’s inflation data will be released on Monday, followed by France and Italy on Tuesday, culminating in the eurozone aggregate inflation reading also due on Tuesday.
In Asia-Pacific, updated inflation readings will be released from Tokyo on Monday, followed by Indonesia and South Korea on Wednesday. In Latin America, Peru will also publish its inflation data on Wednesday.
In China, the dual PMI readings for March will be closely watched for early signs of whether—and to what extent—the energy supply shock is affecting economic activity. Consensus expects the state PMI, which is more reflective of activity among state-owned enterprises, to remain broadly flat. Meanwhile, the private PMI, which is more slanted toward smaller producers in coastal exporting areas, surged above expectations in February but are expected to pull back.
The US line-up also includes several other gems.
- House prices have been back on an upswing over the past five months and at an accelerating pace. The repeat sale price measures will be updated for January on Tuesday.
- Consumer confidence in March (Tuesday) may be a bit more resilient than the UofM consumer sentiment reading that fell 3.3 points. UofM is more driven by gas prices and markets whereas consumer confidence is more driven by labour markets.
- Retail sales during February (Wednesday) might post a solid gain driven by higher vehicle sales and a jump in gasoline prices.
- ISM-manufacturing for March (Wednesday) might be little changed around a 52.0 reading that signals moderate growth. Regional surveys have been mixed.
- Vehicle sales during March (Wednesday) are expected to be little changed around 15¾ million at an annualized rate and based upon industry guidance. Downside risk could arise by virtue of the fact that industry guidance is more skewed toward the first half of the month whereas soaring energy prices might have kept more buyers away later in the month.
- Trade figures for February (Thursday) could inform whether the US trade deficit continues to be largely rangebound on a trend basis despite tariffs.
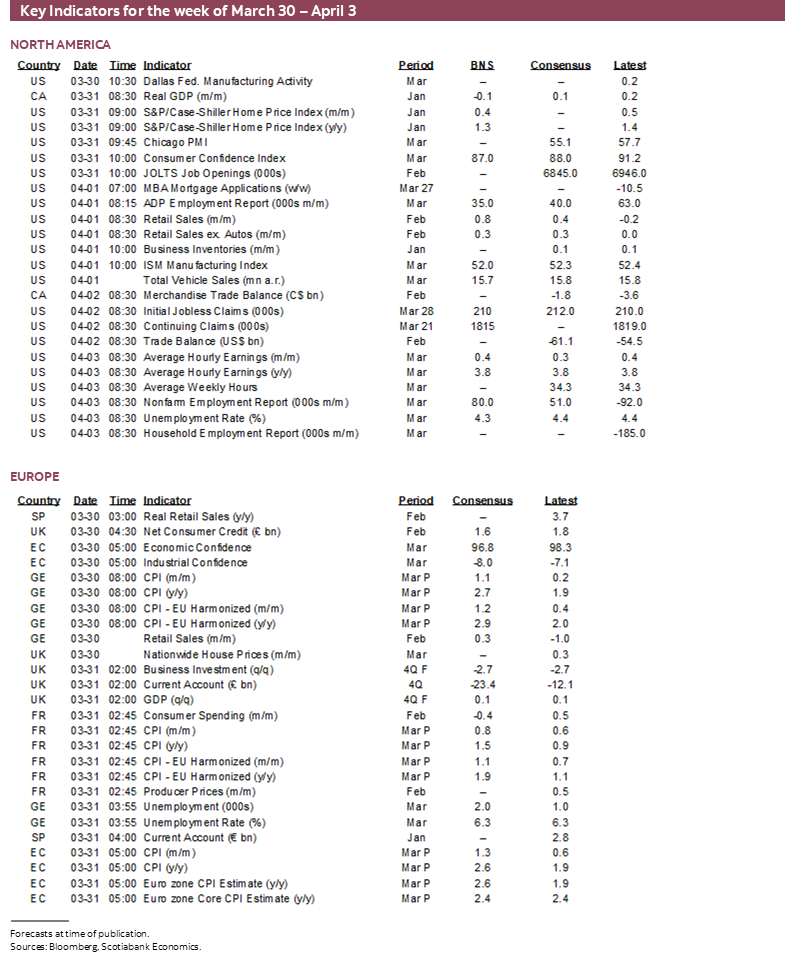
Chart 19 summarizes the main readings that are due out this week.
DISCLAIMER
This report has been prepared by Scotiabank Economics as a resource for the clients of Scotiabank. Opinions, estimates and projections contained herein are our own as of the date hereof and are subject to change without notice. The information and opinions contained herein have been compiled or arrived at from sources believed reliable but no representation or warranty, express or implied, is made as to their accuracy or completeness. Neither Scotiabank nor any of its officers, directors, partners, employees or affiliates accepts any liability whatsoever for any direct or consequential loss arising from any use of this report or its contents.
These reports are provided to you for informational purposes only. This report is not, and is not constructed as, an offer to sell or solicitation of any offer to buy any financial instrument, nor shall this report be construed as an opinion as to whether you should enter into any swap or trading strategy involving a swap or any other transaction. The information contained in this report is not intended to be, and does not constitute, a recommendation of a swap or trading strategy involving a swap within the meaning of U.S. Commodity Futures Trading Commission Regulation 23.434 and Appendix A thereto. This material is not intended to be individually tailored to your needs or characteristics and should not be viewed as a “call to action” or suggestion that you enter into a swap or trading strategy involving a swap or any other transaction. Scotiabank may engage in transactions in a manner inconsistent with the views discussed this report and may have positions, or be in the process of acquiring or disposing of positions, referred to in this report.
Scotiabank, its affiliates and any of their respective officers, directors and employees may from time to time take positions in currencies, act as managers, co-managers or underwriters of a public offering or act as principals or agents, deal in, own or act as market makers or advisors, brokers or commercial and/or investment bankers in relation to securities or related derivatives. As a result of these actions, Scotiabank may receive remuneration. All Scotiabank products and services are subject to the terms of applicable agreements and local regulations. Officers, directors and employees of Scotiabank and its affiliates may serve as directors of corporations.
Any securities discussed in this report may not be suitable for all investors. Scotiabank recommends that investors independently evaluate any issuer and security discussed in this report, and consult with any advisors they deem necessary prior to making any investment.
This report and all information, opinions and conclusions contained in it are protected by copyright. This information may not be reproduced without the prior express written consent of Scotiabank.
™ Trademark of The Bank of Nova Scotia. Used under license, where applicable.
Scotiabank, together with “Global Banking and Markets”, is a marketing name for the global corporate and investment banking and capital markets businesses of The Bank of Nova Scotia and certain of its affiliates in the countries where they operate, including; Scotiabank Europe plc; Scotiabank (Ireland) Designated Activity Company; Scotiabank Inverlat S.A., Institución de Banca Múltiple, Grupo Financiero Scotiabank Inverlat, Scotia Inverlat Casa de Bolsa, S.A. de C.V., Grupo Financiero Scotiabank Inverlat, Scotia Inverlat Derivados S.A. de C.V. – all members of the Scotiabank group and authorized users of the Scotiabank mark. The Bank of Nova Scotia is incorporated in Canada with limited liability and is authorised and regulated by the Office of the Superintendent of Financial Institutions Canada. The Bank of Nova Scotia is authorized by the UK Prudential Regulation Authority and is subject to regulation by the UK Financial Conduct Authority and limited regulation by the UK Prudential Regulation Authority. Details about the extent of The Bank of Nova Scotia's regulation by the UK Prudential Regulation Authority are available from us on request. Scotiabank Europe plc is authorized by the UK Prudential Regulation Authority and regulated by the UK Financial Conduct Authority and the UK Prudential Regulation Authority.
Scotiabank Inverlat, S.A., Scotia Inverlat Casa de Bolsa, S.A. de C.V, Grupo Financiero Scotiabank Inverlat, and Scotia Inverlat Derivados, S.A. de C.V., are each authorized and regulated by the Mexican financial authorities.
Not all products and services are offered in all jurisdictions. Services described are available in jurisdictions where permitted by law.