ECONOMIC OVERVIEW
- Colombian, Chilean, Peruvian, and Brazilian GDP data for Q2/June will complete the picture of each country’s economic performance in the first half of the year.
- In the first half of the year, Colombia’s resilience has surprised, but Peru’s economy has underwhelmed alongside Chile’s clear weakness, and Brazil’s strength on the aggregate masks decelerating services activity.
- Regional central bank surveys, industry and retail data, and the BCCh’s meeting minutes complete next week’s Latam calendar, while the Fed’s meeting minutes and Chinese macroeconomic indicators as well as other key employment and prices data in the G-10 keep global markets occupied.
PACIFIC ALLIANCE COUNTRY UPDATES
- We assess key insights from the last week, with highlights on the main issues to watch over the coming fortnight in the Pacific Alliance countries: Mexico and Peru.
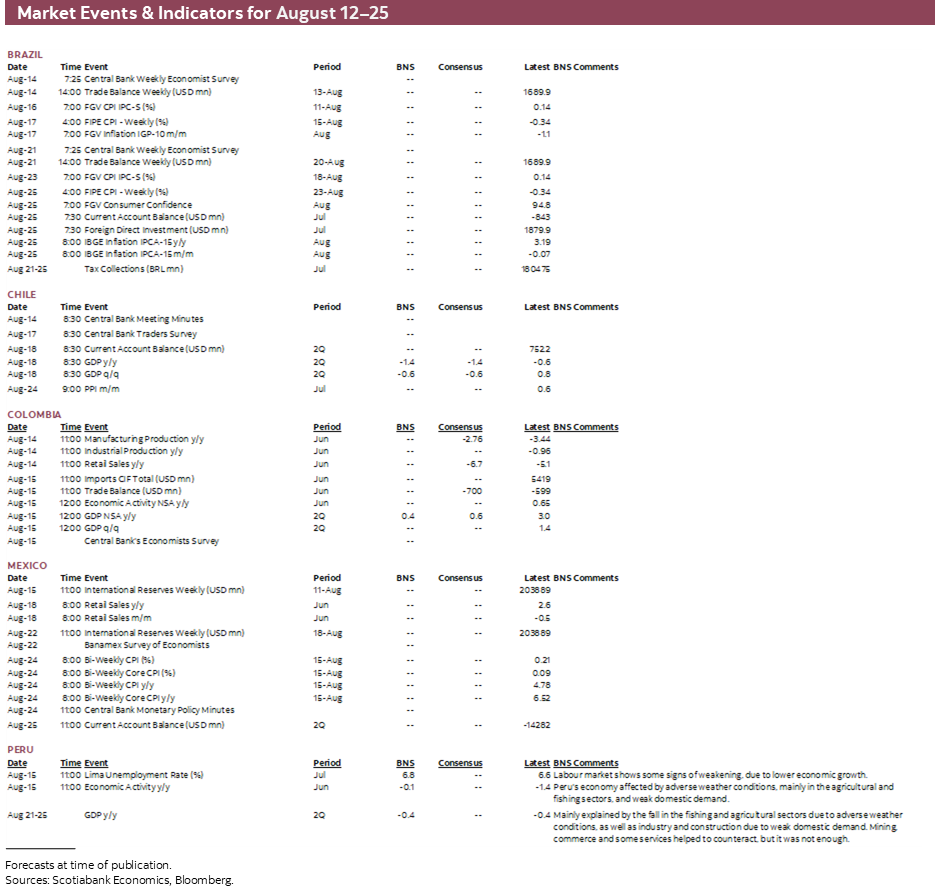
MARKET EVENTS & INDICATORS
- A comprehensive risk calendar with selected highlights for the period August 12–25 across the Pacific Alliance countries and Brazil.
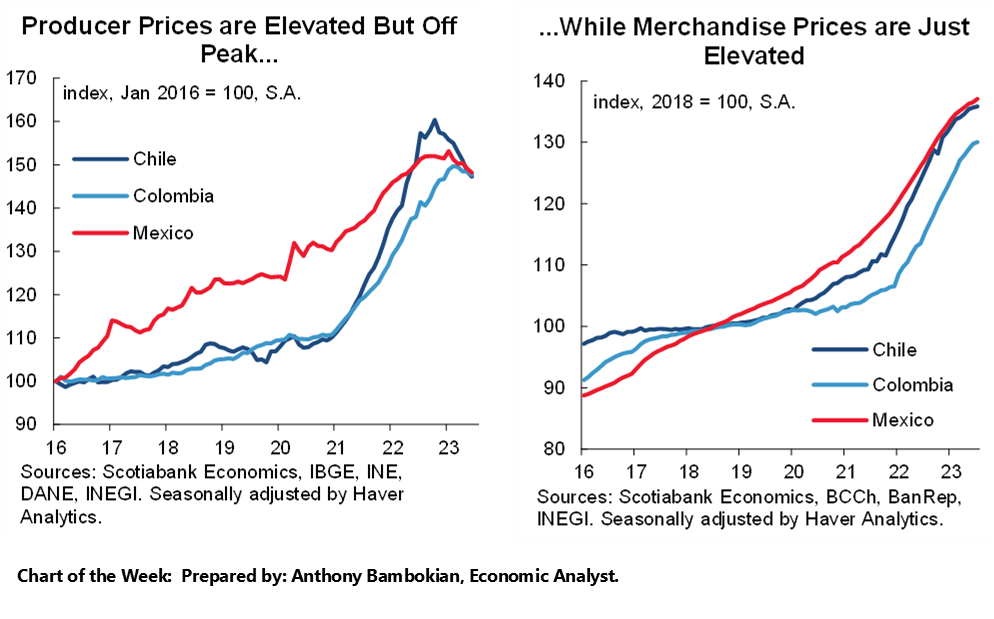
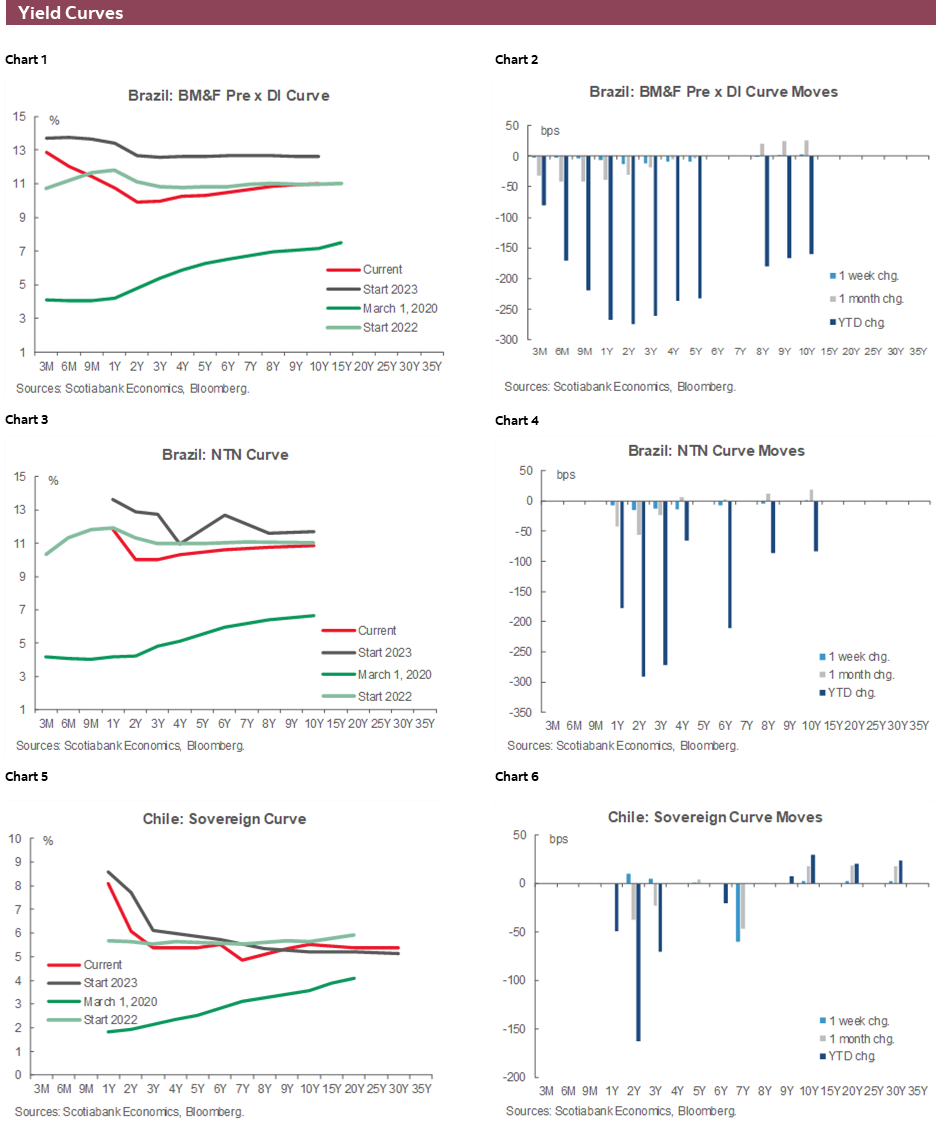
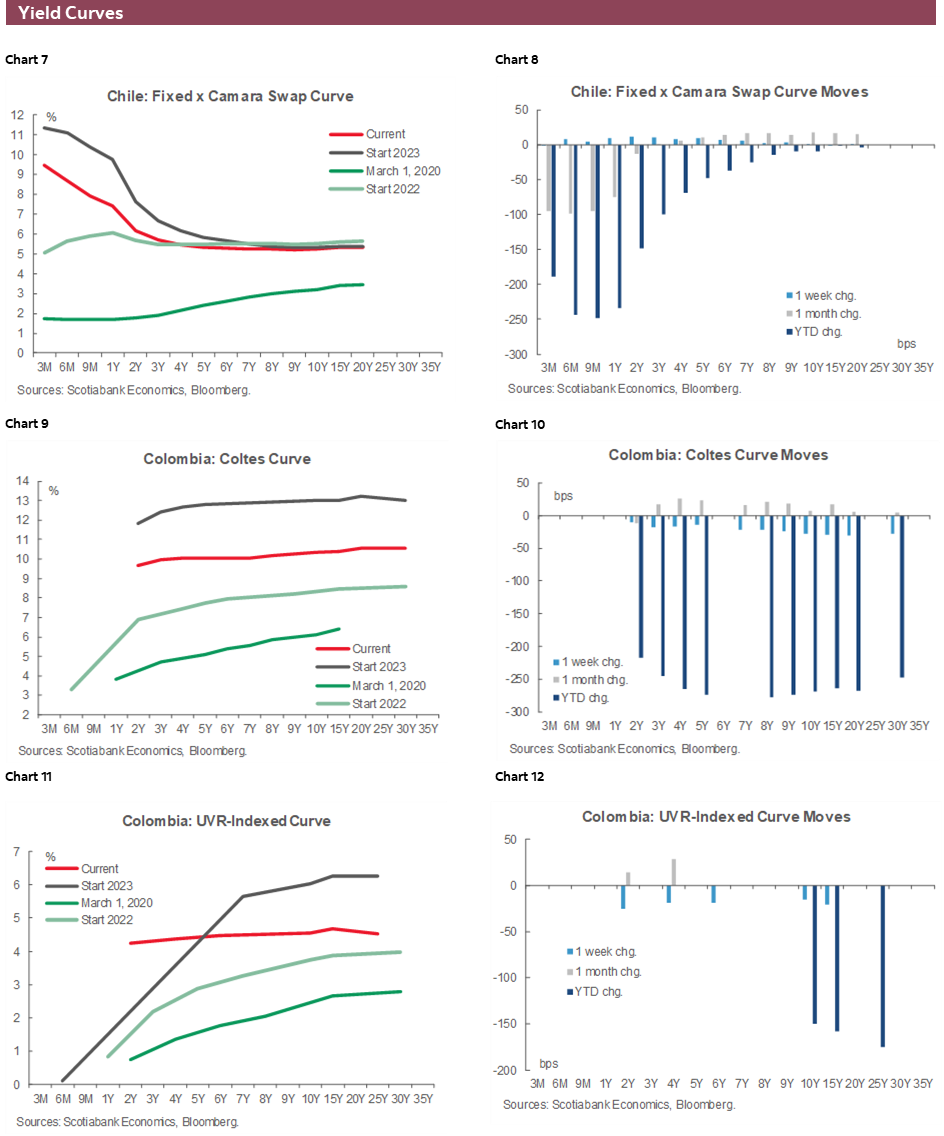
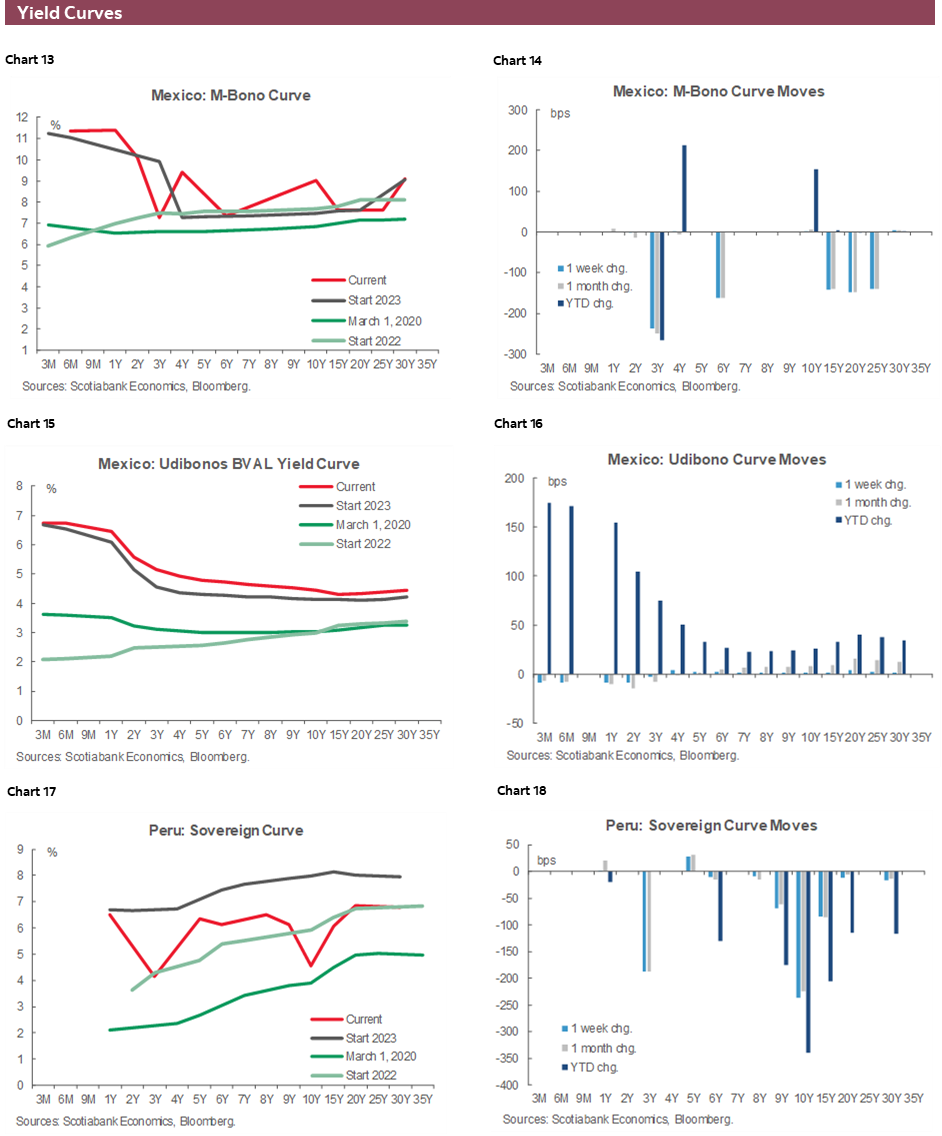
Charts of the Week
ECONOMIC OVERVIEW: H1-2023 REGIONAL GDP DATA
Juan Manuel Herrera, Senior Economist/Strategist
Scotiabank GBM
+44.207.826.5654
juanmanuel.herrera@scotiabank.com
- Colombian, Chilean, Peruvian, and Brazilian GDP data for Q2/June will complete the picture of each country’s economic performance in the first half of the year.
- In the first half of the year, Colombia’s resilience has surprised, but Peru’s economy has underwhelmed alongside Chile’s clear weakness, and Brazil’s strength on the aggregate masks decelerating services activity.
- Regional central bank surveys, industry and retail data, and the BCCh’s meeting minutes complete next week’s Latam calendar, while the Fed’s meeting minutes and Chinese macroeconomic indicators as well as other key employment and prices data in the G-10 keep global markets occupied.
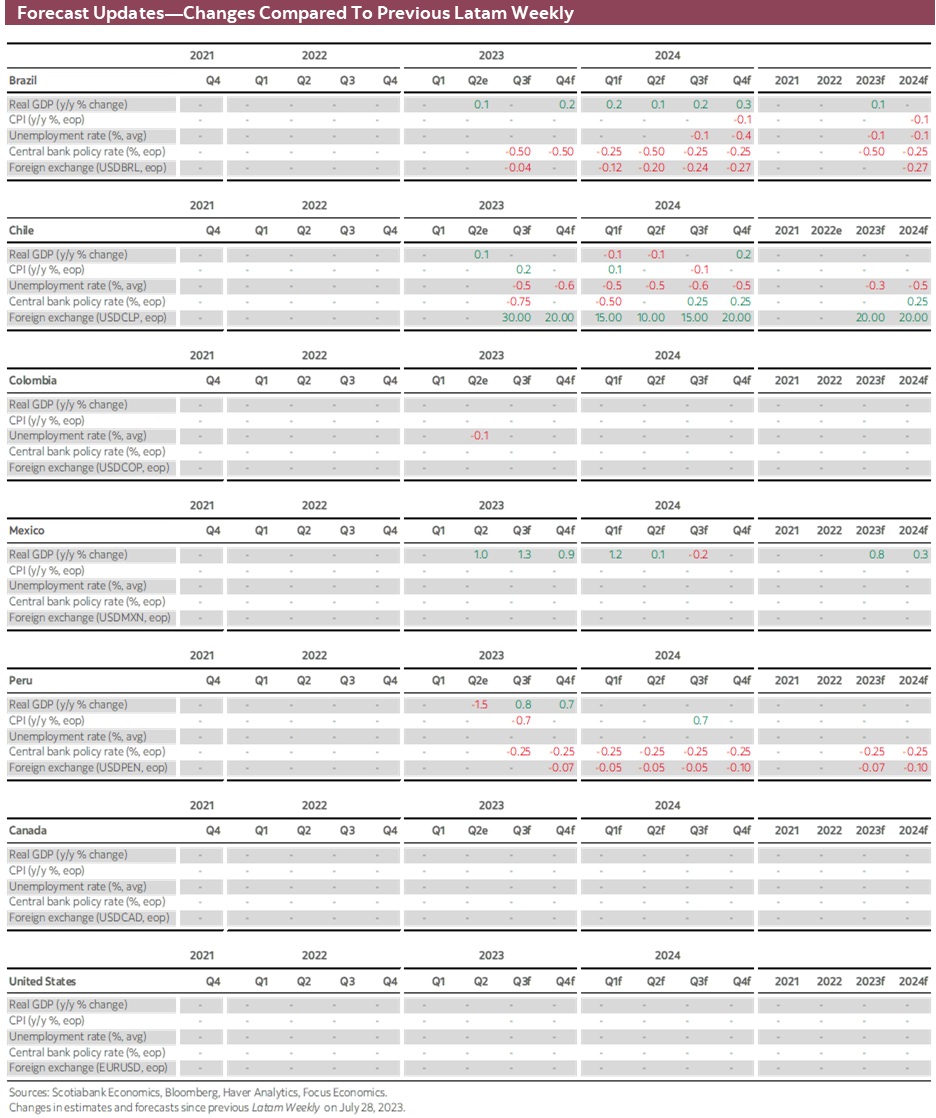
Next week’s Latam calendar will centre on Colombian, Chilean, Peruvian, and Brazilian GDP data for Q2/June to complete the picture of each country’s economic performance in the first half of the year.
Colombia’s performance exceeded expectations in H1-23 and the rebound in monthly economic activity in May after a weak April reinforced our view of a healthy and gradual deceleration in the country. The same cannot be said about Chile and Peru, however, that were in negative growth territory in the year-to-May, according to monthly GDP figures and we’ll see negative full-quarter contractions in next week’s figures. Brazil has also shown resilient growth, but the agricultural sector has pulled the country forward against softer services activity.
Ahead of Colombia’s Q2 GDP data, Monday’s manufacturing/industrial production and retail sales readings for June will give us the final hints for the quarterly GDP data out the following day—accompanied by June economic activity. Manufacturing output and retail sales are expected to print another y/y decline for the fourth and fifth consecutive month.
Weakness at the start of the quarter (and, to some degree, soft Feb/Mar data) mean that, despite the May economic activity rebound of 0.7% y/y, growth should still only be somewhere around 0.5% y/y in Q2, quite a step down from 3.0% y/y in Q1-23. According to our economists in Bogota, this deceleration owes to declines in machinery and equipment investment and muted growth in household consumption.
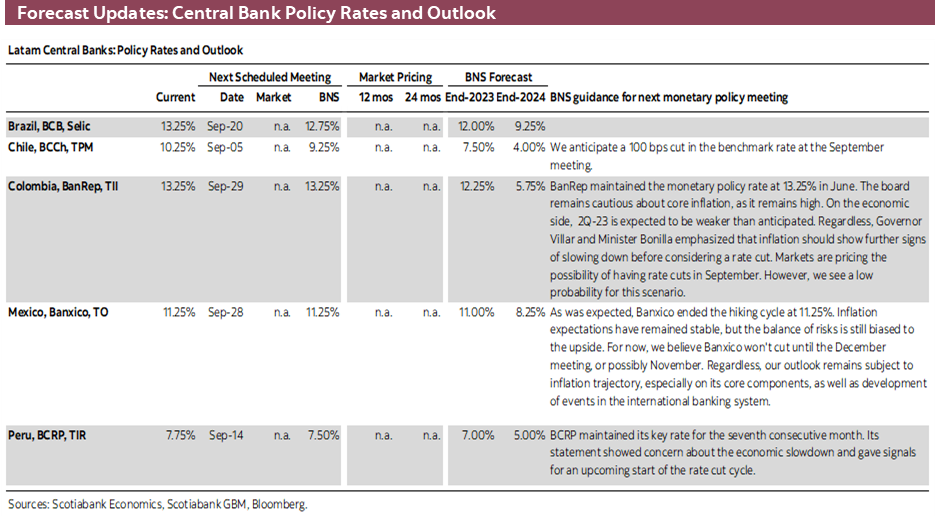
On top of the macro data, BanRep’s survey of economists out a few hours after the GDP release will shed some light on how split experts are on the start of the central bank’s cutting cycle. We don’t see the bank beginning rate cuts until the fourth quarter, but some at BanRep (FinMin Bonilla, specifically) are eyeing September as the start date for lower rates and some experts may be on board with this view.
Rather than accelerating the pace of BCRP cuts, the soft patch that Peru’s economy finds itself in could bring forward the first reference rate reduction. Thursday’s decision that delivered an unchanged 7.75% reference rate surprised very few, but it may have marked the last on-hold meeting for the bank since it last decided to hike in January (see the team’s BCRP recap here).
For next Tuesday’s monthly June GDP data, our economists in Peru project nil growth, with another very weak fishing sector performance offset by a strong month in mining. Last Thursday, FinMin Contreras said that output likely grew around 0% in June, but that this should be accompanied by a 1% expansion in July. That’s still not an excellent performance and growth will return in the second half of the year but at an underwhelming pace that may motivate an earlier rate cuts cycle start.
On Monday, Brazil’s economic activity is estimated to have expanded at a 1.8% y/y pace in June, with a 0.5% m/m gain clawing back a share of the steep 2% m/m drop in May. No doubt, Brazil’s year-to-May growth of 3.6% y/y has been much better than forecast at the start of the year, but this outperformance has largely been driven by the agricultural sector while services is on clearer sluggish trajectory. This slowdown in the services industry and continued progress on inflation (most notably in core categories) remain supportive of the BCB’s guidance that large cuts will continue over the next few meetings. The market has about a toss-up odds chance of a 75bps cut in September priced in; we’ll see in Monday’s weekly BCB survey results where analysts stand.
The second half of the week will centre around Mexican and Chilean releases, with the BCCh’s traders survey due on Thursday leading to the publication of Chilean Q2 GDP data and Mexican retail sales for June on Friday morning.
For next week’s Q2-23 GDP figures, our Santiago economists project a 1.4% y/y contraction (as does the median economist polled by Bloomberg). Economic weakness continues to support a quick pace of rate cuts, and we’ll gauge how much appetite there is for rapid easing among BCCh officials in the bank’s meeting minutes out on Monday.
As for the traders survey, it will likely be in line with the August 10th results of the BCCh’s economists survey that showed a revision lower to the outlook for end-2023 rates as the large 100bps cut with which the bank began the easing cycle pushed economists to project a 50bps lower year-end overnight rate, at 7.50%, i.e. 275bps in reductions across the final three meetings of the year.
Outside of domestic releases, Latam markets will likely be influenced by Chinese sector-level activity data on Tuesday, keeping an eye on the PBoC’s policy rate settings that same day, as worries linger over the lack of, or underwhelming, support from policymakers in the country amid sluggish growth. In the US, the Fed’s meeting minutes, and retail sales, housing sector, and jobless claims data are the focus, while G-10 markets will also follow UK, Japanese, and Canadian CPI, Japanese Q2 GDP, and Australian and UK wages and employment data, as well as the RBNZ’s decision (hold expected).
PACIFIC ALLIANCE COUNTRY UPDATES
Mexico—Great News on Mexican Investment, But Some Context and Temperance is Important
Eduardo Suárez, VP, Latin America Economics
+52.55.9179.5174 (Mexico)
esuarezm@scotiabank.com.mx
On August 4th (last Friday), we got an update on investment performance in Mexico, with data for May. We would argue that while the news was overwhelmingly good, how good it was needs to be put in context. The print, we’d argue, was fantastic. Consensus looked for +9.7% y/y (very strong, with GDP for Q2 coming in at +3.7%), but even with that solid of a consensus, expectations were obliterated with the actual print coming in at +17.4% y/y. Potentially even better news, is that investment is finally shutting the gap relative to broad economic activity, suggesting a recovery in potential growth. The underperformance of investment is one of the main challenges we saw for the Mexican economy, and it finally seems like this spending is catching up. It’s worth noting that:
- There is still a gap between investment and broader GDP, but at current trends, it could shut in the current year (chart 1).
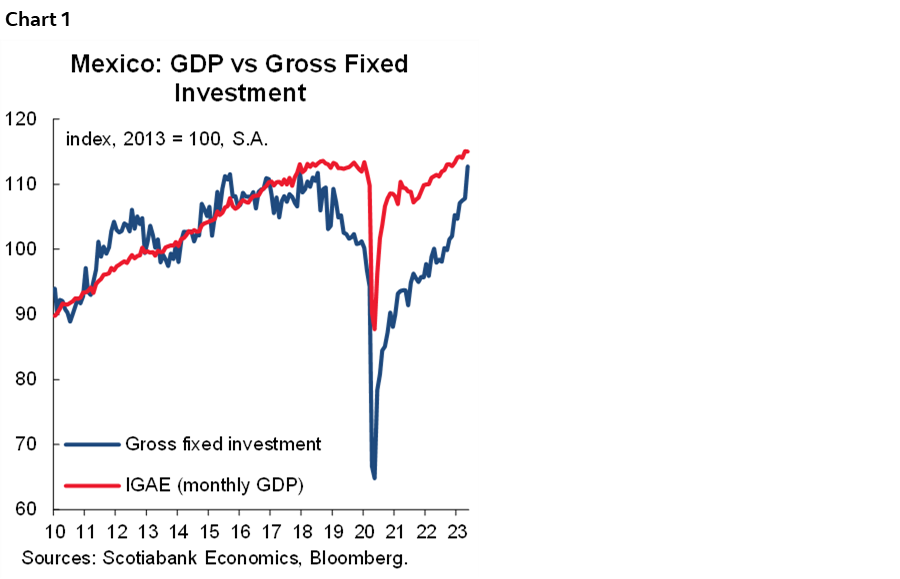
- It’s also notable that if we’re thinking about potential growth, 5 years of very strong underperformance in investment has meant that the country’s capital stock needs to be replenished, given underinvestment was so strong, there were likely cuts even on maintenance of existing equipment. Hence, we likely need a period of above average investment levels to be maintained before a clear victory can be claimed.
- If we assume that machinery and equipment is depreciated somewhere in a 5- to 10-year span and construction is depreciated over a longer period (say 20 years), that machinery and equipment have led the charge in the recent performance of investment suggests that a material portion of this increase relates to lagging maintenance and depleted equipment replacement.
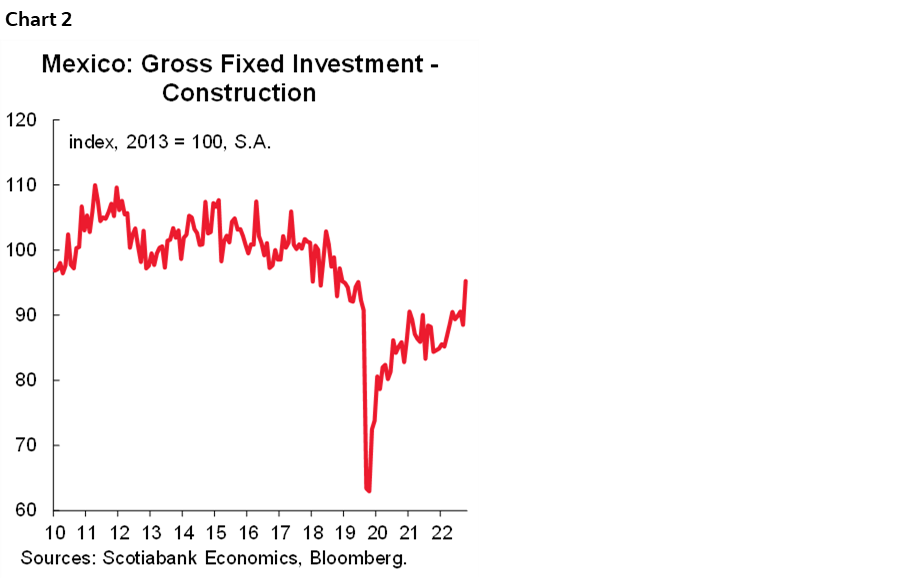
Also, great news was that at +7.6% m/m, the construction subcomponent finally printed a solid number after flatlining and contracting for five years (chart 2). The index is measured as 2013=100, and the last print was still 95 (last seen before this cycle in 2007), yet it was a remarkably strong print, and it points to nearshoring expectations possibly starting to show in the data. Two caveats here: 1) one super data point does not mark a trend, and 2) it was great news, but as we noted earlier, we’re still at 2007 levels.
Overall, we believe the print was very solid news for the Mexican economy, and its potential growth going forward, and to some degree, it suggests some of the “nearshoring” opportunity is actually materializing. However, we also think we need a sustained period of similar prints before “victory” can be called.
Peru—Best to Leave H1-23 Behind Us, as GDP Growth in June, Q2, and H1 Will be Negative; H2 Will be Better
Guillermo Arbe, Head Economist, Peru
+51.1.211.6052 (Peru)
guillermo.arbe@scotiabank.com.pe
Next Tuesday, August 15th, the official GDP figure for June will be released. This will provide the final pencil stroke in the disappointing portrait for growth in the first half of 2023. Last week Finance Minister Contreras had anticipated that GDP growth would be in the vicinity of -1% y/y in June. This was on information of a 69% decline in fishing, as well as the impact of El Niño on agriculture. He has since changed his tune stating that the figure for mining GDP was strong enough to bring GDP closer to nil. Our own figures broadly confirm this. Considering 16% y/y growth in mining, we estimate aggregate GDP growth to be just under nil in June.
However this may be, GDP growth in Q2 will surely be negative, and could well be a repeat of -0.4% y/y growth that occurred in Q1. Two quarters of negative growth.
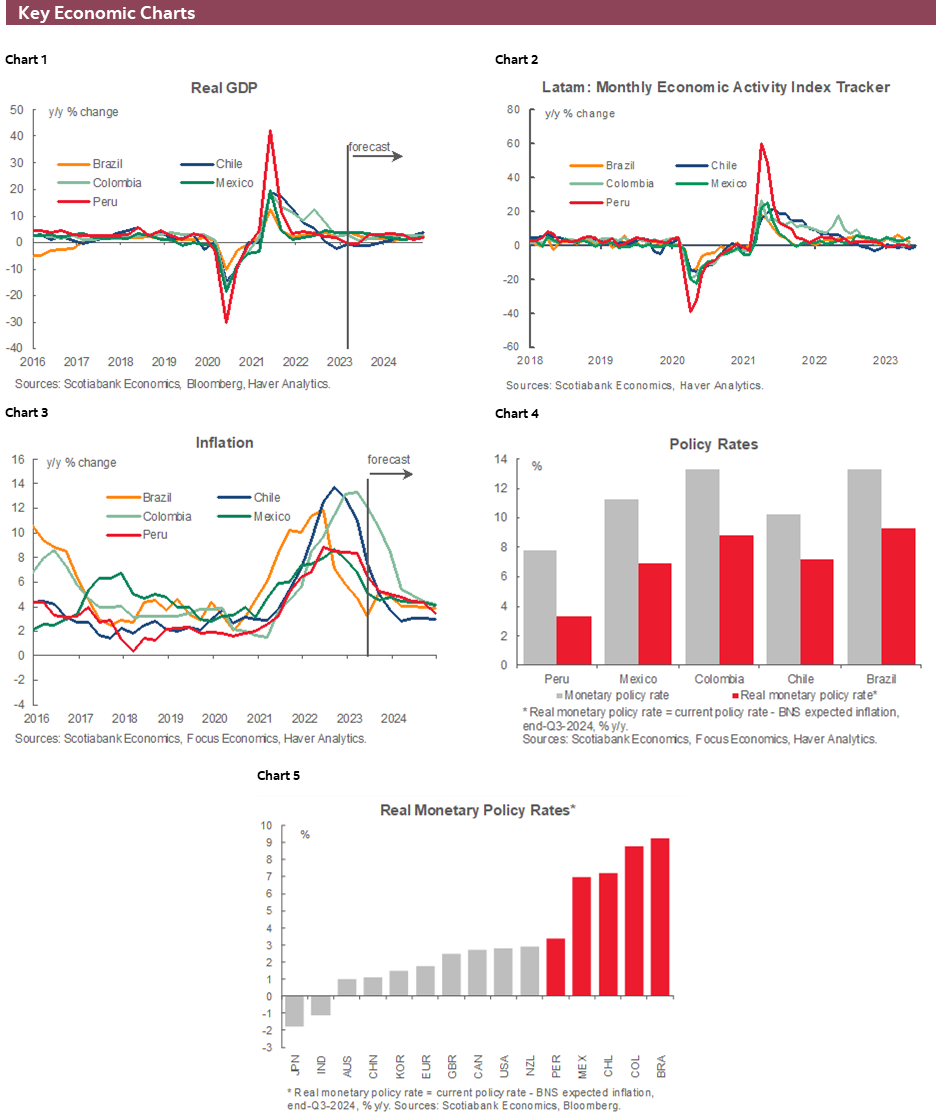
Of course, much of the negative GDP growth so far this year can be attributed to exogenous events, namely protests in January–February, and severe weather in April–June (see chart 3).

And yet, taking a deeper dive into the components of GDP, not all the blame can be put on exogenous events. Chart 4 does make clear just how strongly El Niño impacted agriculture and fishing in the April–June period. At the same time, however, it is equally clear that if we exclude agriculture, fishing and, on the positive side, mining (the impact of the new Quellaveco mine), growth in the rest of the economy, mainly linked to domestic demand, was negative as well. This suggests that endogenous factors were also in play. Two key domestic-demand sectors in particular, construction and industrial production, have shown negative growth during this period and, indeed, throughout H1-23.

Luckily, there is mining, which is estimated to have grown 9.5% y/y in H1. Looking at the accompanying chart, one could be excused for thinking that the only sector that is growing is mining. This is not quite the case, tourism, commerce, and range of service activities are also showing positive growth, but mining is certainly the leader.
So, with negative GDP growth in H1, will GDP rebound sufficiently in H2 to meet our full year forecast of 1.4% GDP growth? Not easily. But it’s not impossible. The second half will have a few tailwinds going for it: 1. Political turbulence in 2022 provides a low base, especially in December; 2. Fishing and agriculture should be normal at least in the August–November period; 3. Inflation is declining, and interest rates have stabilized and are likely to soon begin to be adjusted downward. But these tailwinds will really need to line up nicely for growth to reach 3% levels in H2. At least the tailwinds are real and should prevail. Well, until the next El Niño, which is likely to begin raining on Peru’s limping parade in Q1-24.
| LOCAL MARKET COVERAGE | |
| CHILE | |
| Website: | Click here to be redirected |
| Subscribe: | anibal.alarcon@scotiabank.cl |
| Coverage: | Spanish and English |
| COLOMBIA | |
| Website: | Click here to be redirected |
| Subscribe: | jackeline.pirajan@scotiabankcolptria.com |
| Coverage: | Spanish and English |
| MEXICO | |
| Website: | Click here to be redirected |
| Subscribe: | estudeco@scotiacb.com.mx |
| Coverage: | Spanish |
| PERU | |
| Website: | Click here to be redirected |
| Subscribe: | siee@scotiabank.com.pe |
| Coverage: | Spanish |
DISCLAIMER
This report has been prepared by Scotiabank Economics as a resource for the clients of Scotiabank. Opinions, estimates and projections contained herein are our own as of the date hereof and are subject to change without notice. The information and opinions contained herein have been compiled or arrived at from sources believed reliable but no representation or warranty, express or implied, is made as to their accuracy or completeness. Neither Scotiabank nor any of its officers, directors, partners, employees or affiliates accepts any liability whatsoever for any direct or consequential loss arising from any use of this report or its contents.
These reports are provided to you for informational purposes only. This report is not, and is not constructed as, an offer to sell or solicitation of any offer to buy any financial instrument, nor shall this report be construed as an opinion as to whether you should enter into any swap or trading strategy involving a swap or any other transaction. The information contained in this report is not intended to be, and does not constitute, a recommendation of a swap or trading strategy involving a swap within the meaning of U.S. Commodity Futures Trading Commission Regulation 23.434 and Appendix A thereto. This material is not intended to be individually tailored to your needs or characteristics and should not be viewed as a “call to action” or suggestion that you enter into a swap or trading strategy involving a swap or any other transaction. Scotiabank may engage in transactions in a manner inconsistent with the views discussed this report and may have positions, or be in the process of acquiring or disposing of positions, referred to in this report.
Scotiabank, its affiliates and any of their respective officers, directors and employees may from time to time take positions in currencies, act as managers, co-managers or underwriters of a public offering or act as principals or agents, deal in, own or act as market makers or advisors, brokers or commercial and/or investment bankers in relation to securities or related derivatives. As a result of these actions, Scotiabank may receive remuneration. All Scotiabank products and services are subject to the terms of applicable agreements and local regulations. Officers, directors and employees of Scotiabank and its affiliates may serve as directors of corporations.
Any securities discussed in this report may not be suitable for all investors. Scotiabank recommends that investors independently evaluate any issuer and security discussed in this report, and consult with any advisors they deem necessary prior to making any investment.
This report and all information, opinions and conclusions contained in it are protected by copyright. This information may not be reproduced without the prior express written consent of Scotiabank.
™ Trademark of The Bank of Nova Scotia. Used under license, where applicable.
Scotiabank, together with “Global Banking and Markets”, is a marketing name for the global corporate and investment banking and capital markets businesses of The Bank of Nova Scotia and certain of its affiliates in the countries where they operate, including; Scotiabank Europe plc; Scotiabank (Ireland) Designated Activity Company; Scotiabank Inverlat S.A., Institución de Banca Múltiple, Grupo Financiero Scotiabank Inverlat, Scotia Inverlat Casa de Bolsa, S.A. de C.V., Grupo Financiero Scotiabank Inverlat, Scotia Inverlat Derivados S.A. de C.V. – all members of the Scotiabank group and authorized users of the Scotiabank mark. The Bank of Nova Scotia is incorporated in Canada with limited liability and is authorised and regulated by the Office of the Superintendent of Financial Institutions Canada. The Bank of Nova Scotia is authorized by the UK Prudential Regulation Authority and is subject to regulation by the UK Financial Conduct Authority and limited regulation by the UK Prudential Regulation Authority. Details about the extent of The Bank of Nova Scotia's regulation by the UK Prudential Regulation Authority are available from us on request. Scotiabank Europe plc is authorized by the UK Prudential Regulation Authority and regulated by the UK Financial Conduct Authority and the UK Prudential Regulation Authority.
Scotiabank Inverlat, S.A., Scotia Inverlat Casa de Bolsa, S.A. de C.V, Grupo Financiero Scotiabank Inverlat, and Scotia Inverlat Derivados, S.A. de C.V., are each authorized and regulated by the Mexican financial authorities.
Not all products and services are offered in all jurisdictions. Services described are available in jurisdictions where permitted by law.