Overview
- Key Insights from Customer Transactions
- COVID-19, the Canadian Economy and Scotiabank’s Transactions Data
- Business Transactions Data Details
- Retail Transactions Data Details
- Other High-Frequency Indicators of Activity
1. Key Insights from Canadian Customer Transactions
This presentation is part of the weekly series intended to draw insights about the state of the Canadian economy from the flow of Scotiabank’s retail and non-retail transactions data.
Key takeaways from the payments data in this week’s publication:
- Updated to September 4th, automated funds transfers in the business sector remained volatile:
-Incoming transactions declined in late August, before rebounding in the first few days of September. While some of this dynamic is explained by transactions in the financial sector, most industries saw declines in late-August. In -particular, payments to manufacturing firms failed to surpass the level of 2019, having come close in mid-August, before falling back more recently.
-Payroll deposits, while volatile, have stabilized relative to 2019 levels, suggesting that the pace of job growth has likely slowed in August. - Consumer transactions, available through September 6th, have remained relatively stable compared to last year’s levels:
-Credit card spending, as well as cash usage, as shown by low levels of ABM transactions, continue to lag significantly compared to debit card usage.
-Levels of spending in most categories have now stabilized compared to 2019. Nevertheless, there are tentative signs of spending starting to slow relative to July-August.
-Recently-observed creep up in the number of COVID-19 cases across Canada could constrain and even reverse the nascent recovery in the hard-hit retail sectors.
2. COVID-19 and the Canadian Economy: Scotiabank Transactions Data
- We present data on retail and non-retail transactions, which capture distinct but related aspects of economic activity in Canada.
- The data comprises actual observed daily transactions going through debit or credit card payment networks in the retail space, and automated funds transfers (AFTs) in the non-retail space.
-The transactions are anonymized and aggregated to protect the privacy of Scotiabank’s clients. - In the current circumstances, comparing the dollar volumes of transactions in the current year and in 2019 can be indicative of the depth of the decline in economic activity in Q2-2020 and help track growth through the re-opening phase.
-Note that the mapping from the volume of transactions to measures of economic activity (e.g. GDP) is imperfect, and so care must be taken when drawing the implications. - The AFT payments show bill payments to/from companies in Canada.
-Incoming payments can be associated with company revenue, and outgoing payments can be associated with costs. - Debit and credit card payments can be used to measure the evolution of retail spending at various types of establishments.
-The transactions can serve as a measure of economy-wide retail spending, and of the extent to which households are resuming pre-COVID levels of activity.
-Note that the use of electronic payments has increased because of COVID-19, so comparisons to year-ago levels can be misleading. These data are best used to observe directional movements rather than to make specific assessments on the level of activity.
2. COVID-19 and the Canadian Economy: Caveats
There are important caveats to analysis based on the payments data:
- The data is observed at daily frequency and embeds different types of seasonal patterns.
-For retail payments, the volume and types of payments are different depending on the day of the week and the season.
-For non-retail payments, both the day of the week and the season are important. In addition, some payments are tied to the calendar date (e.g. rent payments are made on the first day of each month), some payments have a bi-weekly schedule, etc.
-To smooth out most of the day-to-day seasonality we use a 14-day moving average of the dollar volume of transactions, taking a y/y% change to remove any remaining seasonal patterns related to the calendar date. - In addition to seasonality, there is normal payment volatility related to the random nature of the transactions process and the impact of regional and economy-wide events (weather, labour strikes, etc.).
-The volatility of this nature may or may not be related to economic activity as measured by GDP and so, as mentioned above, care must be taken in drawing inference. - For business transactions, which are inherently more lumpy compared to retail spending, data towards the end of the sample can be revised as some AFT payments are recorded with a lag. As a result we exclude the last few days of data of business transactions only.
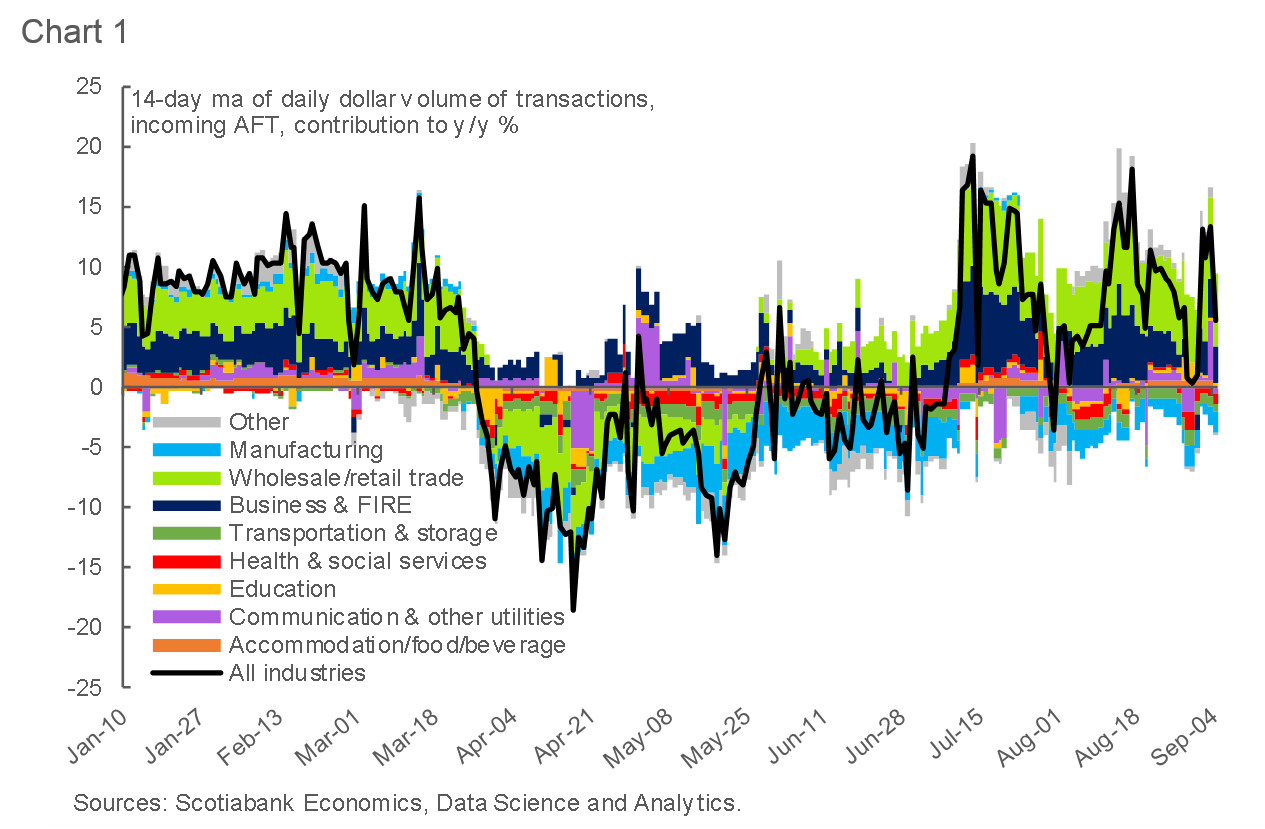
3. Business Transactions Data: Volatile Hand-off to September
- Automated Funds Transfers (AFT) are used for:
-rent and mortgage payments;
-payroll deposits; and
-other bills. - Incoming transactions declined in late August, before rebounding in the first few days of September. While some of this dynamic is explained by transactions in the financial sector, most industries saw declines in late-August.
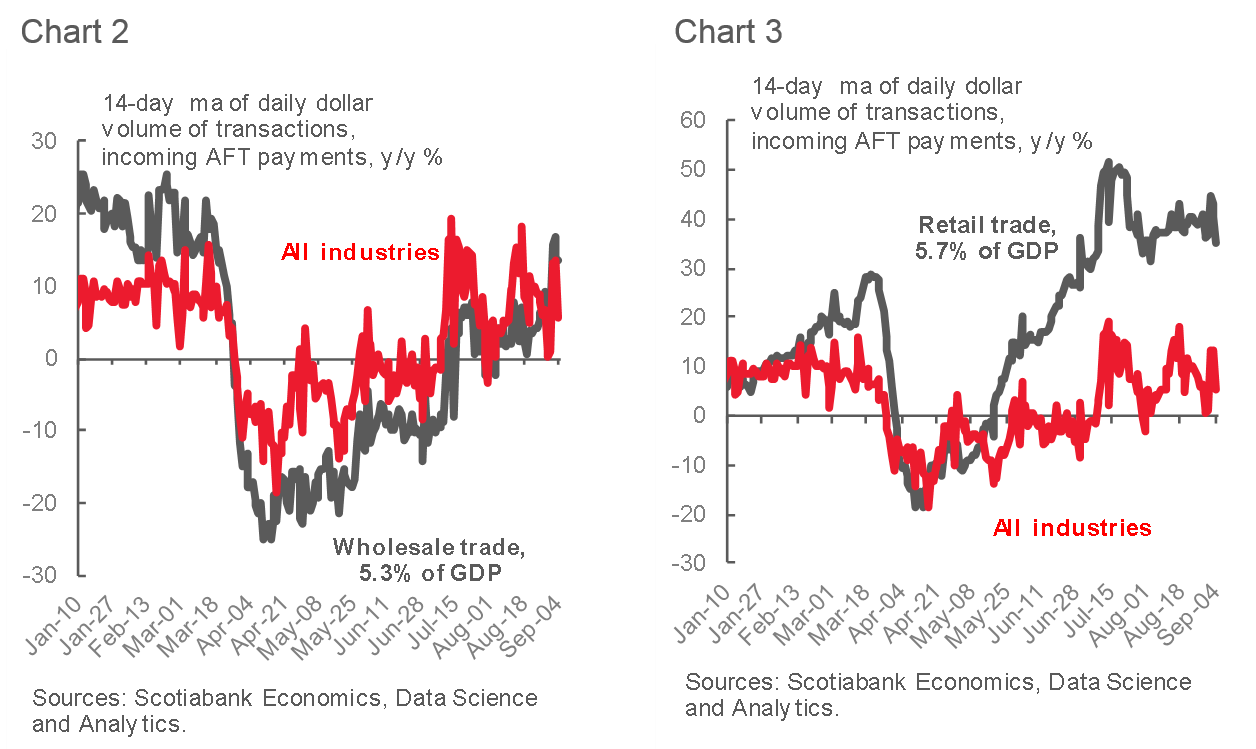
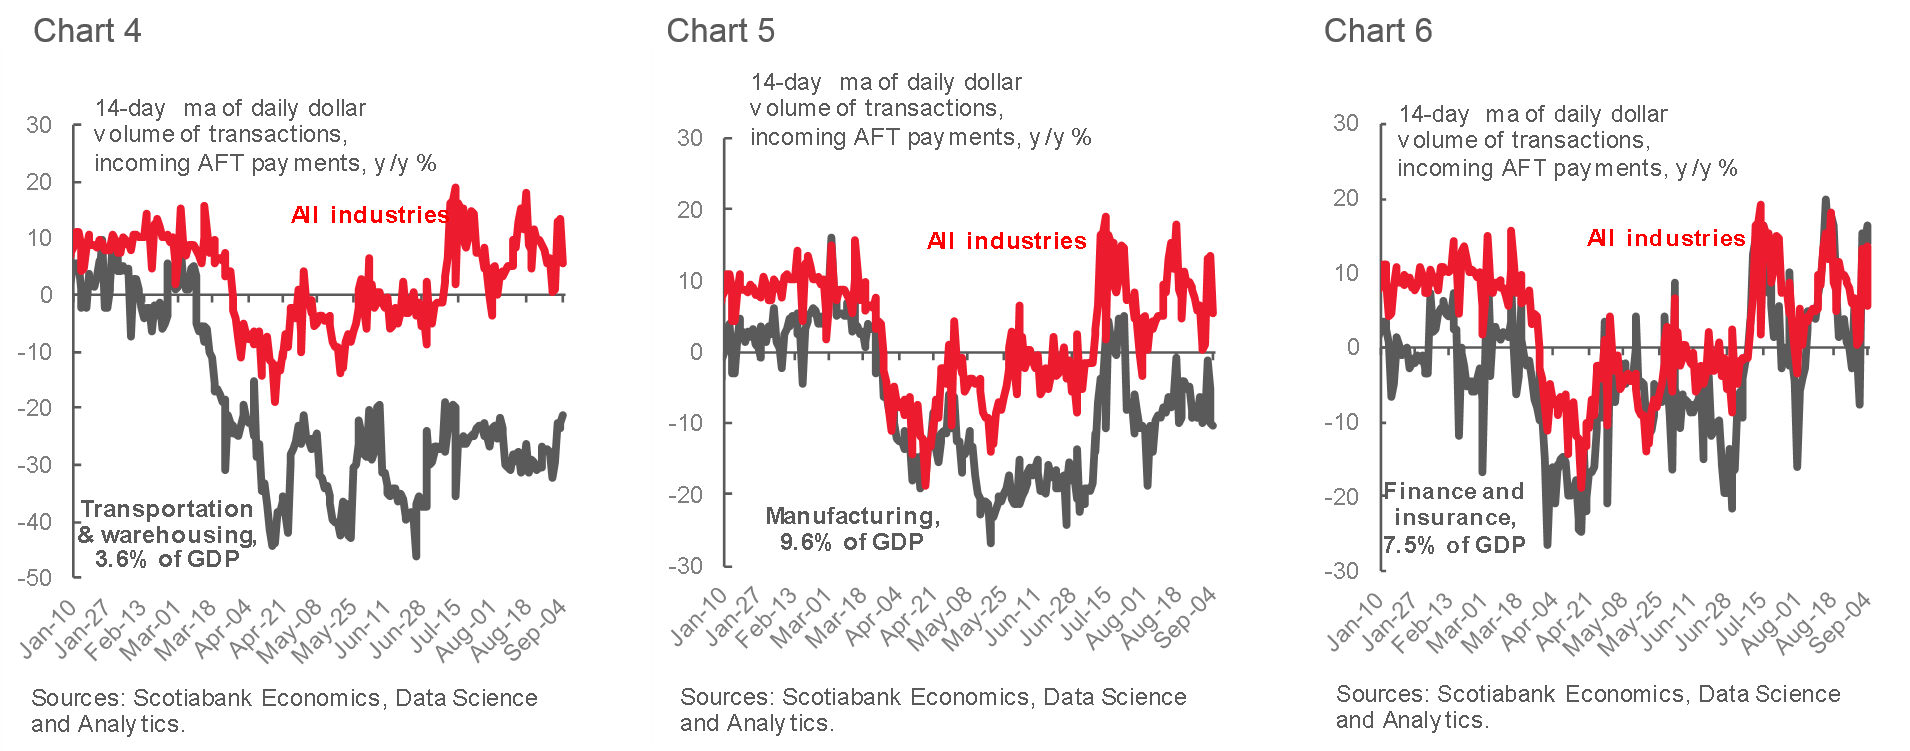
- In particular, payments to manufacturing firms failed to surpass the level of 2019, having come close in mid-August, before falling back more recently (charts 2-6).
- Payments in transportation and warehousing industries continue to run far below last year’s levels.
3. Business Transactions Data: Wholesale Payment Volumes Fully Recovered
3. Business Transactions Data: Manufacturing Slides Back Below 2019 Level
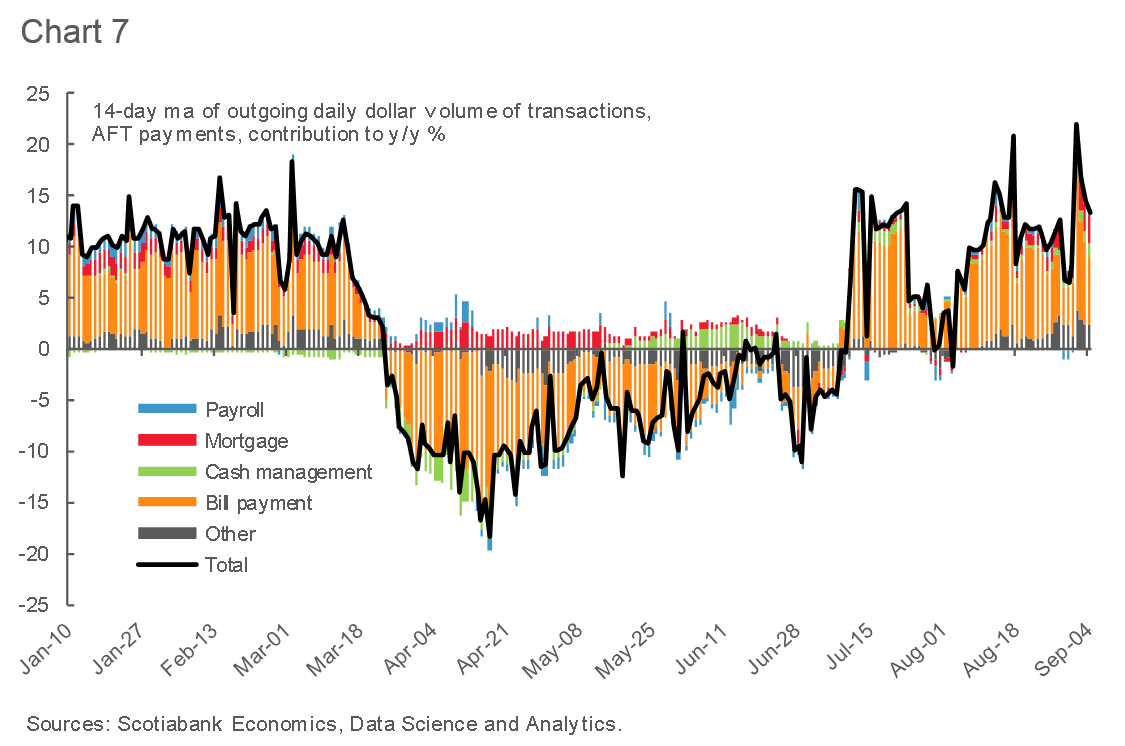
3. Business Transactions Data: Bill Payments Remain High in early September
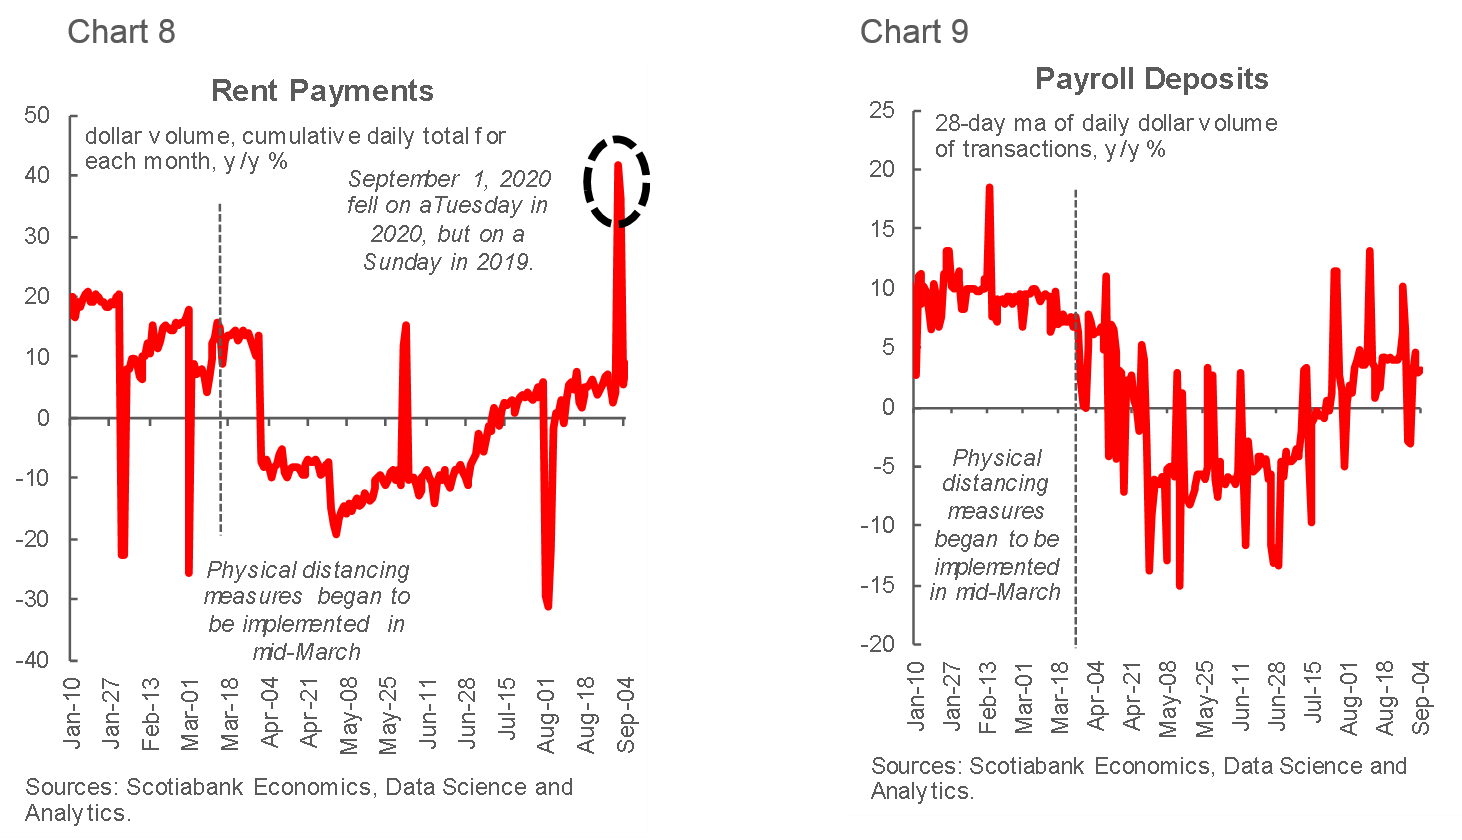
- Outgoing AFT payments remained at elevated levels in early September (Chart 7):
-Payroll deposits, while volatile, have stabilized relative to 2019 levels, suggesting that the pace of job growth has likely slowed in August. (Charts 8 and 9).
3. Business Transactions Data: Rent/Payroll Payments Stabilize
4. Retail Transactions Data: Card Spending Growth Stabilized
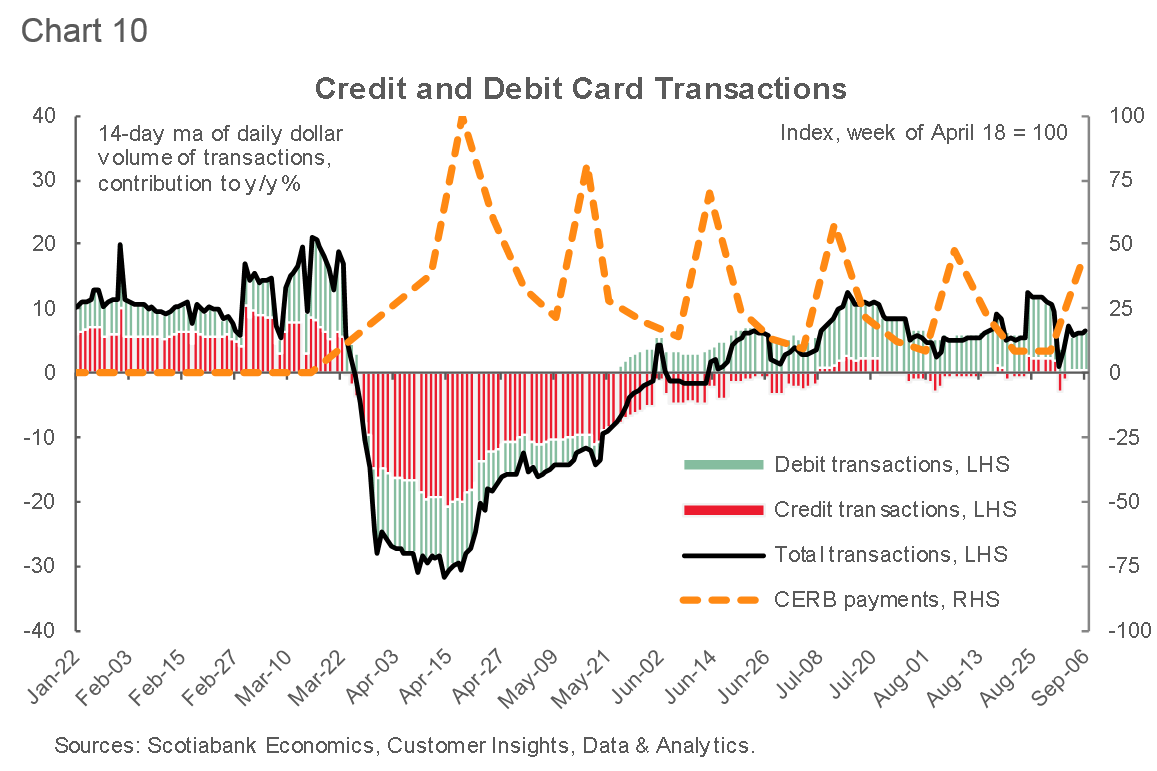
- Consumer transactions, available through September 6th have remained relatively stable compared to last year’s levels (chart 10):
-Most categories of merchants now see spending flattening relative to a year ago.
-Credit card spending, as well as cash usage, as shown by low levels of ABM transactions, continue to lag significantly compared to debit card usage. - The amounts of CERB payments have been gradually coming down since reaching a peak in mid-April, in line with the observed improvement in the labour market in May-July.
4. Retail Transactions Data: Use of Bank Machines Down
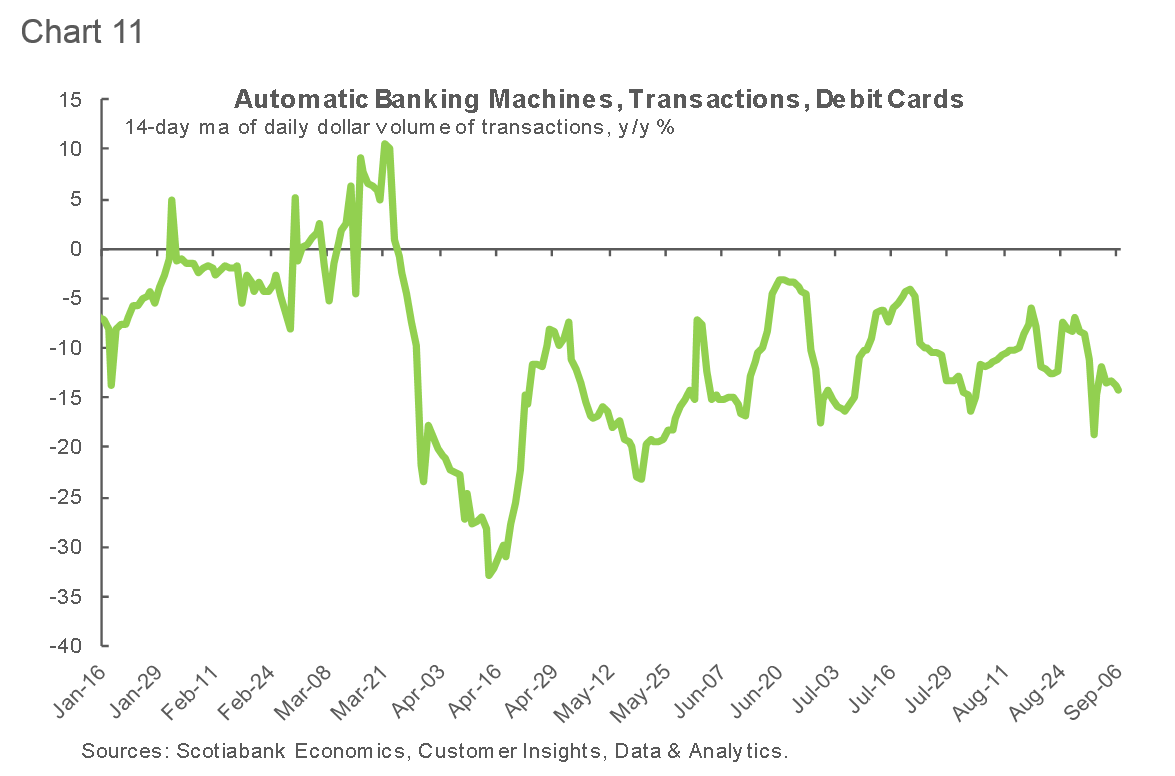
- A measure of declining cash usage, the volume of transactions through automatic banking machines (ABMs) has remained significantly below the level of 2019 with no sign of a turnaround (Chart 11):
-A jump in ABM transactions in mid-March, as demand for cash skyrocketed amid economic uncertainty, gave rise to a deep contraction in April.
-The volume of ABM transactions stagnated far below the level of 2019 for most of the summer.
-The declining use of cash as well as more people working from home is likely the explanation for the lack of recovery in ABM use.
4. Retail Transactions Data: Provinces See Volatile Pattern of Spending in September
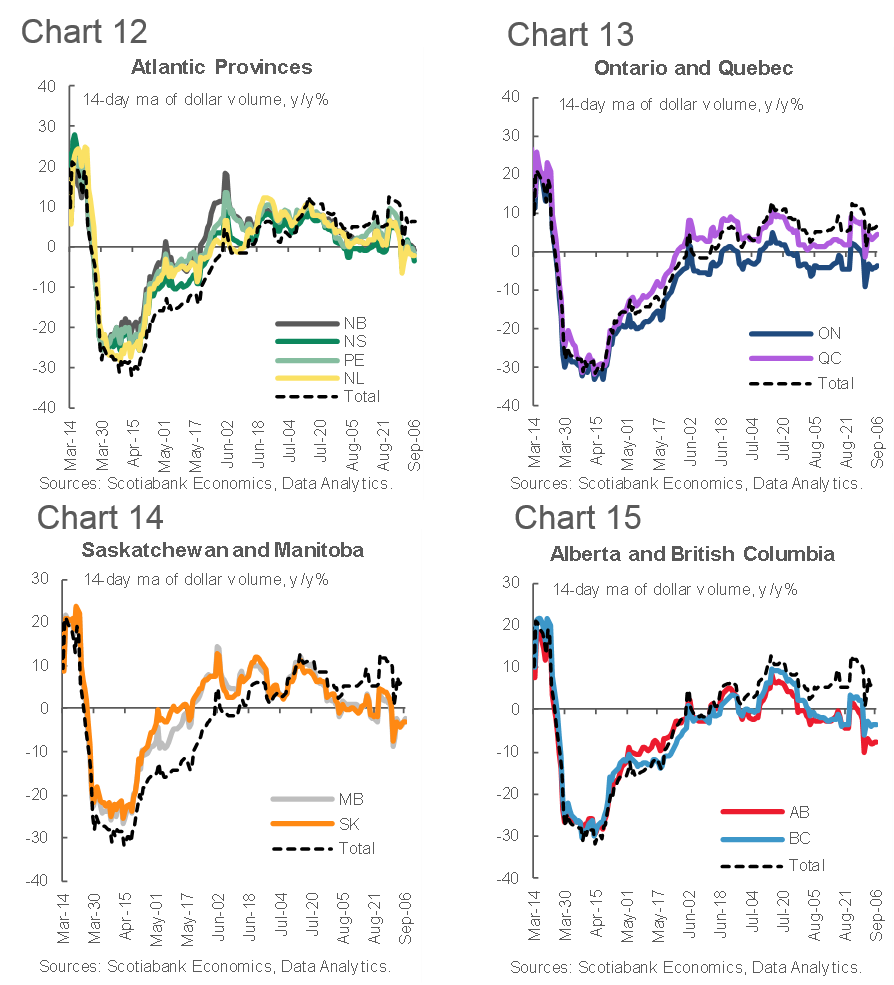
- Province-level data shows a consistent trend across provinces.
- Y/Y transactions growth in Ontario has turned lower in late-August and early September, despite a gradually expanding share of the re-opened economy (Chart 12). Most provinces show a decline since mid-August and the recent pickup in the number of COVID-19 cases could slow the recovery further.
- Note that the share of card transactions not tied to a particular province has been on the rise recently, explaining some of the divergence between the Canada-wide trend and provincial totals.
4. Retail Transactions Data: Card Spending Across Most Categories Stabilizes
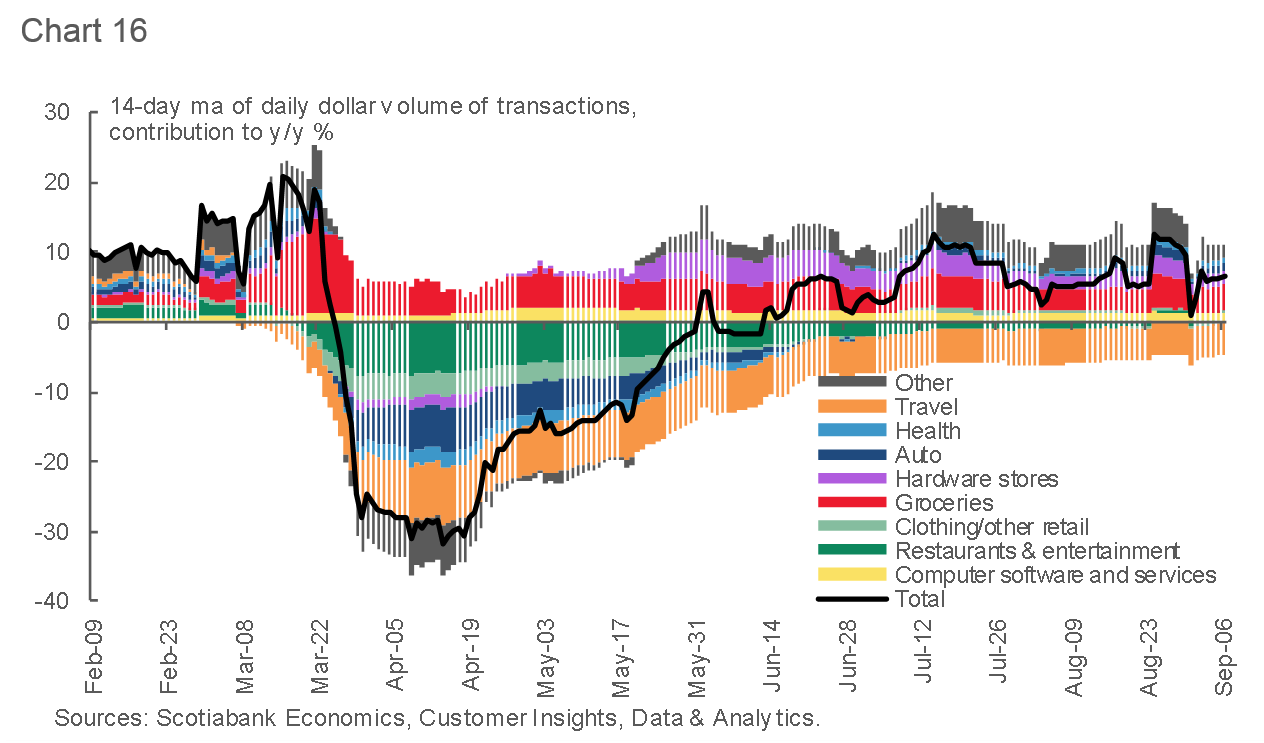
- Throughout the past few months the dynamics and the composition of spending have remained relatively stable (Chart 16):
-Spending on groceries, hardware and computers explains most of the y/y growth, while being partly offset by still-weak travel-related spending.
4. Retail Transactions Data: Travel, Restaurants and Entertainment Spending Stalled
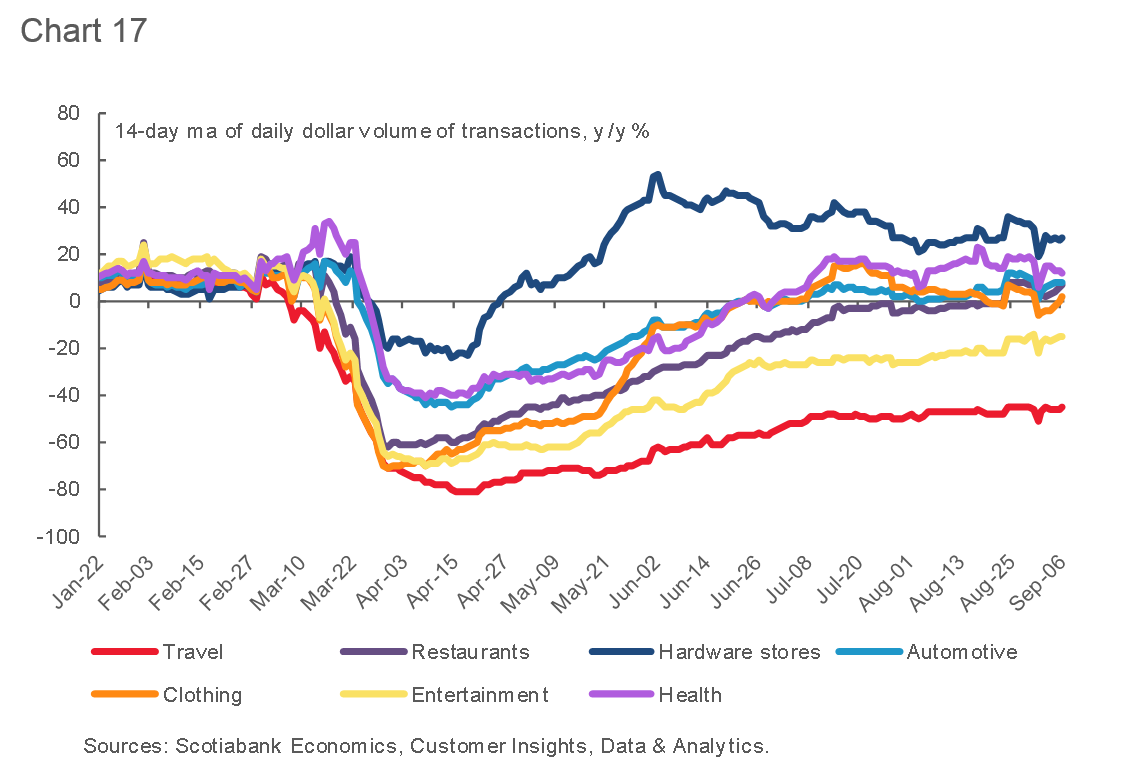
- As August came to an end most merchants had seen card spending stabilize relative to last year’s levels, e (Chart 17):
-Going forward, the continued recovery in the hard-hit areas of the retail sector will depend on the evolution of COVID cases and the successful re-opening of schools across Canada.
-Recently-observed creep up in the number of cases could constrain and even reverse the nascent recovery.
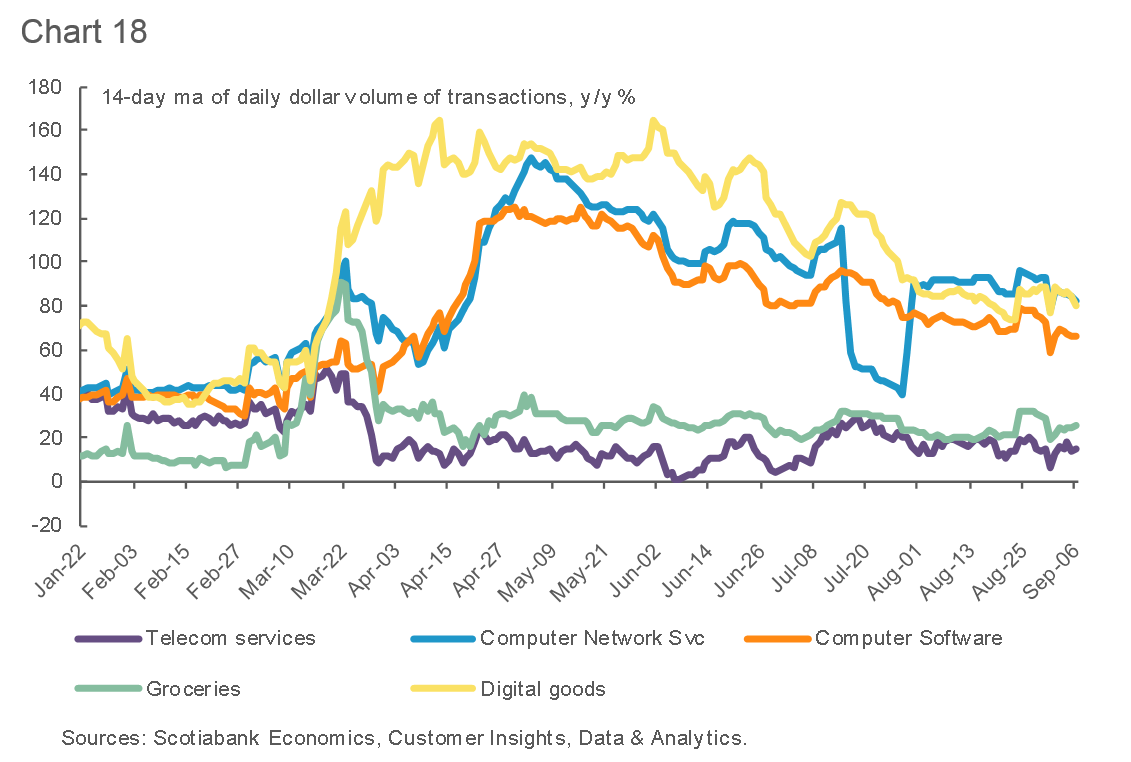
4. Retail Transactions Data: Growth in Digital Spending Trending Down
- Categories that have been outperforming since the start of the pandemic still show strong, albeit declining, growth relative to last year (Chart 18).
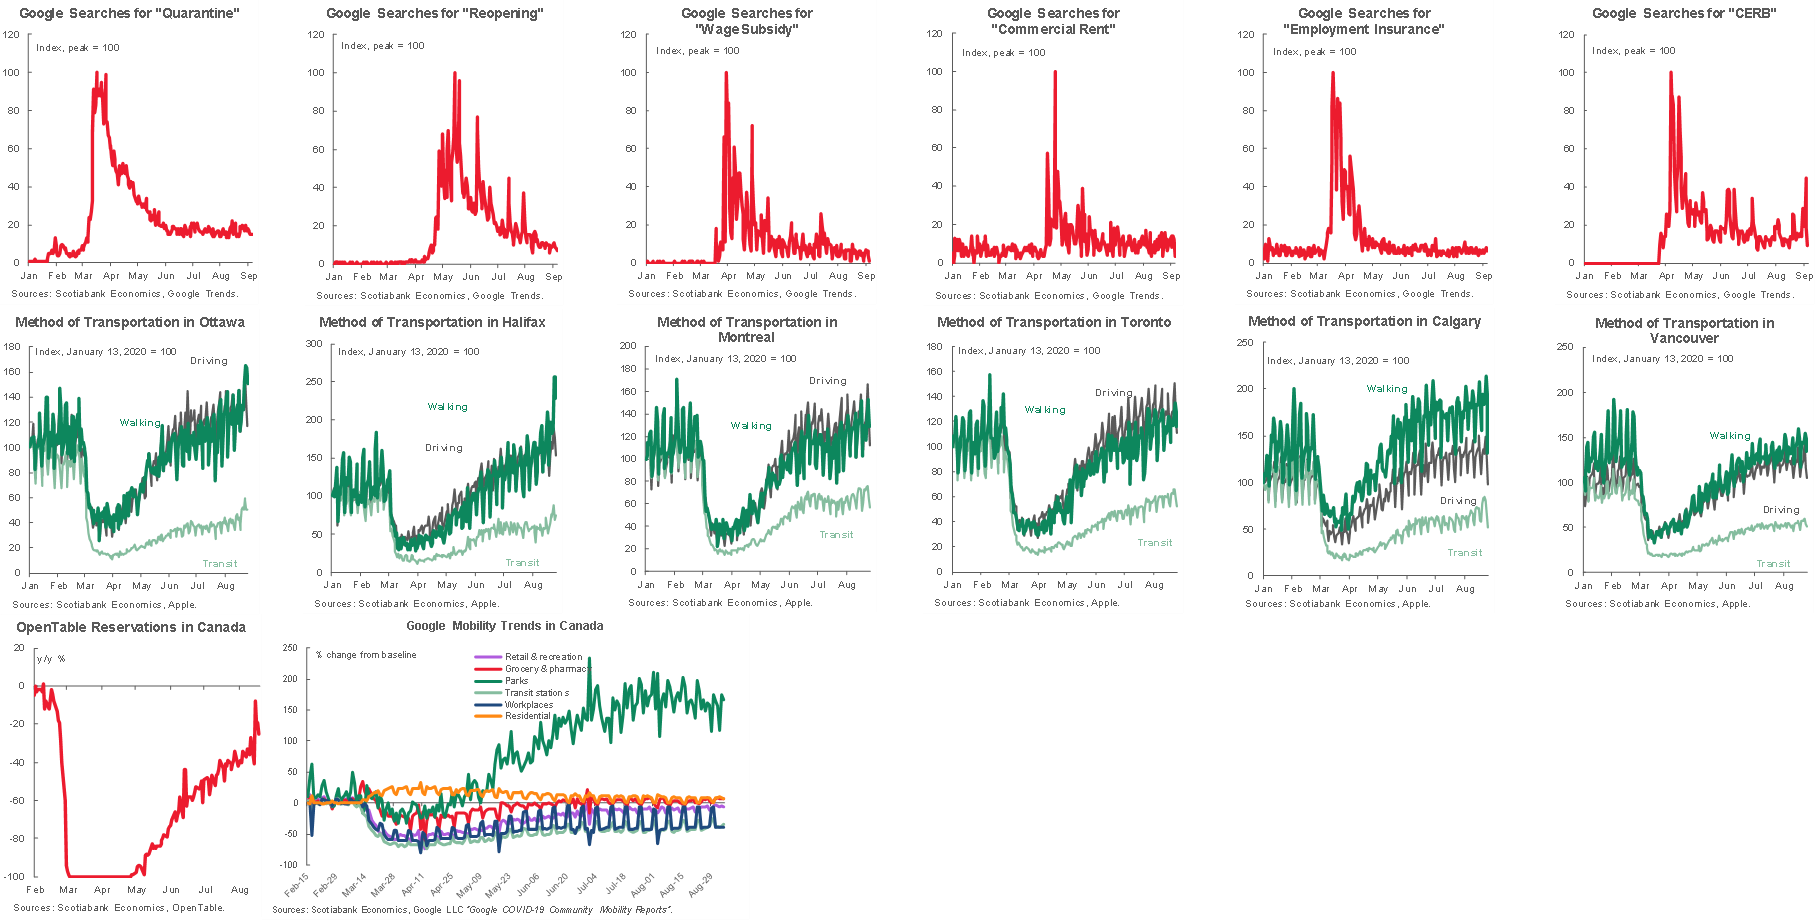
5. Other High-Frequency Indicators Of Activity
Charts 19-32 Google Searches, Various Keywords, Dining and Transportation Data
Nikita Perevalov* (Scotiabank Economics)
Taha Jaffer, Jason Liang (Data Science and Analytics)
Roland Merbis, Artur Motruk (Customer Insights & Analytics)
* Director of Economic Forecasting, 437.775.5137, nikita.perevalov@scotiabank.com
DISCLAIMER
This report has been prepared by Scotiabank Economics as a resource for the clients of Scotiabank. Opinions, estimates and projections contained herein are our own as of the date hereof and are subject to change without notice. The information and opinions contained herein have been compiled or arrived at from sources believed reliable but no representation or warranty, express or implied, is made as to their accuracy or completeness. Neither Scotiabank nor any of its officers, directors, partners, employees or affiliates accepts any liability whatsoever for any direct or consequential loss arising from any use of this report or its contents.
These reports are provided to you for informational purposes only. This report is not, and is not constructed as, an offer to sell or solicitation of any offer to buy any financial instrument, nor shall this report be construed as an opinion as to whether you should enter into any swap or trading strategy involving a swap or any other transaction. The information contained in this report is not intended to be, and does not constitute, a recommendation of a swap or trading strategy involving a swap within the meaning of U.S. Commodity Futures Trading Commission Regulation 23.434 and Appendix A thereto. This material is not intended to be individually tailored to your needs or characteristics and should not be viewed as a “call to action” or suggestion that you enter into a swap or trading strategy involving a swap or any other transaction. Scotiabank may engage in transactions in a manner inconsistent with the views discussed this report and may have positions, or be in the process of acquiring or disposing of positions, referred to in this report.
Scotiabank, its affiliates and any of their respective officers, directors and employees may from time to time take positions in currencies, act as managers, co-managers or underwriters of a public offering or act as principals or agents, deal in, own or act as market makers or advisors, brokers or commercial and/or investment bankers in relation to securities or related derivatives. As a result of these actions, Scotiabank may receive remuneration. All Scotiabank products and services are subject to the terms of applicable agreements and local regulations. Officers, directors and employees of Scotiabank and its affiliates may serve as directors of corporations.
Any securities discussed in this report may not be suitable for all investors. Scotiabank recommends that investors independently evaluate any issuer and security discussed in this report, and consult with any advisors they deem necessary prior to making any investment.
This report and all information, opinions and conclusions contained in it are protected by copyright. This information may not be reproduced without the prior express written consent of Scotiabank.
™ Trademark of The Bank of Nova Scotia. Used under license, where applicable.
Scotiabank, together with “Global Banking and Markets”, is a marketing name for the global corporate and investment banking and capital markets businesses of The Bank of Nova Scotia and certain of its affiliates in the countries where they operate, including, Scotiabanc Inc.; Citadel Hill Advisors L.L.C.; The Bank of Nova Scotia Trust Company of New York; Scotiabank Europe plc; Scotiabank (Ireland) Limited; Scotiabank Inverlat S.A., Institución de Banca Múltiple, Scotia Inverlat Casa de Bolsa S.A. de C.V., Scotia Inverlat Derivados S.A. de C.V. – all members of the Scotiabank group and authorized users of the Scotiabank mark. The Bank of Nova Scotia is incorporated in Canada with limited liability and is authorised and regulated by the Office of the Superintendent of Financial Institutions Canada. The Bank of Nova Scotia is authorised by the UK Prudential Regulation Authority and is subject to regulation by the UK Financial Conduct Authority and limited regulation by the UK Prudential Regulation Authority. Details about the extent of The Bank of Nova Scotia's regulation by the UK Prudential Regulation Authority are available from us on request. Scotiabank Europe plc is authorised by the UK Prudential Regulation Authority and regulated by the UK Financial Conduct Authority and the UK Prudential Regulation Authority.
Scotiabank Inverlat, S.A., Scotia Inverlat Casa de Bolsa, S.A. de C.V., and Scotia Derivados, S.A. de C.V., are each authorized and regulated by the Mexican financial authorities.
Not all products and services are offered in all jurisdictions. Services described are available in jurisdictions where permitted by law.