EXECUTIVE SUMMARY
- This note reviews why 2025 diverged so sharply from expectations, using the October 2024 forecast as a counterfactual, we isolate the forces that actually drove macro outcomes in the U.S. and Canada.
- Two shocks explain most of the surprises: the U.S.-led trade war, which disproportionately hurt Canada through exports, and the AI boom, which lifted growth via financial market gains and strong investment.
- Key lessons for 2026: Tariff elasticities for Canadian exports are likely stronger than we assumed; Canada’s exposure to U.S. AI-driven growth is limited; and AI’s direct impact on U.S. investment appears larger than originally expected. This implies upside risk to the 2026 U.S. outlook but with muted spillovers to Canada.
2025 delivered more macroeconomic surprises than any year since the pandemic. How did these surprises impact the outlook and what lessons, if any, are there for forecasters? Importantly, has the year revealed any gaps in our macroeconometric modelling approach that matter for the 2026 outlook?
Our review shows that, despite the noise, most U.S. and Canadian macro outcomes can be traced back to two dominant forces: the U.S.-led trade war and the associated spike in uncertainty, and the rapid rise of AI, which boosted U.S. investment and equity markets. Some puzzles remain—especially at the GDP component level. We believe that most of the surprises and puzzles are associated with how AI impacted both economies.
2025: EXPECTATIONS VS OUTCOMES
To identify the main forces that shaped 2025, we begin by taking our October 2024 forecast as the counterfactual baseline and layer on the impact of the major shocks observed since then. This baseline is particularly useful because it did not factor in the downside effects of trade policy uncertainty, the introduction of new tariffs, or most of the sharp increase in AI and the associated equity market surge.
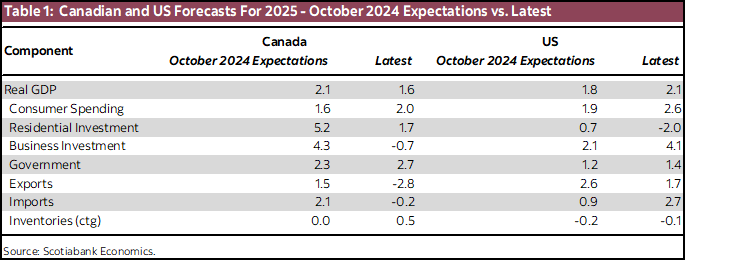
In our October 2024 forecast, we expected the Canadian economy to gain momentum in 2025 and expand by 2.1%, while U.S. growth was projected to moderate to 1.8%. In Canada, most of the anticipated strength reflected the impact of rate cuts supporting household spending. In the United States, the expected slowdown was driven largely by softer consumption and a sharp deceleration in business investment. We had projected U.S. business investment growth to be cut roughly in half, averaging about 2% in 2025.
Instead, Canada’s economy underperformed those expectations. We now expect growth to average 1.6%, largely due to a steep decline in exports early in the year tied to rising trade tensions. Residential and business investment also came in weaker than anticipated (see table 1). In contrast, the U.S. economy outperformed our earlier projections and is now expected to grow by 2.1%. This stronger-than-expected performance was supported by resilient household spending and particularly robust business investment, which is now projected to average about 4%—nearly double our initial forecast.
Our decomposition suggests that the bulk of these divergences can be explained by two dominant forces:
(1) the U.S. led trade war and its associated uncertainty effects, and
(2) the AI boom and its powerful transmission through financial markets.
We unpack each below.
The Trade Shock
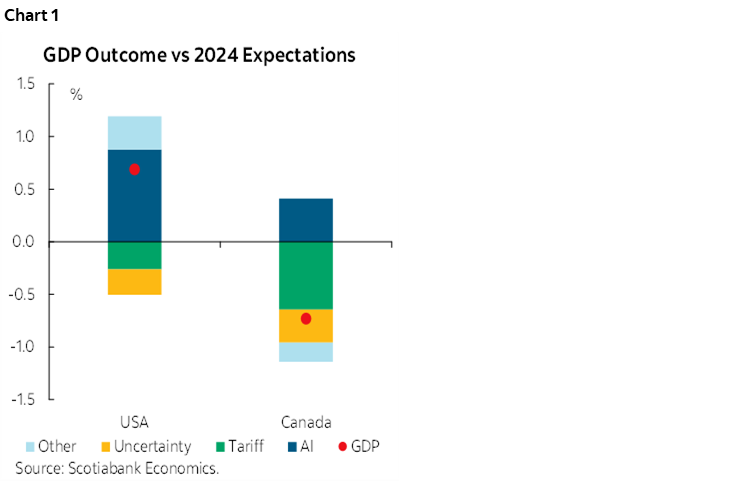
The increase in U.S. tariffs was the single most important negative force of 2025, particularly for Canada. Using the realized increase in effective tariff rates, our macro model estimates that the trade war reduced the level of Canadian GDP by approximately 0.6 relative to the pre–trade war baseline. Most of the impact came through their direct effects on exports.
The direct tariff impact on the U.S. economy was substantially smaller than Canada, since it is much less trade dependent, at -0.3%, operating through higher prices and the reduced household purchasing power. The drag on Canada was much more pronounced due to its concentration in tariff-sensitive sectors, and its greater dependence on the components of U.S. demand that are most impacted by tariffs.
Trade-policy uncertainty added an additional layer of weakness. Based on our empirical estimates, the rise in uncertainty reduced the level of GDP by -0.3% in Canada and -0.2% in the U.S., mainly through softer consumption and weaker business investment.
The AI Shock
Offsetting these negative pressures was the rapid acceleration of the AI boom, which emerged as one of the most powerful positive macro forces of the year. The key transmission channel was mainly financial: AI-related valuations surged, lifting equity markets and easing financial conditions. According to our model, this wealth effect contributed meaningfully to U.S. economic activity mostly through household spending and business investment. This is in line with our previous work that showed how important the equity market boom was in explaining the recent resilience of the U.S. economy, and in particular the strength of business investment.
In addition, direct AI-driven capital expenditure strengthened through the year, providing an important additional boost to U.S. business investment. Canada benefited from the global AI optimism, but the magnitude was considerably smaller owing to the country’s relatively modest domestic tech sector.
Possible other factors
Other factors were also in play over this period, though we judge them to be second order, at least for 2025. A notable example is fiscal policy in Canada: we had expected the federal deficits to be $39B, but it rose to $78B in the latest forecast. While part of this reflects weaker economic activity, there was nonetheless more fiscal support than expected. That said, our assessment is that this additional stimulus does not materially affect the 2025 average, but it will have a more noticeable impact in 2026.
Population growth in 2025, meanwhile, evolved broadly in line with our assumptions.
PUTTING IT ALL TOGETHER
When we layer these two shocks—trade and AI—onto our October 2024 baseline, we can replicate most of the realized GDP and inflation outcomes in both countries. We also find that both the Federal Reserve and the Bank of Canada cut slightly more than suggested by our model, consistent with our narrative that central banks chose to provide insurance.
Chart 1 illustrates how these forces played out relative to the 2024 forecast.
Remaining Puzzles and Lessons
After accounting for the two dominant shocks, some discrepancies remain, particularly at the component level. These residual puzzles matter for the outlook, as they point to forces our models may still be underestimating.
Key discrepancies include:
- Canadian exports underperforming while consumption overperforming. The depth of the export decline was larger than what the tariff effect alone can explain. Consumption showed the opposite picture; performing better than estimated from the uncertainty and tariff shock.
- U.S. domestic demand proved surprisingly resilient. Even after controlling for the equity market surge, both households and firms continued to spend at a pace inconsistent with the expected drag from heightened uncertainty and trade policy.
Together, these discrepancies highlight three key lessons:
1) Tariff Effects on Canada
While the estimated tariff impact on overall Canadian GDP seems reasonable, the internal composition may be off. The data suggest a smaller hit to consumption and a larger drag on exports than our model implies. We interpret this to mean that the elasticity of Canadian exports to tariff changes is higher than assumed, and confidence effects were less important than assumed.
This asymmetry should inform how we calibrate future tariff shocks in the model.
2) U.S. Growth Composition Matters for Canada
The underperformance of Canadian exports likely reflects a mismatch between the Canadian export structure and the drivers of U.S. growth in 2025. U.S. growth was powered disproportionately by AI-related investment, a segment where Canadian exporters have limited exposure. As a result, even though the U.S. economy outperformed, the spillovers to Canada were muted.
This means that if AI-driven investment remains a primary driver of U.S. activity in 2026, Canada’s export response is likely to remain subdued, even in the face of strong U.S. growth. This likely accounts for part of the Bank of Canada’s divergence between expected U.S. growth in 2026 and their forecast for Canada.
3) AI’s Direct Effect on the U.S. Economy Appears Stronger Than Modeled
Finally, the data suggest that AI had a larger direct impact on U.S. activity than our model could capture. The excess strength in U.S. domestic demand, beyond what the wealth channel explains, likely reflects AI-related investment that is not fully captured by our model. We draw this conclusion in part because AI investment has had only a modest direct effect on the Canadian economy. If other sources of strength had been at play, they would likely have also lifted Canadian growth; instead, Canada underperformed. The direct impact of AI therefore remains the most consistent explanation for both the U.S. outperformance and Canada’s relative weakness.
If these dynamics continue, they imply a more favourable U.S. growth trajectory in 2026, especially if AI-driven capex stays elevated or accelerates further.
DISCLAIMER
This report has been prepared by Scotiabank Economics as a resource for the clients of Scotiabank. Opinions, estimates and projections contained herein are our own as of the date hereof and are subject to change without notice. The information and opinions contained herein have been compiled or arrived at from sources believed reliable but no representation or warranty, express or implied, is made as to their accuracy or completeness. Neither Scotiabank nor any of its officers, directors, partners, employees or affiliates accepts any liability whatsoever for any direct or consequential loss arising from any use of this report or its contents.
These reports are provided to you for informational purposes only. This report is not, and is not constructed as, an offer to sell or solicitation of any offer to buy any financial instrument, nor shall this report be construed as an opinion as to whether you should enter into any swap or trading strategy involving a swap or any other transaction. The information contained in this report is not intended to be, and does not constitute, a recommendation of a swap or trading strategy involving a swap within the meaning of U.S. Commodity Futures Trading Commission Regulation 23.434 and Appendix A thereto. This material is not intended to be individually tailored to your needs or characteristics and should not be viewed as a “call to action” or suggestion that you enter into a swap or trading strategy involving a swap or any other transaction. Scotiabank may engage in transactions in a manner inconsistent with the views discussed this report and may have positions, or be in the process of acquiring or disposing of positions, referred to in this report.
Scotiabank, its affiliates and any of their respective officers, directors and employees may from time to time take positions in currencies, act as managers, co-managers or underwriters of a public offering or act as principals or agents, deal in, own or act as market makers or advisors, brokers or commercial and/or investment bankers in relation to securities or related derivatives. As a result of these actions, Scotiabank may receive remuneration. All Scotiabank products and services are subject to the terms of applicable agreements and local regulations. Officers, directors and employees of Scotiabank and its affiliates may serve as directors of corporations.
Any securities discussed in this report may not be suitable for all investors. Scotiabank recommends that investors independently evaluate any issuer and security discussed in this report, and consult with any advisors they deem necessary prior to making any investment.
This report and all information, opinions and conclusions contained in it are protected by copyright. This information may not be reproduced without the prior express written consent of Scotiabank.
™ Trademark of The Bank of Nova Scotia. Used under license, where applicable.
Scotiabank, together with “Global Banking and Markets”, is a marketing name for the global corporate and investment banking and capital markets businesses of The Bank of Nova Scotia and certain of its affiliates in the countries where they operate, including; Scotiabank Europe plc; Scotiabank (Ireland) Designated Activity Company; Scotiabank Inverlat S.A., Institución de Banca Múltiple, Grupo Financiero Scotiabank Inverlat, Scotia Inverlat Casa de Bolsa, S.A. de C.V., Grupo Financiero Scotiabank Inverlat, Scotia Inverlat Derivados S.A. de C.V. – all members of the Scotiabank group and authorized users of the Scotiabank mark. The Bank of Nova Scotia is incorporated in Canada with limited liability and is authorised and regulated by the Office of the Superintendent of Financial Institutions Canada. The Bank of Nova Scotia is authorized by the UK Prudential Regulation Authority and is subject to regulation by the UK Financial Conduct Authority and limited regulation by the UK Prudential Regulation Authority. Details about the extent of The Bank of Nova Scotia's regulation by the UK Prudential Regulation Authority are available from us on request. Scotiabank Europe plc is authorized by the UK Prudential Regulation Authority and regulated by the UK Financial Conduct Authority and the UK Prudential Regulation Authority.
Scotiabank Inverlat, S.A., Scotia Inverlat Casa de Bolsa, S.A. de C.V, Grupo Financiero Scotiabank Inverlat, and Scotia Inverlat Derivados, S.A. de C.V., are each authorized and regulated by the Mexican financial authorities.
Not all products and services are offered in all jurisdictions. Services described are available in jurisdictions where permitted by law.