PUBLIC SERVICES SUFFER FROM A POOR PRODUCTIVITY PERFORMANCE
- Canada’s labour productivity performance has been anemic over last decade, showing a marked decline in its average annual growth from its pre-2015 performance. The recent rise in global trade tensions triggered by the United States increased the focus on Canada’s productivity since its improvement is key to mitigate the negative economic impacts from higher tariffs.
- Another less-mentioned victim from a poor productivity performance is the quality and quantity of public services and infrastructures provided by various levels of governments to their citizens and businesses. This is a result of a slower increase in the tax base, limiting the ability to finance public services, or alternatively to lower taxes for a given level of expenditure.
- Using our macro-econometric model of the Canadian (and U.S.) economy, we develop a counterfactual (synthetic) scenario assuming Canada’s pre-2015 business sector productivity performance is kept unchanged in the subsequent decade.
- From this counterfactual scenario, we estimate that the marked weakening in productivity growth after 2014 deprived federal and provincial/territorial governments of about $77 billion in revenues in 2024, and $340.2 billion (cumulative) since 2015. These additional revenues could have been used to increase expenditures on programs and infrastructures, reduce tax burdens for individuals and businesses, or any combination of these options.
- This estimated impact on public finances is significant. To illustrate its magnitude, assume that governments’ revenue shares of expenditure items in our counterfactual scenario would have been those effectively observed. From our estimates, this implies that for fiscal year ending with March 2026, planned ministry of health expenditures could have been higher by near $7.2B (billion) for Ontario, $5.8B for Quebec, $3.1B for B.C. and $2.1B for Alberta. If we assume expenditure shares remain unchanged and the savings are passed onto taxpayers, the average personal income tax bill would be $1,800 lower.
- This weak productivity performance post-2014 also negatively impacted Canadian households’ purchasing power through reduced growth in their income and, to a lesser extent, higher consumer prices. We estimate this loss in purchasing power at very close to $10,000 for a household that was earning the average income in 2024.
CANADA’S PRODUCTIVITY PERFORMANCE NEEDS A PROTEIN BOOST
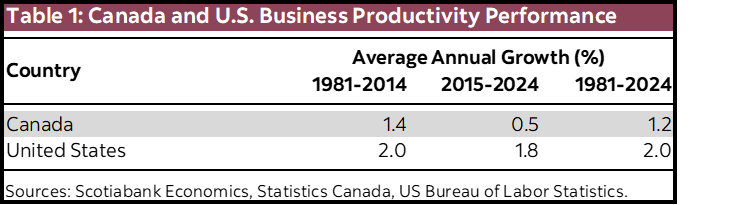
Canada’s business sector labour productivity growth was weak over the period 2015–2024, averaging only 0.5% annually, much weaker than the 1.4% average annual growth rate posted from 1981 to 2014 (table 1). Increased trade tensions triggered by the United States have put the spotlight on Canada’s weak productivity performance given, as mentioned by economists and policymakers, its improvement is key to mitigate the negative impacts from increased tariffs on Canada’s exports and economic activity. More broadly, improving productivity contributes to raise standards of living for Canadians by lifting their purchasing power through higher wages and lowering cost of living.
A less frequently mentioned benefit from improved productivity, but that Canadians value dearly as key for their living standards, is its positive impact on public services and infrastructures and/or lower effective tax rates. A weak productivity performance constrains the size of the economy and of the tax base, therefore depriving governments from revenues to finance these expenditures and public debt charges. Improving the productivity performance would allow governments to raise more revenues to finance health, education, other public services/programs, and infrastructures. And this could be achieved with no increase—or even a reduction—in tax burdens for individuals and businesses. Alternatively, a higher tax base could allow for lower tax rates for any given spending level. This beneficial fiscal impact, which is the topic of this report, surely resonates well with all Canadians, thus information about its magnitude should help boost public support for much-needed policy measures to improve Canada’s productivity performance.
In this study, we use our macro-econometric model of the U.S. and Canadian economies to estimate the impact on fiscal indicators from Canada’s weak business productivity performance over last decade. Our focus is on assessing how key fiscal indicators at federal and consolidated provincial/territorial levels would have performed without this weakening in productivity after 2014.
CANADA’S PRODUCTIVITY PERFORMANCE
Labour productivity reflects the quantity of goods/services produced per hour worked. An increase in labour productivity means a higher level of production is achieved with the same number of hours worked. Productivity rises with technological progress and its adoption, improving skills for management and workers through better education/training for the current and future workforce, more machinery/equipment/software purchased and used. A rise in productivity for a firm reduces its production costs and the selling price of its products. It creates a strong incentive for the firm to raise its production to increase market share and profits, thereby increasing labour demand and real wages. The nation’s potential economic activity rises if this productivity improvement is widely spread, either because a significant share of industries is living this productivity boost or because it occurs in key industries with strong synergy with many others.
There are several reasons for Canada’s productivity slowdown, ranging from the need to re-allocate resources following economic shocks—like the Covid-19 pandemic or the negative oil price shock in 2014 following rising U.S. shale oil production—to policies that focused on other priorities and less prone to spur productive capital. In this report, we leave aside a detailed investigation of why productivity growth significantly weakened in the last decade and focus on its impact on public finances.
Table 1 reports descriptive statistics for business sector’s labour productivity growth in Canada and U.S. over the period 1981–2024, as well as for sub-periods 1981–2014 and 2015–2024. For the period 1981–2014, we see that average annual productivity growth in the business sector has been 0.6 percentage point (p.p.) weaker in Canada than in the U.S. This negative differential more than doubled over the period 2015–2024, increasing to 1.3 p.p. We also notice that Canada’s average annual productivity growth for its business sector was divided by almost 3 from pre- to post-2015 sub-periods, declining from 1.4% to 0.5%. U.S. businesses’ average productivity growth also declined between these two sub-periods but by only 0.2 p.p., from 2 to 1.8% per year.
ECONOMIC AND FISCAL IMPACTS FROM CANADA’S POOR PRODUCTIVITY PERFORMANCE OVER LAST DECADE
We now report our model estimates for the impact on key economic and fiscal indicators—mostly federal and consolidated provincial/territorial—from the deterioration in Canada’s productivity performance since 2015. For this purpose, we built a counterfactual scenario in which we extrapolate the pre-2015 business productivity performance over the period 2015–2024 and estimate how key economic and fiscal indicators would have performed in this synthetic scenario. For a given indicator in this scenario, the deviation of its profile from the observed one—from published data—provides the estimated impact from the marked deterioration in productivity growth since 2015.
A key assumption in our modelling framework is that governments—federal and consolidated provincial/territorial—have a desired path for their debt-to-GDP ratio and are adjusting taxes and expenditures to achieve this objective in the long-term. Taxes and expenditures also adjust in the near- to medium-term to reflect the automatic stabilizing feature of fiscal policy in Canada. These objectives and features of fiscal policy are kept unchanged in our counterfactual scenario. Among these is the assumption that the actual share of tax revenues allocated to each expenditure item would have been similar in this counterfactual scenario. We agree that higher revenues might have led governments to change these expenditure shares, but our assumption is nevertheless helpful for a ‘what if’ illustration of the potential impact from weak productivity growth on key government expenditures like health, education and infrastructures.
ECONOMIC IMPACTS
Table 2 (Panel A) shows the deviations (in % and dollars) of Canada’s real and nominal Gross Domestic Product—or GDP—in our counterfactual scenario from their observed level in 2024. The former reflects the cost from the weak productivity performance in terms of foregone economic activity while the latter provides this cost in terms of the reduction in the tax base.
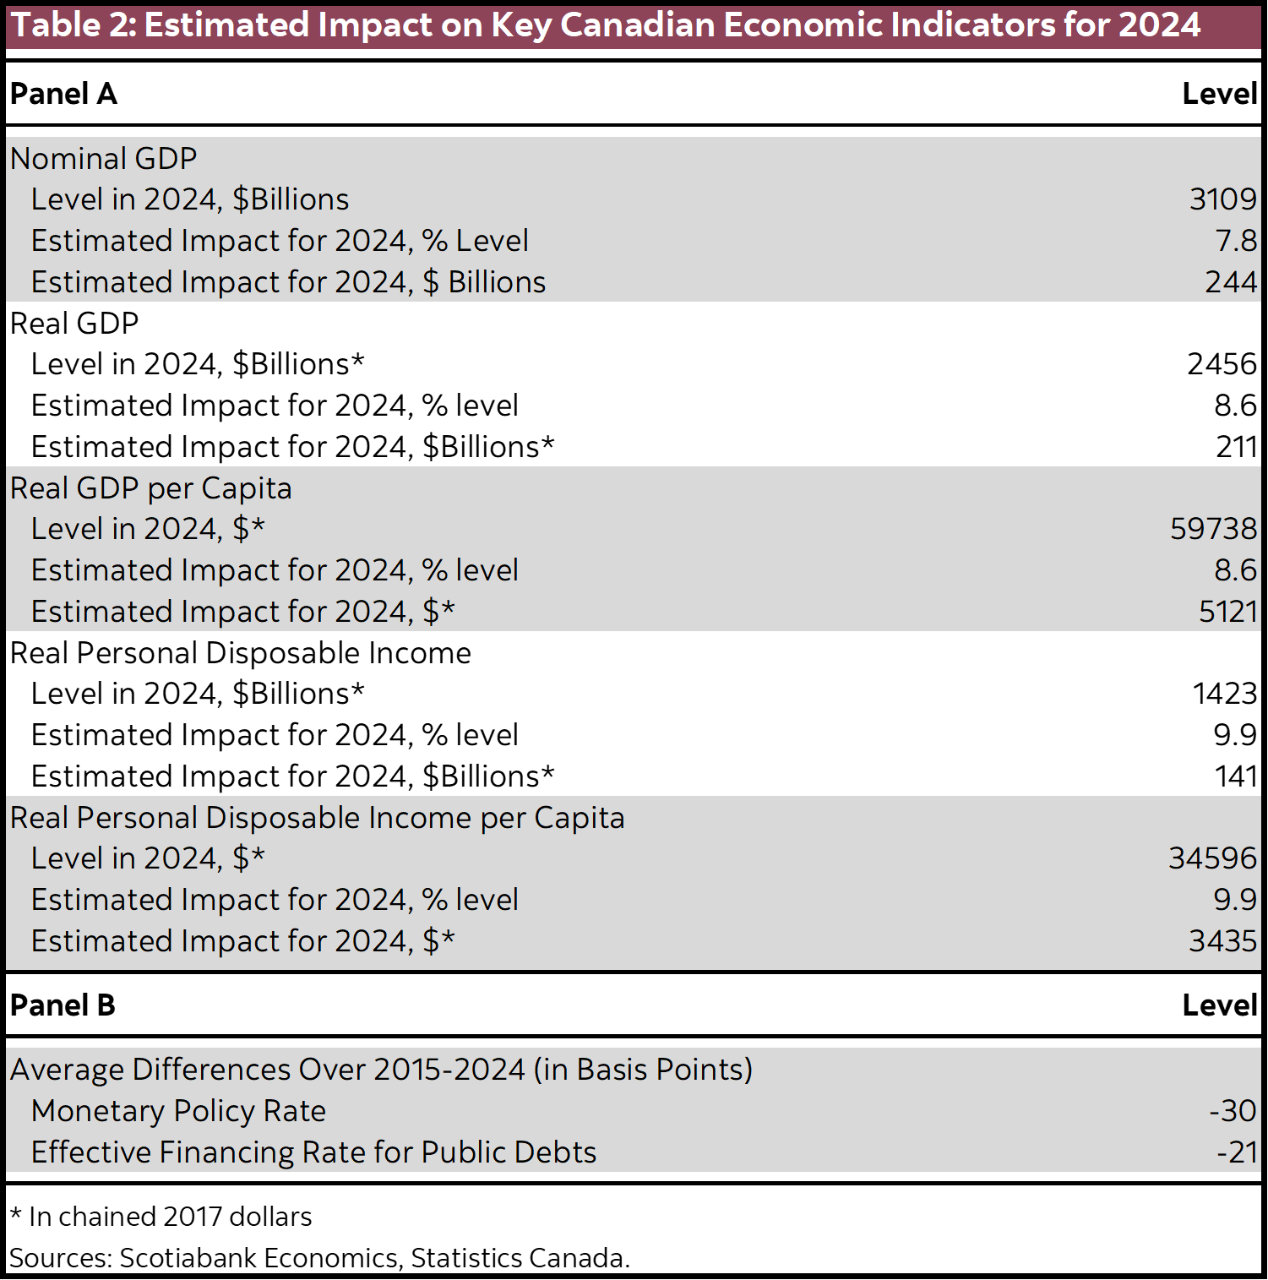
Statistics Canada estimates the country’s real GDP in 2024 at $2,456 billion (in chained 2017 dollars). From our estimates, this figure would have been lifted by $211 billion to about $2,667 billion—an 8.6% increase—if Canada’s productivity had not weakened after 2014. This lifts the 2024 level of GDP per capita from just above $59,700 to nearly $65,000. The estimated economy-wide dollar impact is material, being equivalent to over 40% of Quebec’s real GDP in 2024.
Table 2 also shows deviations between the counterfactual scenario and published data for real personal disposable income for the entire economy and per capita. This income indicator is net of taxes but includes government transfers to individuals. The difference with published data essentially reflects our model estimate for the loss in personal income’s purchasing power from the weak productivity performance, estimated at nearly 10% in 2024, or $3,435 on a per capita basis. Also, during that year, the average disposable income per household was $100,702 according to Statistics Canada. Applying this estimated rise in purchasing power from a better productivity performance would lift this per household income to $110,671. Thus, we estimate the cost from the weak productivity performance in the last decade in terms of foregone purchasing power in 2024 at $9,969 for a household earning the average income.
From table 2 again, Canada’s fiscal base, as measured by nominal GDP, would have been 7.8% higher in 2024 —or about $244 billion—if productivity growth had not weakened post-2014. This percent level difference is a bit less than for real GDP because of downward pressures on production costs and prices that would have resulted from a stronger productivity performance.1
The estimated impact on the Bank of Canada’s policy rate is also shown in table 2 (Panel B). A better-than-observed productivity performance after 2014 would have exerted downward pressures on production costs and inflation from the increase in Canada’s potential GDP as explained above. Given the Bank of Canada’s inflation-targeting objective since the early 1990s, these pressures would have been mostly offset with a lower-than-observed profile for the monetary policy rate to reduce the economic slack generated by higher potential GDP. We estimate this average difference on the policy rate at 30 basis points (negative) over the 2015–2024 period. We also estimate that the average effective financing rate for government debts would have been 21 basis points lower over this period.
FISCAL IMPACTS
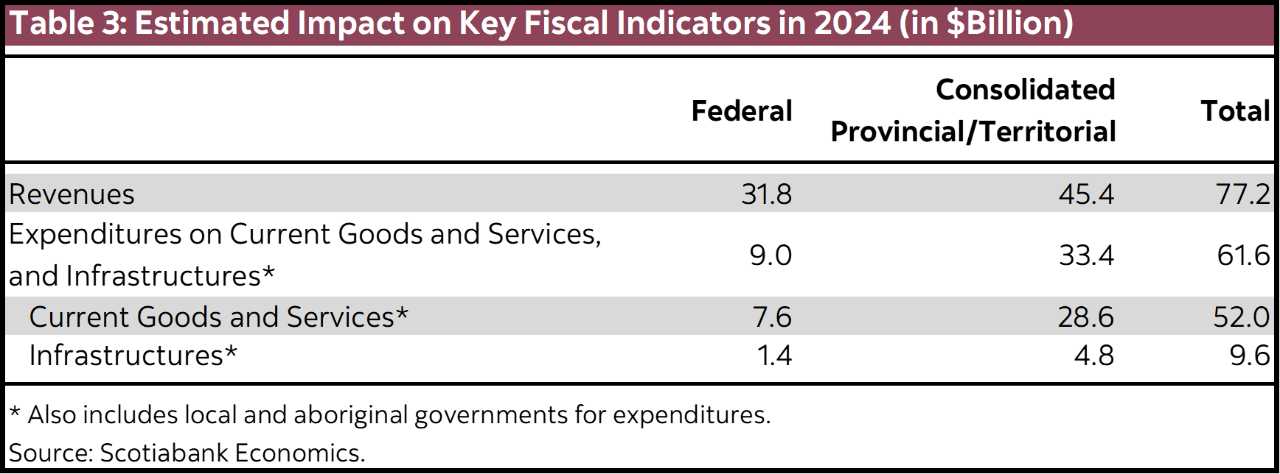
Table 3 shows the impact on revenues (from all sources) collected by the federal and provincial/territorial (consolidated) governments from the weak post-2014 productivity performance. For the federal government, the amount of foregone revenues for 2024 is estimated at $31.8 billion and at $45.4 billion for the consolidated provincial/territorial government, or nearly 6.6% of their collected revenues.2 More impressive is the estimated cumulative loss of income for both levels of government over the period 2015–2024, which amounts to about $340.2 billion.
Our modelling framework and assumptions on objectives and behaviour of fiscal authorities in Canada allow us to illustrate the potential impact on key expenditure items from the weak productivity performance post-2014. Increased revenues in this counterfactual scenario are putting significant downward pressures on public debt burdens and generate a significant pool of additional resources for governments to use. Given their assumed long-term debt-to-GDP ratio objective, governments react by increasing expenditures on goods, services, infrastructures and transfers. Essentially, a larger tax base from improved productivity allows for higher public debt levels while leaving budgetary balances and debt burdens mostly unchanged relative to the (larger) size of the economy. And it also leaves the GDP share of federal, provincial/territorial fiscal revenues essentially unchanged. Hence, these additional revenues from the larger tax base would have allowed governments to spend more on infrastructures and current goods and services—the latter including programs like health and education—while keeping unchanged, or even reducing, the tax burden on individuals and businesses.
Table 3 shows the impact on key expenditure aggregates for all levels of government in Canada3, and for each of the federal and consolidated provincial/territorial governments. Key results under our above-mentioned assumptions are that, if productivity performance had stayed unchanged in the post-2014 period, the federal government would have been able to spend an additional $9 billion in 2024 on current goods/services and infrastructures while this figure is $33.4 billion for the consolidated provincial/territorial government. Table 3 also shows that this better productivity performance would have generated an additional $9.6 billion spent on public infrastructures in 2024 from all levels of governments.
These estimates are material. To illustrate, suppose the estimated percent expenditure increase on current goods and services for the consolidated provincial/territorial government applies to all provinces and expenditure items. This counterfactual scenario would imply for fiscal year ending in March 20264, additional funding for ministry of health of $7.2B for Ontario, $5.8B for Quebec, $3.1B for B.C. and $2.1B for Alberta. Similar estimates for ministry of education expenditures are respectively $ 3.8B, $2.1B, and $0.9B for both B.C. and Alberta. These compare with projected figures in their most recent fiscal update of $82.2B, $65.5B, $35.1B, $24B for ministries of health for these respective provinces. Similar projected expenditures for ministries of education were respectively $42.7B, $23.5B, $9.8B and $10.4B. Our estimated expenditure impacts are based on assumptions we made to illustrate the consequences from the observed weakening in Canada’s productivity performance during last decade. As mentioned, if they had materialized, these additional revenues could have led governments to adopt a different expenditure increase/tax reduction mix in line with their own priorities. For instance, to further illustrate the magnitude of potential benefits from productivity improvement, we can assume that the full estimated amount of these estimated public expenditures ($61.6 B in table 3) could have instead been used to reduce the tax burden of individuals. This option would have lowered the 2024 tax bill of a working-age Canadian (15 and over) by nearly $1,800, therefore providing additional purchasing power to the positive effects from higher productivity on personal disposable income mentioned earlier. Hence, multiple combinations of expenditure increase, and tax reduction scenarios would have been possible for governments in allocating these extra revenues. But the key insight from our assessment is that the poor productivity performance deprived governments in Canada from a significant amount or revenues, and this likely impacted the quantity and quality of public services and programs provided to their citizens along with taxes paid by Canadians.
It is therefore important that governments implement policies to promote productivity, including investing in public infrastructures and adopting fiscal incentives to stimulate private investment in R&D and public capital. In its latest budget, the federal government announced several measures consistent with productivity improvement. This is a much-needed step in the right direction to improve productivity—and raise the future tax base—and we hope other levels of government will follow in this direction.
1 As a reminder, nominal GDP is the product of real (volume) GDP and its price (the GDP deflator).
2 Unless stated otherwise, fiscal indicators in this study are reported on a national account basis, hence on a calendar—not fiscal—year. See Statistics Canada’s Table 36-10-0477 for reference.
3 Also including local and aboriginal governments.
4 These figures are based on latest provincial fiscal/economic updates. These estimated figures assume this stronger productivity performance is continues to March 2026.
DISCLAIMER
This report has been prepared by Scotiabank Economics as a resource for the clients of Scotiabank. Opinions, estimates and projections contained herein are our own as of the date hereof and are subject to change without notice. The information and opinions contained herein have been compiled or arrived at from sources believed reliable but no representation or warranty, express or implied, is made as to their accuracy or completeness. Neither Scotiabank nor any of its officers, directors, partners, employees or affiliates accepts any liability whatsoever for any direct or consequential loss arising from any use of this report or its contents.
These reports are provided to you for informational purposes only. This report is not, and is not constructed as, an offer to sell or solicitation of any offer to buy any financial instrument, nor shall this report be construed as an opinion as to whether you should enter into any swap or trading strategy involving a swap or any other transaction. The information contained in this report is not intended to be, and does not constitute, a recommendation of a swap or trading strategy involving a swap within the meaning of U.S. Commodity Futures Trading Commission Regulation 23.434 and Appendix A thereto. This material is not intended to be individually tailored to your needs or characteristics and should not be viewed as a “call to action” or suggestion that you enter into a swap or trading strategy involving a swap or any other transaction. Scotiabank may engage in transactions in a manner inconsistent with the views discussed this report and may have positions, or be in the process of acquiring or disposing of positions, referred to in this report.
Scotiabank, its affiliates and any of their respective officers, directors and employees may from time to time take positions in currencies, act as managers, co-managers or underwriters of a public offering or act as principals or agents, deal in, own or act as market makers or advisors, brokers or commercial and/or investment bankers in relation to securities or related derivatives. As a result of these actions, Scotiabank may receive remuneration. All Scotiabank products and services are subject to the terms of applicable agreements and local regulations. Officers, directors and employees of Scotiabank and its affiliates may serve as directors of corporations.
Any securities discussed in this report may not be suitable for all investors. Scotiabank recommends that investors independently evaluate any issuer and security discussed in this report, and consult with any advisors they deem necessary prior to making any investment.
This report and all information, opinions and conclusions contained in it are protected by copyright. This information may not be reproduced without the prior express written consent of Scotiabank.
™ Trademark of The Bank of Nova Scotia. Used under license, where applicable.
Scotiabank, together with “Global Banking and Markets”, is a marketing name for the global corporate and investment banking and capital markets businesses of The Bank of Nova Scotia and certain of its affiliates in the countries where they operate, including; Scotiabank Europe plc; Scotiabank (Ireland) Designated Activity Company; Scotiabank Inverlat S.A., Institución de Banca Múltiple, Grupo Financiero Scotiabank Inverlat, Scotia Inverlat Casa de Bolsa, S.A. de C.V., Grupo Financiero Scotiabank Inverlat, Scotia Inverlat Derivados S.A. de C.V. – all members of the Scotiabank group and authorized users of the Scotiabank mark. The Bank of Nova Scotia is incorporated in Canada with limited liability and is authorised and regulated by the Office of the Superintendent of Financial Institutions Canada. The Bank of Nova Scotia is authorized by the UK Prudential Regulation Authority and is subject to regulation by the UK Financial Conduct Authority and limited regulation by the UK Prudential Regulation Authority. Details about the extent of The Bank of Nova Scotia's regulation by the UK Prudential Regulation Authority are available from us on request. Scotiabank Europe plc is authorized by the UK Prudential Regulation Authority and regulated by the UK Financial Conduct Authority and the UK Prudential Regulation Authority.
Scotiabank Inverlat, S.A., Scotia Inverlat Casa de Bolsa, S.A. de C.V, Grupo Financiero Scotiabank Inverlat, and Scotia Inverlat Derivados, S.A. de C.V., are each authorized and regulated by the Mexican financial authorities.
Not all products and services are offered in all jurisdictions. Services described are available in jurisdictions where permitted by law.