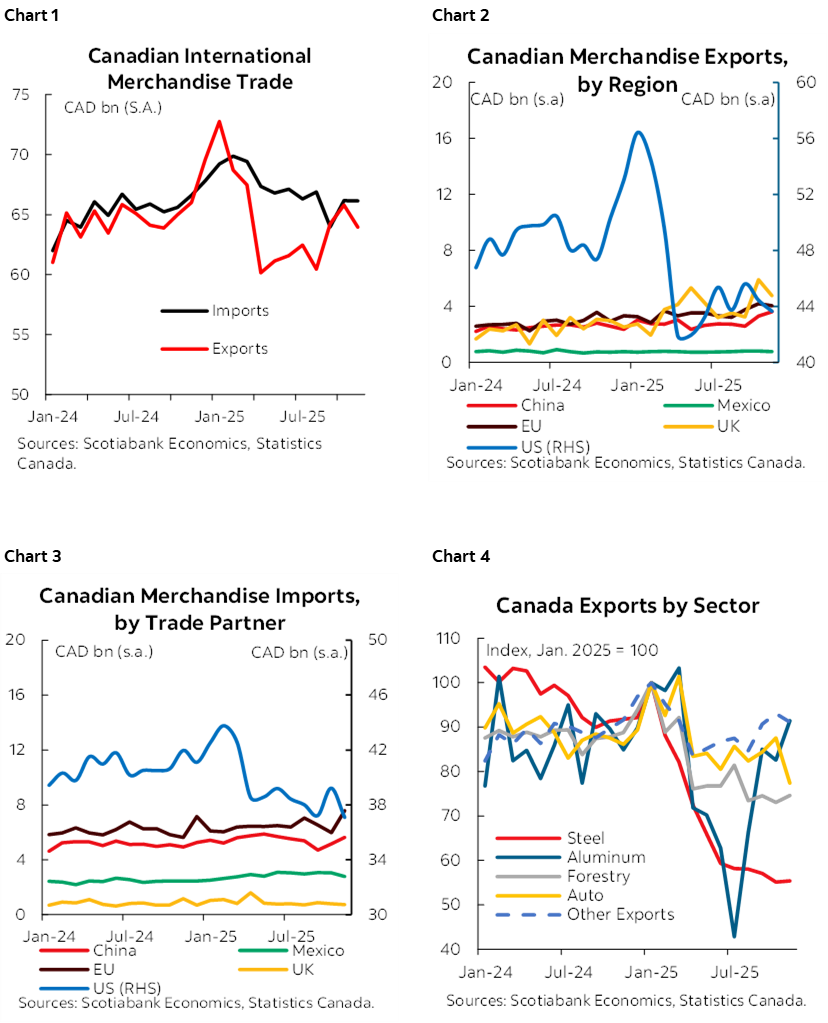
- Canada’s goods exports fell 2.8% in November and imports ticked down 0.1%—resulting in a deficit of $2.2 bn for the month. While unwrought gold was the main driver in changes on the export side (as it has been for several months), motor vehicles and parts also contributed to the decline in November—coinciding with the new U.S. tariffs on heavy trucks and buses. On the import side, declines in motor vehicles and energy imports were offset by increases in consumer goods.
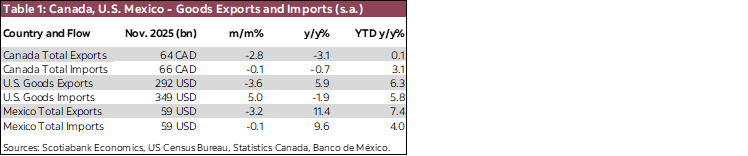
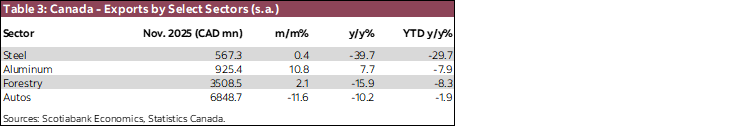
- Looking at the first eleven months of the year as a whole, Canadian goods exports were only 0.1% higher, as increases in gold have offset declines in most other product categories, notably steel (-30%), aluminum (-8%), forestry (-8%), and motor vehicles and parts (-2%). In contrast, imports have grown by a more typical 3.1%, and as a result trade will drag on overall GDP growth for 2025. However, the drag is reducing, and trade is on track to be broadly neutral or somewhat positive in Q4. We expect the drag from trade to continue to gradually decline though 2027.
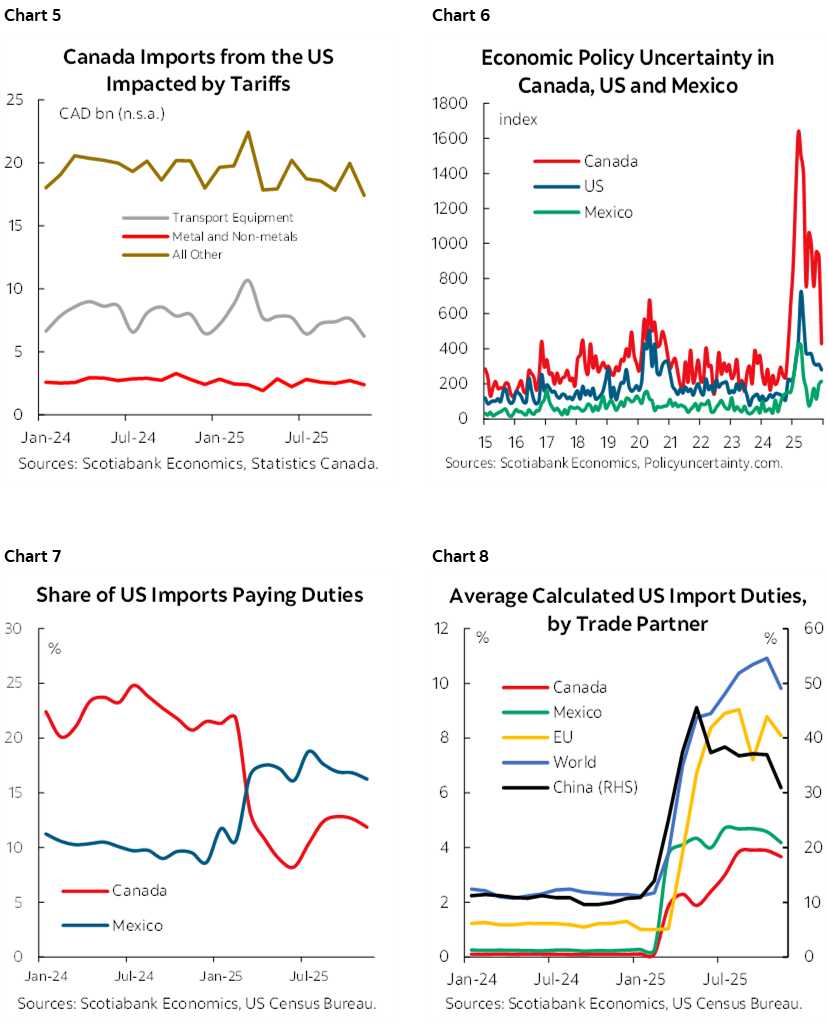
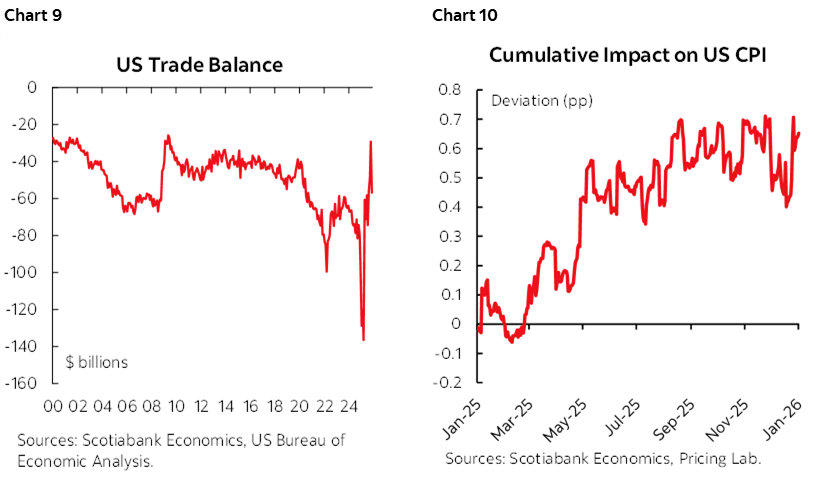
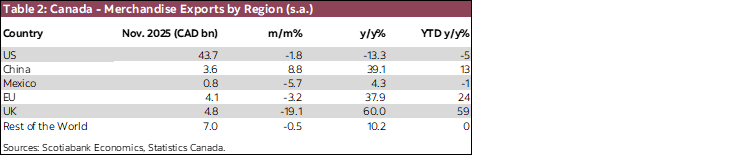
- The share of Canadian exports bound for the U.S. has declined from 76% in 2024 to 68% by November, driven by a decline in exports to the U.S. and increasing exports to other countries. Exports to the U.S. fell 1.8% m/m and were down 13.3% y/y. Exports to other countries dropped 4.9% in November but remained nearly 30% higher compared to the previous November thanks to growth earlier in the year—though much of this has been driven by elevated overseas exports of gold. A similar dynamic is playing out on the import side, as the share of imports from the U.S. has fallen from over 60% to 56% in November.
- The overall U.S. trade balance increased in November, after having fallen in October to its smallest since May 2009. Imports have been trending lower, though increased 5% in November—led by pharmaceuticals and computers. U.S. exports fell 3.6% in November but were up 5.9% y/y.
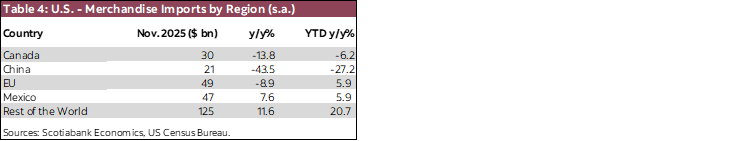
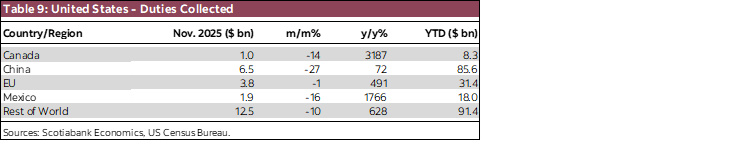
- The changes to the U.S. trade balance also reflect compositional changes to U.S. trade flows. Comparing November 2025 to November 2024, U.S. imports were significantly lower from China (-44%), Canada (-14%), and the EU (-9%)—and higher from Mexico (+8%) and the rest of the world (+12%).
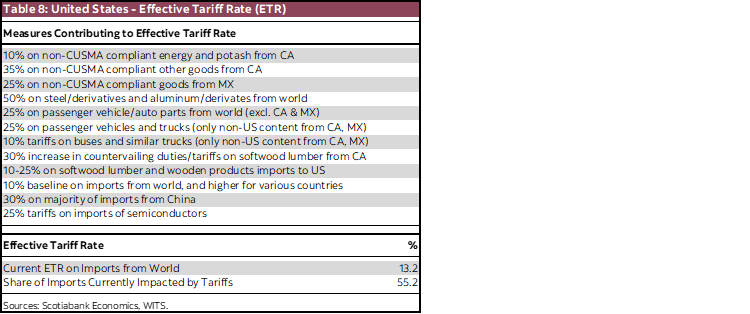
- U.S. customs data show that the proportion of Canadian goods imported into the U.S. facing tariffs has settled at around 12%, down from 20–25% in 2024 (due to the increased incentive for firms to submit CUSMA compliance paperwork).
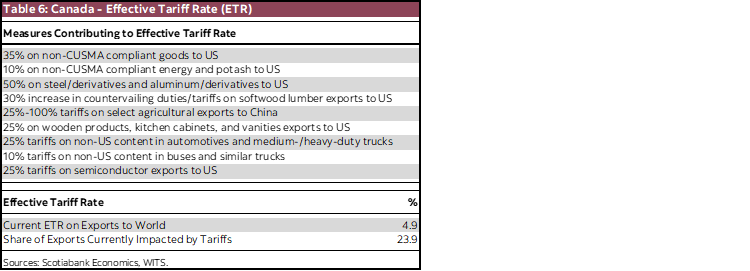
- Canada continues to benefit from a (relatively) low effective tariff rate on exports to the U.S. (6.3% is our current estimate, based on pre-tariff trade flows) thanks to most of our trade continuing on a tariff-free basis under CUSMA. The best estimate of the average actual duty paid on U.S. imports from Canada seems to have settled just below 4%, though this figure may not include all trade levies.
- The U.S. import tariffs continue to create inflationary pressures in that country, with the latest estimate of the cumulative impact of the tariffs on U.S. CPI above 0.6 percentage points, clouding the outlook for U.S. interest rate cuts.
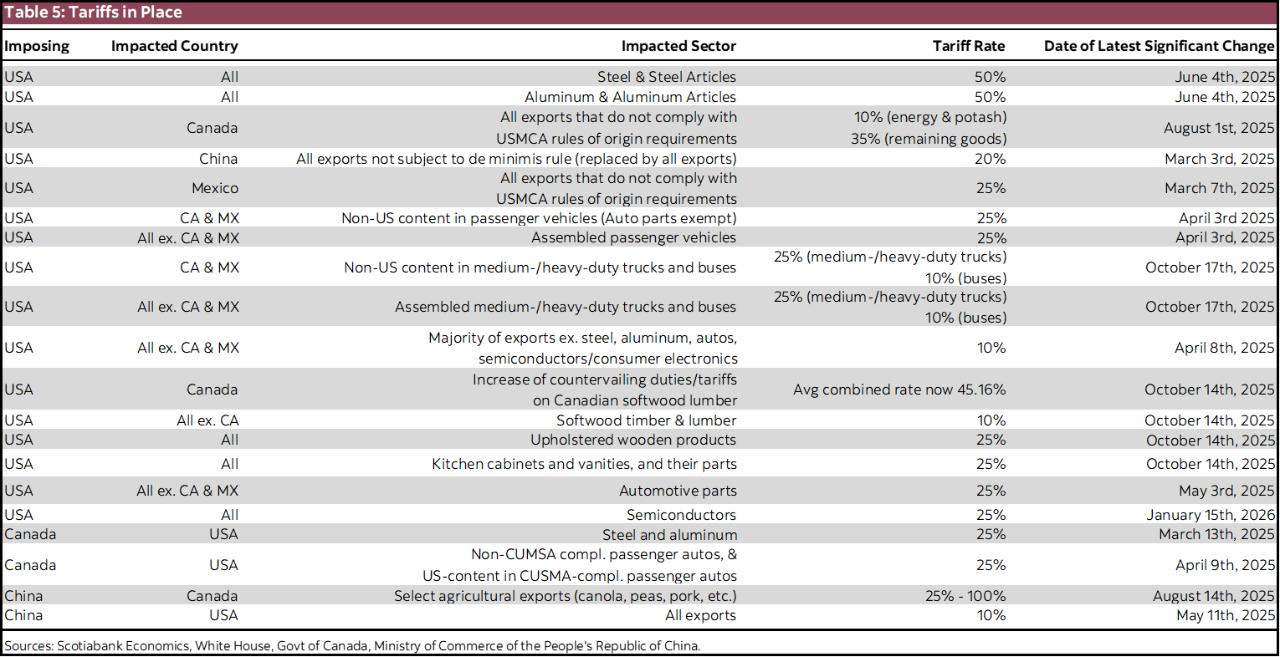
- With the U.S. Supreme Court expected to rule on the legality of the IEEPA tariffs soon, there could be renewed turbulence in the ongoing U.S. global trade war in the coming weeks. If these tariffs are struck down, these could be replaced under a new mechanism—which would likely again be challenged, leading to renewed uncertainty. For Canada, the sectoral tariffs are by far the most impactful, and will continue to weigh on the Canadian economy as long as they remain in place.

DISCLAIMER
This report has been prepared by Scotiabank Economics as a resource for the clients of Scotiabank. Opinions, estimates and projections contained herein are our own as of the date hereof and are subject to change without notice. The information and opinions contained herein have been compiled or arrived at from sources believed reliable but no representation or warranty, express or implied, is made as to their accuracy or completeness. Neither Scotiabank nor any of its officers, directors, partners, employees or affiliates accepts any liability whatsoever for any direct or consequential loss arising from any use of this report or its contents.
These reports are provided to you for informational purposes only. This report is not, and is not constructed as, an offer to sell or solicitation of any offer to buy any financial instrument, nor shall this report be construed as an opinion as to whether you should enter into any swap or trading strategy involving a swap or any other transaction. The information contained in this report is not intended to be, and does not constitute, a recommendation of a swap or trading strategy involving a swap within the meaning of U.S. Commodity Futures Trading Commission Regulation 23.434 and Appendix A thereto. This material is not intended to be individually tailored to your needs or characteristics and should not be viewed as a “call to action” or suggestion that you enter into a swap or trading strategy involving a swap or any other transaction. Scotiabank may engage in transactions in a manner inconsistent with the views discussed this report and may have positions, or be in the process of acquiring or disposing of positions, referred to in this report.
Scotiabank, its affiliates and any of their respective officers, directors and employees may from time to time take positions in currencies, act as managers, co-managers or underwriters of a public offering or act as principals or agents, deal in, own or act as market makers or advisors, brokers or commercial and/or investment bankers in relation to securities or related derivatives. As a result of these actions, Scotiabank may receive remuneration. All Scotiabank products and services are subject to the terms of applicable agreements and local regulations. Officers, directors and employees of Scotiabank and its affiliates may serve as directors of corporations.
Any securities discussed in this report may not be suitable for all investors. Scotiabank recommends that investors independently evaluate any issuer and security discussed in this report, and consult with any advisors they deem necessary prior to making any investment.
This report and all information, opinions and conclusions contained in it are protected by copyright. This information may not be reproduced without the prior express written consent of Scotiabank.
™ Trademark of The Bank of Nova Scotia. Used under license, where applicable.
Scotiabank, together with “Global Banking and Markets”, is a marketing name for the global corporate and investment banking and capital markets businesses of The Bank of Nova Scotia and certain of its affiliates in the countries where they operate, including; Scotiabank Europe plc; Scotiabank (Ireland) Designated Activity Company; Scotiabank Inverlat S.A., Institución de Banca Múltiple, Grupo Financiero Scotiabank Inverlat, Scotia Inverlat Casa de Bolsa, S.A. de C.V., Grupo Financiero Scotiabank Inverlat, Scotia Inverlat Derivados S.A. de C.V. – all members of the Scotiabank group and authorized users of the Scotiabank mark. The Bank of Nova Scotia is incorporated in Canada with limited liability and is authorised and regulated by the Office of the Superintendent of Financial Institutions Canada. The Bank of Nova Scotia is authorized by the UK Prudential Regulation Authority and is subject to regulation by the UK Financial Conduct Authority and limited regulation by the UK Prudential Regulation Authority. Details about the extent of The Bank of Nova Scotia's regulation by the UK Prudential Regulation Authority are available from us on request. Scotiabank Europe plc is authorized by the UK Prudential Regulation Authority and regulated by the UK Financial Conduct Authority and the UK Prudential Regulation Authority.
Scotiabank Inverlat, S.A., Scotia Inverlat Casa de Bolsa, S.A. de C.V, Grupo Financiero Scotiabank Inverlat, and Scotia Inverlat Derivados, S.A. de C.V., are each authorized and regulated by the Mexican financial authorities.
Not all products and services are offered in all jurisdictions. Services described are available in jurisdictions where permitted by law.