EXECUTIVE SUMMARY
- Equity markets have performed very well in recent quarters. Their performance has provided significant support to economic activity in the U.S. and Canada since 2023.
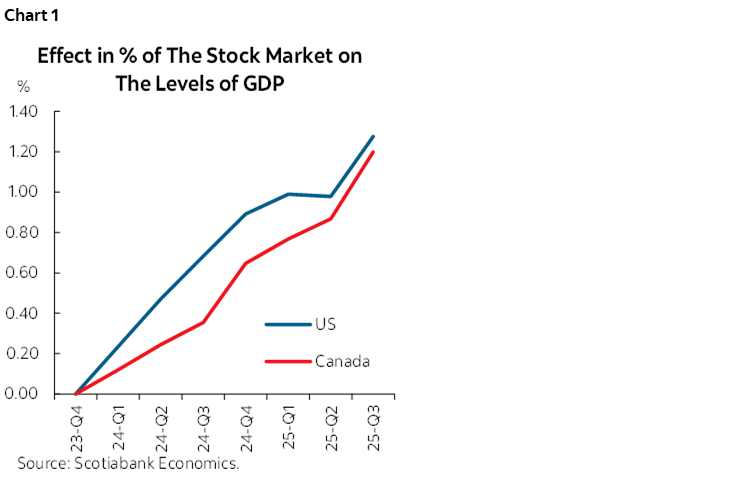
- We find that the surge in equity prices of the last few years raised the level of Canadian and U.S. real GDP in 2025Q3 by just over 1% relative to the level in late 2023.
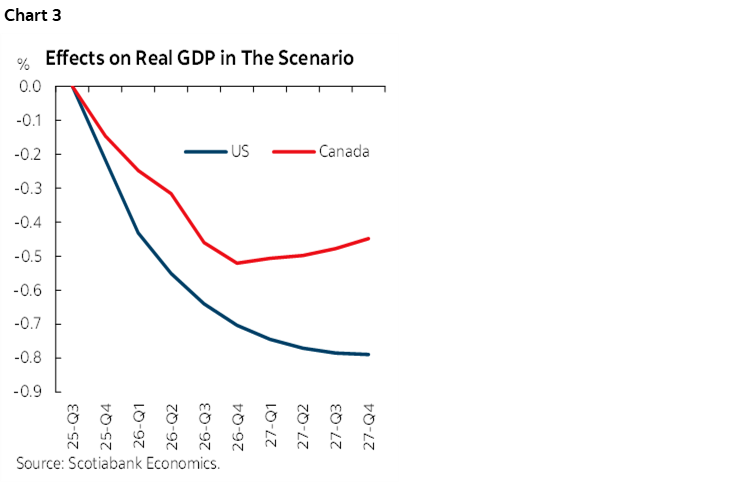
- A significant pullback in equity markets would have damaging impacts on growth, eliminating a key support for economies that are adapting to a high-tariff world. Our simulations suggest a 20% decline in U.S equity markets that leads to a 10% decline in Canadian equity values would lower the level of real GDP by 0.8% and 0.5% in 2027 in the U.S. and Canada, respectively, relative to our base case.
CONTEXT
Equity markets have risen by about 40% since 2023. This surge has boosted financial wealth and supported household spending in both Canada and the U.S. We find it has been an important source of growth in the last few years and will continue to support activity going forward. However, these elevated valuations imply high expectations for continued earnings growth in AI-linked sectors, expectations that may not materialize, raising concerns about potential overvaluation. This represents a downside risk to our outlook. This note examines the impact of past movements in stock markets on the current level of economic activity and draws out the implications of a potential equity correction on the way forward.
1. A LOOK BACK: EQUITIES PROVIDED SIGNIFICANT BOOST TO GROWTH
We use our macroeconometric model to assess the impacts of the equity market surge since late 2023. In isolation, the rise in equity values supported the U.S. and Canadian economies through stronger household balance sheets and easier financial conditions. Our simulations indicate that the equity rally boosted GDP levels in the United States by approximately 1.2% in 2025Q3 relative to late 2023. The effect in Canada is similar in magnitude but differed in its composition with most of the effect coming from positive trade spillovers (chart 1). Indeed, wealth effects are smaller in Canada since households have a smaller proportion of their wealth in equities, which means that the Canadian equity price surge had a smaller effect on household spending. In contrast, the strong exposure of Canadian exports to U.S. economic activity implies a strong reaction of Canadian GDP to movements in U.S. stock prices.
These simulations show that the surge in equity prices over the past few years had a significant impact on economic growth. On its own, it accounted for roughly 30% of U.S. growth and 40% of Canadian growth between 2023 and 2025, and almost entirely explains investment dynamics in the U.S. This reflects the fact that U.S. investment is quite sensitive to the cost of equity capital, and the rise in valuations lowered the cost of capital. While other factors contributed during this period, overall growth would have been markedly weaker without this support.
2. RISK SCENARIO: VALUATION CORRECTION
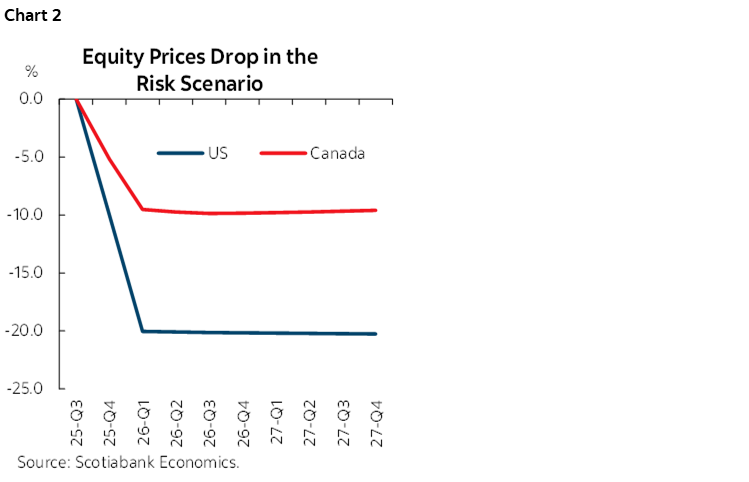
The support coming from elevated valuation is expected to remain over our forecast horizon, but a possible market repricing introduces a risk to our outlook. In our scenario analysis, we assume equity prices (S&P 500) decline by 20% from 2025Q4 to 2026Q1, to a level last seen in mid 2024, with a U.S.-led correction pulling the TSX lower by an assumed 10% (chart 2).1 We also assess the impact of a worst-case scenario where equities drop by 40% in the U.S., and 20% in Canada. We use our macroeconometric model to simulate the economic impact of this adjustment. The use of a macro model here is critical, as it captures the general equilibrium effects of equity market movements, and reflects the deep commercial and financial integration between the two economies.
In our model, a repricing of equity valuations would be transmitted through the economy via three main channels:
1. Wealth Effects: Household Spending
As equity prices fall, the value of household wealth also falls, leading to lower spending. U.S. consumers are particularly subject to this effect, where equities make up of a large portion of their wealth.
2. Financial Conditions: Investment
A broad market pullback would tighten credit spreads, reduce corporate issuance appetite, and weigh on investment intentions.
3. Trade and Financial Spillovers: Additional Impact on Canada
On top of the direct effect of equity prices on Canadian household spending, Canada’s trade integration with the U.S. business cycle amplifies these spillovers. This is in fact the most important channel for the Canadian economy
THE FED AND BOC CUSHIONING THE IMPACT
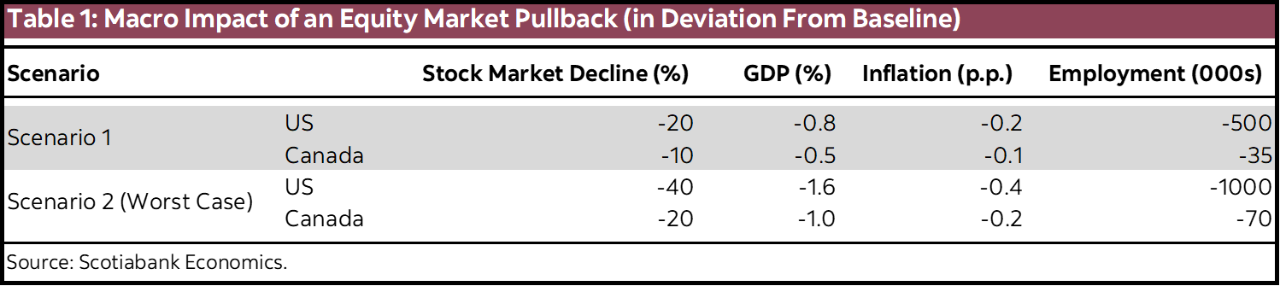
Overall, a broad pullback in equity markets would weigh on consumption and investment in both the U.S. and Canada, with Canada additionally exposed via trade. It would lower the level of GDP by 0.8% in the U.S., and 0.5% in Canada (chart 3), and lower inflation by 0.2 p.p. to 0.1 p.p., respectively. This weaker economic activity would also mean weaker job growth, reducing the level of employment by about 500k in the U.S. and 35k in Canada, relative to our baseline. The macro impact would be about double in the worst case scenario (table 1).
Such a negative impact would be sufficient to prompt a monetary policy response, though not large enough to fully offset the economic impact. Our model-based simulations suggest the FED would lower the fed fund rate by 60 bps relative to baseline, while it would be slightly smaller from the BoC at 50 bps, because of the relatively smaller impact on GDP.
1 The smaller impact on Canadian equities reflects the historical passthrough imbedded in the model between the two markets. It also reflects the fact that Canadian stock market is less exposed to AI.
DISCLAIMER
This report has been prepared by Scotiabank Economics as a resource for the clients of Scotiabank. Opinions, estimates and projections contained herein are our own as of the date hereof and are subject to change without notice. The information and opinions contained herein have been compiled or arrived at from sources believed reliable but no representation or warranty, express or implied, is made as to their accuracy or completeness. Neither Scotiabank nor any of its officers, directors, partners, employees or affiliates accepts any liability whatsoever for any direct or consequential loss arising from any use of this report or its contents.
These reports are provided to you for informational purposes only. This report is not, and is not constructed as, an offer to sell or solicitation of any offer to buy any financial instrument, nor shall this report be construed as an opinion as to whether you should enter into any swap or trading strategy involving a swap or any other transaction. The information contained in this report is not intended to be, and does not constitute, a recommendation of a swap or trading strategy involving a swap within the meaning of U.S. Commodity Futures Trading Commission Regulation 23.434 and Appendix A thereto. This material is not intended to be individually tailored to your needs or characteristics and should not be viewed as a “call to action” or suggestion that you enter into a swap or trading strategy involving a swap or any other transaction. Scotiabank may engage in transactions in a manner inconsistent with the views discussed this report and may have positions, or be in the process of acquiring or disposing of positions, referred to in this report.
Scotiabank, its affiliates and any of their respective officers, directors and employees may from time to time take positions in currencies, act as managers, co-managers or underwriters of a public offering or act as principals or agents, deal in, own or act as market makers or advisors, brokers or commercial and/or investment bankers in relation to securities or related derivatives. As a result of these actions, Scotiabank may receive remuneration. All Scotiabank products and services are subject to the terms of applicable agreements and local regulations. Officers, directors and employees of Scotiabank and its affiliates may serve as directors of corporations.
Any securities discussed in this report may not be suitable for all investors. Scotiabank recommends that investors independently evaluate any issuer and security discussed in this report, and consult with any advisors they deem necessary prior to making any investment.
This report and all information, opinions and conclusions contained in it are protected by copyright. This information may not be reproduced without the prior express written consent of Scotiabank.
™ Trademark of The Bank of Nova Scotia. Used under license, where applicable.
Scotiabank, together with “Global Banking and Markets”, is a marketing name for the global corporate and investment banking and capital markets businesses of The Bank of Nova Scotia and certain of its affiliates in the countries where they operate, including; Scotiabank Europe plc; Scotiabank (Ireland) Designated Activity Company; Scotiabank Inverlat S.A., Institución de Banca Múltiple, Grupo Financiero Scotiabank Inverlat, Scotia Inverlat Casa de Bolsa, S.A. de C.V., Grupo Financiero Scotiabank Inverlat, Scotia Inverlat Derivados S.A. de C.V. – all members of the Scotiabank group and authorized users of the Scotiabank mark. The Bank of Nova Scotia is incorporated in Canada with limited liability and is authorised and regulated by the Office of the Superintendent of Financial Institutions Canada. The Bank of Nova Scotia is authorized by the UK Prudential Regulation Authority and is subject to regulation by the UK Financial Conduct Authority and limited regulation by the UK Prudential Regulation Authority. Details about the extent of The Bank of Nova Scotia's regulation by the UK Prudential Regulation Authority are available from us on request. Scotiabank Europe plc is authorized by the UK Prudential Regulation Authority and regulated by the UK Financial Conduct Authority and the UK Prudential Regulation Authority.
Scotiabank Inverlat, S.A., Scotia Inverlat Casa de Bolsa, S.A. de C.V, Grupo Financiero Scotiabank Inverlat, and Scotia Inverlat Derivados, S.A. de C.V., are each authorized and regulated by the Mexican financial authorities.
Not all products and services are offered in all jurisdictions. Services described are available in jurisdictions where permitted by law.