- Canada must spend more on defence, full stop. A more polarized world and years of underinvestment leave the country exposed.
- But it is not starting from zero. Canada has now met NATO’s old 2% benchmark for direct defence spending and likely sits near the new defence-adjacent 1.5% threshold. Implementing what’s been pledged is already ambitious.
- The security perimeter has also widened materially. The Iran war reinforces that energy security, critical minerals, strategic infrastructure, and supply chains are now integral to defence.
- NATO’s new 5% target reflects this broader security landscape, but the 1.5% bucket should function as a floor for strategic investment, not a de facto ceiling, especially for countries with a comparative edge but inevitable competing national priorities.
- A key policy question for Canada is where the next dollar goes—and how it will be financed. Those choices should be guided by pragmatism, absorption capacity, and comparative advantage, not mechanical target chasing.
- The real test is whether Canada’s defence buildup—within a broader national investment push—builds domestic capability, productive capacity, and resilience in ways that serve both national and allied security.
- Canada must scale core defence credibly while pressing for a NATO framework that better reflects comparative advantage and must eventually bring Canadians into the choices that would follow from a potentially even bigger price tag down the road.
- Canada needs to get its own ramp-up right and help NATO get the framework right.
MEETING THE MOMENT
Canada has little choice but to scale up its defence efforts. The world is more polarized, conflict risk is higher, and sovereignty risk has itself been weaponized, exposing the costs of decades of underinvestment and visible capability gaps at home. The question is no longer whether Canada should do more, but how to do more in a way that strengthens both security and long-run resilience.
The security lens has also widened—likely permanently. The Iran war has demonstrated that energy systems, critical minerals, strategic infrastructure, and supply chains are no longer adjacent economic considerations. They are part of the security architecture itself. NATO’s new 5% target moves in the right direction by recognizing a broader set of defence-enabling investments under its 1.5% bucket, even if the exact contours of that category are still being worked out.
Many of these related investments (energy, critical minerals, infrastructure, and upstream industrial capacity) should be economically and strategically valuable in their own right. Canada is already operating near this broader effort level and has both the ambition and resource base to go further. For Canada, the bigger issue may not be what qualifies under the 1.5% umbrella, but whether the target structure encourages further strategic investment or unintentionally constrains it in areas where Canada has a clear comparative advantage.
This argues for a defence scale-up that is not only larger but calibrated to avoid displacing investment that could better strengthen both national resilience and allied security.
FROM CATCH-UP TO SCALE-UP
Canada is still digesting a rapid ramp-up in military outlays to meet NATO’s 2% target (charts 1 and 2). It was one of the last NATO members to meet the alliance’s earlier benchmark, and even that required a sharp near-term increase in spending. Fiscal-year 2026 (F26) defence outlays were lifted to about $63 billion—roughly 20% above plan and over 50% relative to $41 billion the year prior (cash basis1)—with part of the increase delivered through an immediate pay raise for military personnel. Budget 2025’s net $81.8 billion (cash) allocation broadly sustains spending around the 2% threshold over the planning horizon.
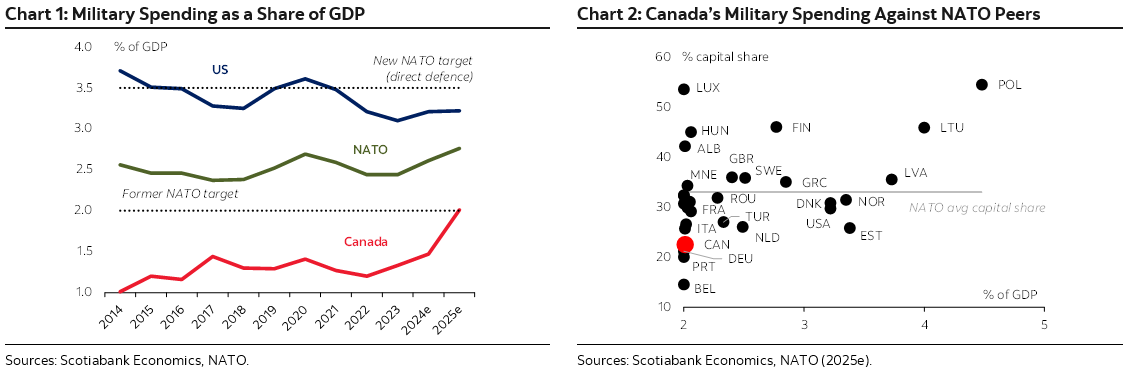
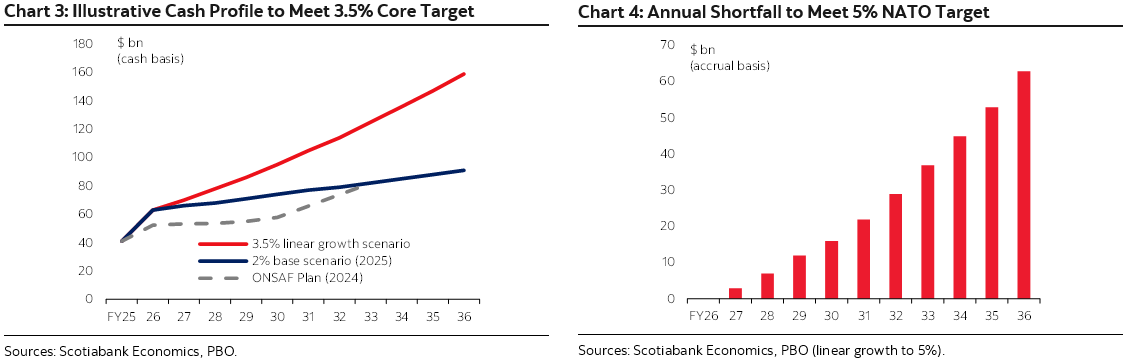
Getting to 5% would carry a very high price tag. The new NATO benchmark raises the direct defence spending target to 3.5% by 2035, along with a new 1.5% target for broader defence-related investments. The federal government has indicated that Canada likely already meets the 1.5% threshold but has not yet released a detailed fiscal plan. The Parliamentary Budget Officer (PBO) estimates that closing the gap could amount to another $68 billion (~ 1.5 % of GDP) annually above baseline by FY36—or a total annual outlay of $159 billion (cash) that year (charts 3 and 4).
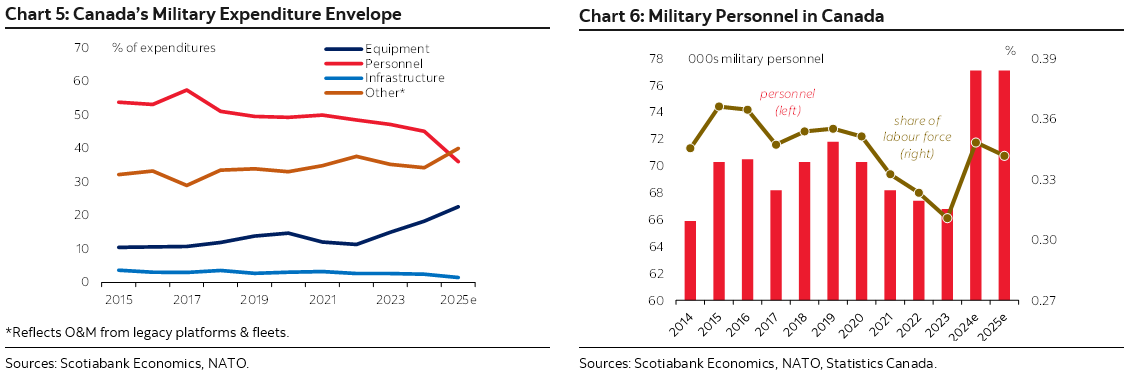
The next phase will be even harder as Canada must simultaneously scale and reorient defence spending toward capital investment. It trails NATO peers against the alliance’s less-discussed compositional guidance to devote at least 20% of expenditures to major equipment, including related R&D. Canada has nearly doubled its equipment share over the past decade to 22.6% in 2025, but that remains well below the roughly one-third share of allies. Personnel, operating, and sustainment costs remain heavy, especially as aging fleets become more expensive to maintain, while infrastructure spending has remained persistently weak (charts 5 and 6).
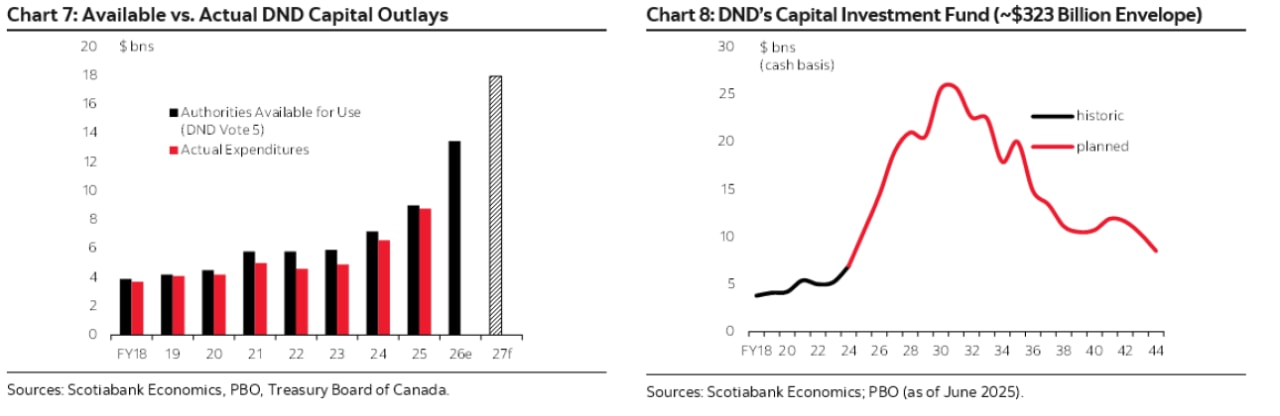
The last official defence spending profile is now over two years old (in 2024’s Our North, Strong and Free). That plan had already mapped an ambitious rise in capital spending under DND’s Capital Investment Fund (CIF), projecting a doubling in annual outlays over the next decade. While the envelope by design incorporates reprofiling flexibility for lumpy outlays, it has historically undershot approved allocations (charts 7 and 8). This is consistent with broader infrastructure delivery in Canada. Absent consolidated official reporting, the PBO’s practice assumes a 25% lapse rate based on historical reprofiling.
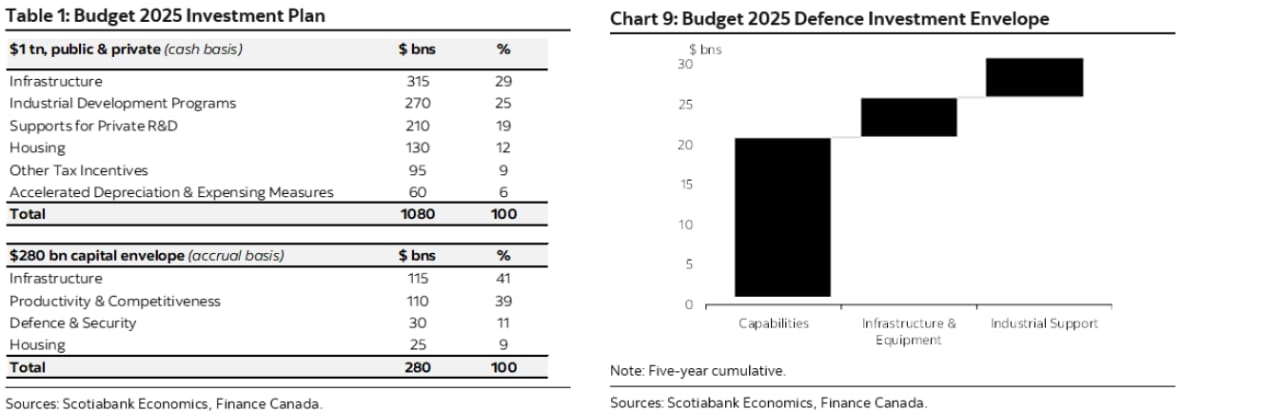
This scaling would occur in the context of a broader investment agenda. Budget 2025 set out a comprehensive capital investment framework for its wide-ranging “trillion-dollar” investment ambitions. That framework carves out $280 billion in federal funding (accrual basis, or $450 billion cash) over five years to crowd in the headline cash number (table 1 and chart 9). Within that $280 billion envelope, $30 billion is tagged “Defence & Security,” but it is hard to parse out net-new plans (and crosswalks to the already-planned $100 billion cash outlays under the CIF over this period remain unclear).
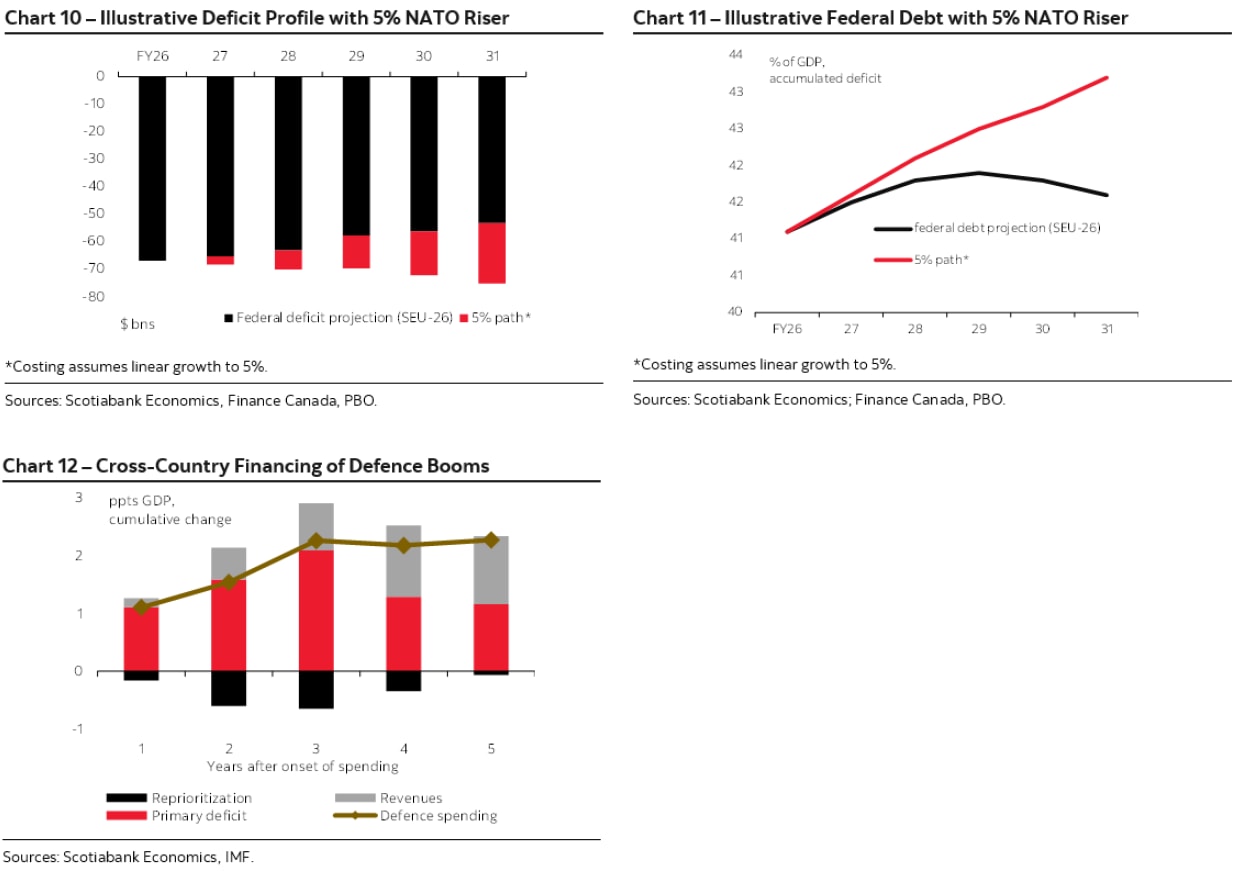
Meeting 5% would not just be a spending question, but also a financing one. A largely deficit-financed path would materially add to public debt and risk eroding Canada’s relative fiscal advantage, especially if spending fails to deliver expected growth gains. The PBO estimates this path could lift federal debt by more than 6 ppts by 2035. Before accounting for any dynamic impacts, that would put deficit and debt on markedly looser trajectories (charts 10 and 11). Otherwise, a combination of higher taxes and/or spending restraint would foot at least part of the bill. IMF cross-country work has found that, in practice, about two-thirds of large defence buildups are typically financed through borrowing with the balance through fiscal adjustment (chart 12).
Piecing together a coherent baseline—let alone a path to scale—is admittedly challenging. It requires assumptions about capital versus operating, cash versus accrual, defence versus related spending, federal versus provincial spending, and what was already planned versus newly announced. Importantly, it also requires assumptions about growth, since the NATO target is defined as a share of GDP, which the spending path itself can influence.
The federal government will eventually need to spell out the path, but the picture today likely points to direct defence spending remaining uncomfortably close to 2%—at a time of mounting U.S. pressure. Even at that level, rebalancing toward higher capital spending would still look ambitious—and risky. Canada has yet to have these conversations.
TURNING DEFENCE SPENDING INTO DOMESTIC CAPACITY
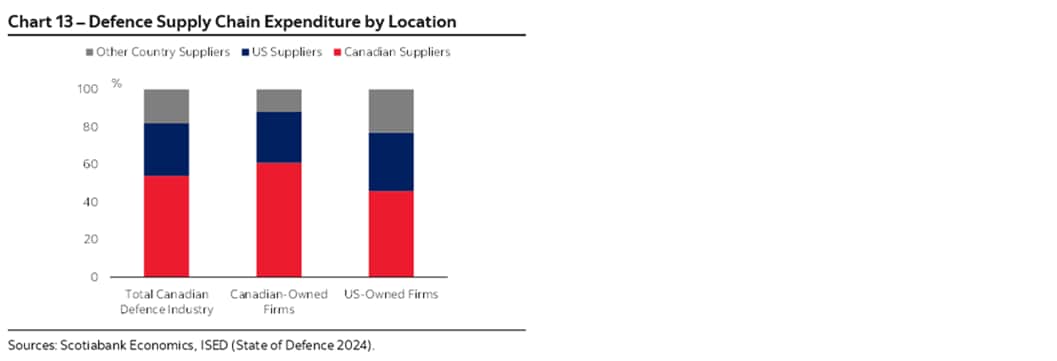
A bigger defence budget does not automatically translate into stronger domestic growth. The economic payoff depends on where the money goes (personnel, domestic sustainment, infrastructure, or imported equipment). Currently, roughly 55% of Canada’s defence supply chain is Canada-based, for example (chart 13). In GDP terms, the rest leaks abroad rather than showing up as Canadian output.
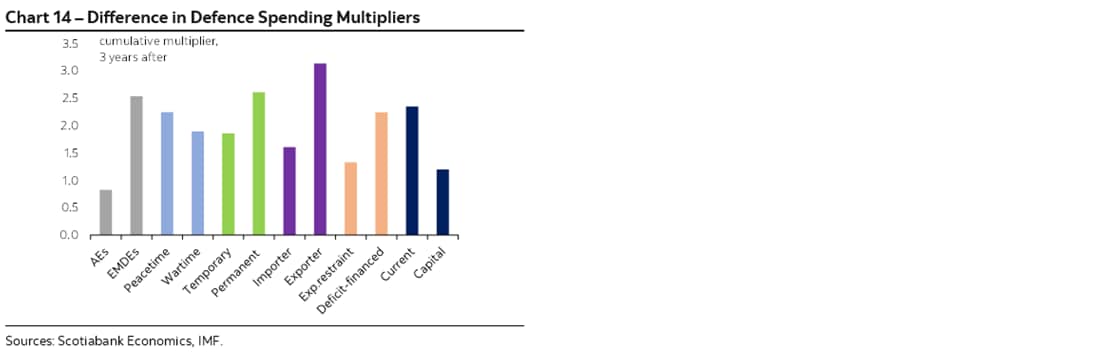
Recent IMF empirical work reinforces the point. Defence buildups often begin as demand shocks, but their macro effects vary widely (chart 14). Spending that is import-heavy or runs ahead of domestic capacity can drive inflationary pressures, weaken fiscal and external balances, and raise debt levels, while spending that is sustained, domestically captured, and capacity-building tends to generate stronger multipliers.
The ideal economic path converts fiscal effort into both capability and productive capacity. That means prioritizing spending that deepens the capital stock, strengthens firm capacity, builds labour skills, expands infrastructure, supports R&D, retains intellectual property, and opens export channels. By contrast, an operationally led expansion may support near-term activity, but is less likely to raise potential output and more likely to intensify fiscal, inflationary, and opportunity-cost pressures.
Canada’s new defence strategy broadly aligns with this logic. It shifts the focus from procurement to defence-industrial capacity, making domestic value capture the core economic test. Its Build–Partner–Buy framework operationalizes this approach: Build where Canada can develop sovereign capability; partner where scale, technology, or interoperability require it; and buy abroad only where necessary, ideally in ways that still strengthen Canadian firms, IP, sustainment, and control. New institutions, including the DIA and a Canada-based multilateral DSRB would help implement that strategy.
If it is well executed, such a defence ramp-up could strengthen both military capability and industrial capacity in sectors where sovereignty and productivity overlap.
START SMALL, THINK BIG
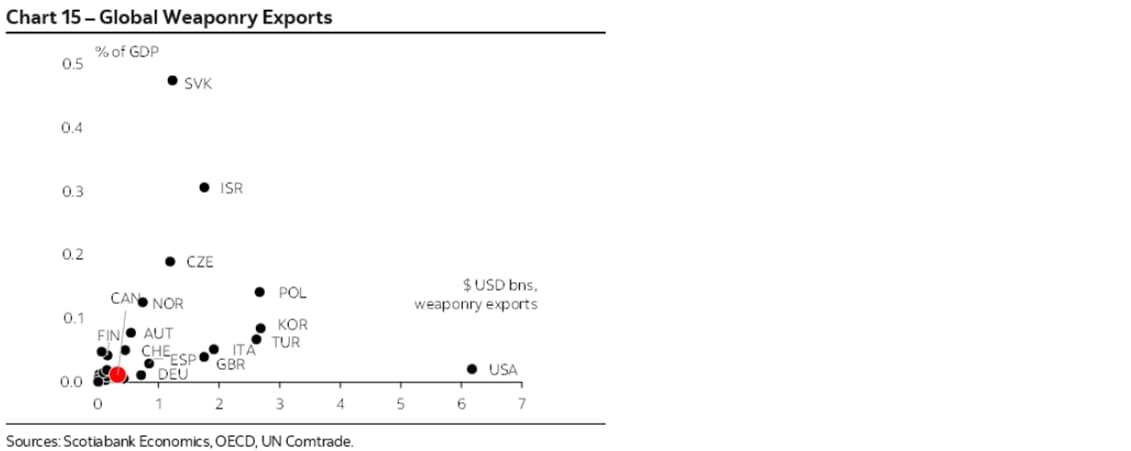
Canada starts from a small but scalable base. The federal government estimates that the domestic defence sector comprises roughly 600 firms, supports about 81,000 jobs, generates around $14.3 billion in annual revenues, and contributes about $9.6 billion to GDP. About half of its defence-related products and services are sold abroad though it is still a bit player on the global stage (chart 15).
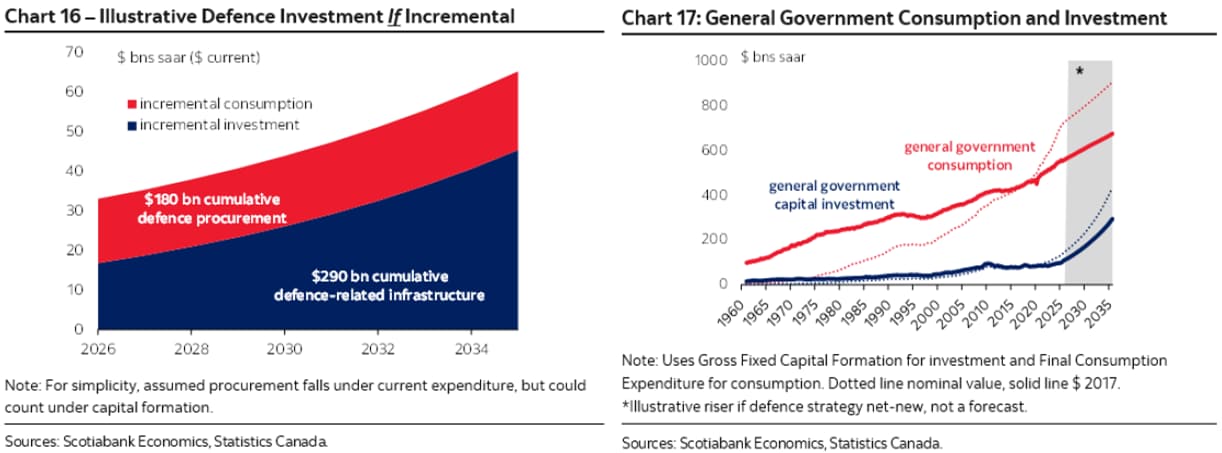
Domestic scale is the central economic test. The strategy sets explicit targets to raise the Canadian share of defence acquisitions to 70%, increase defence exports by 50%, boost defence-related R&D by 85%, and lift industry revenues by more than 240%. It also points to much larger economy-wide spillovers, including up to 125,000 additional jobs alongside $180 billion in direct procurement, $290 billion in defence-related infrastructure, and $125 billion in downstream activity over the next decade.
Those figures are substantial relative to Canada’s recent public-spending base. In 2025, total general government current expenditure and capital formation was about $867 billion, with current spending accounting for almost 85% of the total. Taken together, the strategy’s procurement and infrastructure ambitions—if truly incremental—would imply roughly $47 billion in average annual gross spending over the next decade (charts 16 and 17). The procurement component alone would represent an incremental lift of about $18 billion per year, or about 2% annual sustained growth in total government consumption.
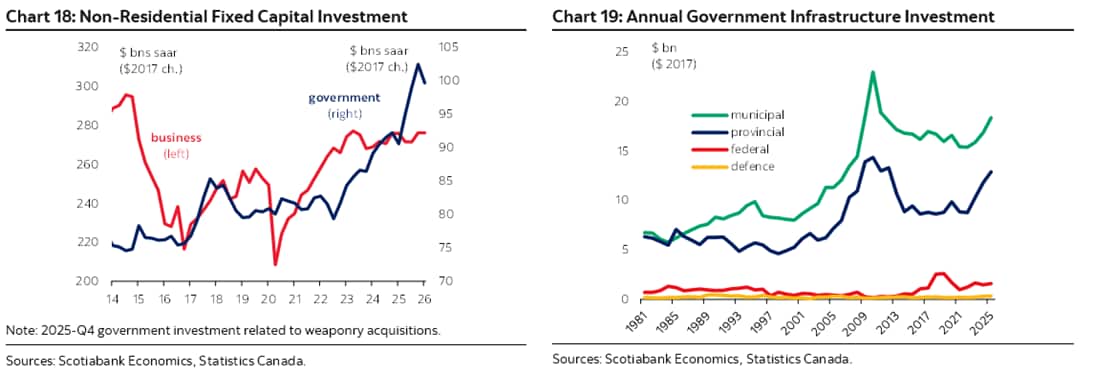
The infrastructure component would be far more demanding at roughly $30 billion per year, or nearly 12% sustained annual growth in total public capital formation. Canada has never built at this pace: The 1960s scale-up peaked at around 5%, while the post-Global Financial Crisis countercyclical short-lived expansion was less than half that. (An end-2025 spike in government investment related to weaponry outlays is not indicative of trend—chart 18.) Most of this would also fall to other orders of government to deliver (chart 19). This would be ambitious across sectors, let alone so concentrated in one.
The trade-offs from miscalibration could be large. For illustration, a domestic-capture rate stuck near today’s 55% rather than the targeted 70% would leave a 15-point gap—equivalent to leakage of roughly a quarter point of GDP per year on a $47 billion annual spending envelope. A demand-heavy surge would also add macro pressure if it runs ahead of labour, materials, and procurement capacity. A rough rule of thumb equates a sustained $25 billion fiscal impulse with an offsetting 25 bp policy rate hike. These are highly stylized but show the risks of spending that outruns domestic capacity.
Defence is only one part of a much wider federal investment push. It remains unclear how much of the strategy is genuinely incremental, how much falls within NATO’s scope, and how much overlaps with planned spending on energy security, critical minerals, housing, infrastructure, and productivity-enhancing private investment. Our best guess is that there is considerable overlap in the figures above, but the sheer scale still raises the bar for prioritization, sequencing, and absorption capacity.
BEYOND THE 5% BENCHMARK
Canada’s implementation challenge also points to a broader alliance question. NATO needs not only more spending, but stronger coordination of effort across allies. The new 5% target is directionally right, but the 3.5%/1.5% split may be too rigid if it treats broader security investment as a capped residual rather than a strategic contribution.
Nor should the 3.5% bucket reflect a legacy view of rearmament alone. Core platforms still matter, but modern warfare is increasingly multi-domain, shaped by drones, sensors, satellites, cyber resilience, data, and integrated air and missile defence alongside traditional assets. A target structure that favours heavier spending on legacy platforms risks conflating volume with relevance. The alliance needs more military capability, but also the right mix—spending that is faster to field, better matched to the threat environment, and more effective in strengthening deterrence and industrial capacity.
Energy weaponization has moved from risk to reality since that target was set less than a year ago. Energy security, critical minerals, resilient infrastructure, and supply chains are now integral to military readiness and industrial resilience, not adjacent. NATO should keep core military capacity as the anchor, but its 5% framework should be flexible enough not to crowd out investments that may do more to strengthen national resilience and allied security. It should also leave allies room to contribute where they add the most strategic value.
For Canada, that means pressing for a framework that better recognizes investments in energy, minerals, Arctic infrastructure, ports, grids, and resilient supply chains, and ensures the 1.5% bucket functions as a floor for strategic investment, not an effective ceiling in a world of fiscal constraints, implementation bottlenecks, and hard choices.
NATO’s 2029 review is a natural checkpoint, but the case for that conversation may come sooner.
MOVE FAST, SPEND WELL, THINK BROAD
Canada must move quickly, but it must also move tactically. In a more dangerous world, a larger defence effort is unavoidable. The real test is whether scarce fiscal room is translated into military capability, domestic capacity, and long-run resilience—not simply a higher spending ratio. Canada should scale core defence spending as quickly as credible absorption allows, while pressing NATO to ensure its 5% framework acts as a catalyst for high-value strategic investment, rather than a rigid structure that crowds out the very investments that could leave Canada and its allies stronger and more resilient.
1 NATO spending targets are reported on a cash basis, while federal fiscal accounts are presented on an accrual basis. That matters most for capital spending: NATO’s cash basis captures the outlay when the purchase is made, while accrual accounting spreads the cost over the asset’s useful life through amortization.
DISCLAIMER
This report has been prepared by Scotiabank Economics as a resource for the clients of Scotiabank. Opinions, estimates and projections contained herein are our own as of the date hereof and are subject to change without notice. The information and opinions contained herein have been compiled or arrived at from sources believed reliable but no representation or warranty, express or implied, is made as to their accuracy or completeness. Neither Scotiabank nor any of its officers, directors, partners, employees or affiliates accepts any liability whatsoever for any direct or consequential loss arising from any use of this report or its contents.
These reports are provided to you for informational purposes only. This report is not, and is not constructed as, an offer to sell or solicitation of any offer to buy any financial instrument, nor shall this report be construed as an opinion as to whether you should enter into any swap or trading strategy involving a swap or any other transaction. The information contained in this report is not intended to be, and does not constitute, a recommendation of a swap or trading strategy involving a swap within the meaning of U.S. Commodity Futures Trading Commission Regulation 23.434 and Appendix A thereto. This material is not intended to be individually tailored to your needs or characteristics and should not be viewed as a “call to action” or suggestion that you enter into a swap or trading strategy involving a swap or any other transaction. Scotiabank may engage in transactions in a manner inconsistent with the views discussed this report and may have positions, or be in the process of acquiring or disposing of positions, referred to in this report.
Scotiabank, its affiliates and any of their respective officers, directors and employees may from time to time take positions in currencies, act as managers, co-managers or underwriters of a public offering or act as principals or agents, deal in, own or act as market makers or advisors, brokers or commercial and/or investment bankers in relation to securities or related derivatives. As a result of these actions, Scotiabank may receive remuneration. All Scotiabank products and services are subject to the terms of applicable agreements and local regulations. Officers, directors and employees of Scotiabank and its affiliates may serve as directors of corporations.
Any securities discussed in this report may not be suitable for all investors. Scotiabank recommends that investors independently evaluate any issuer and security discussed in this report, and consult with any advisors they deem necessary prior to making any investment.
This report and all information, opinions and conclusions contained in it are protected by copyright. This information may not be reproduced without the prior express written consent of Scotiabank.
™ Trademark of The Bank of Nova Scotia. Used under license, where applicable.
Scotiabank, together with “Global Banking and Markets”, is a marketing name for the global corporate and investment banking and capital markets businesses of The Bank of Nova Scotia and certain of its affiliates in the countries where they operate, including; Scotiabank Europe plc; Scotiabank (Ireland) Designated Activity Company; Scotiabank Inverlat S.A., Institución de Banca Múltiple, Grupo Financiero Scotiabank Inverlat, Scotia Inverlat Casa de Bolsa, S.A. de C.V., Grupo Financiero Scotiabank Inverlat, Scotia Inverlat Derivados S.A. de C.V. – all members of the Scotiabank group and authorized users of the Scotiabank mark. The Bank of Nova Scotia is incorporated in Canada with limited liability and is authorised and regulated by the Office of the Superintendent of Financial Institutions Canada. The Bank of Nova Scotia is authorized by the UK Prudential Regulation Authority and is subject to regulation by the UK Financial Conduct Authority and limited regulation by the UK Prudential Regulation Authority. Details about the extent of The Bank of Nova Scotia's regulation by the UK Prudential Regulation Authority are available from us on request. Scotiabank Europe plc is authorized by the UK Prudential Regulation Authority and regulated by the UK Financial Conduct Authority and the UK Prudential Regulation Authority.
Scotiabank Inverlat, S.A., Scotia Inverlat Casa de Bolsa, S.A. de C.V, Grupo Financiero Scotiabank Inverlat, and Scotia Inverlat Derivados, S.A. de C.V., are each authorized and regulated by the Mexican financial authorities.
Not all products and services are offered in all jurisdictions. Services described are available in jurisdictions where permitted by law.