- Canadian Parliamentarians narrowly passed Prime Minister Carney’s budget bill on November 17th. Touted as transformational ahead of its November 4th drop, the plan ultimately polarized opinion—viewed insufficient by some and excessive by others.
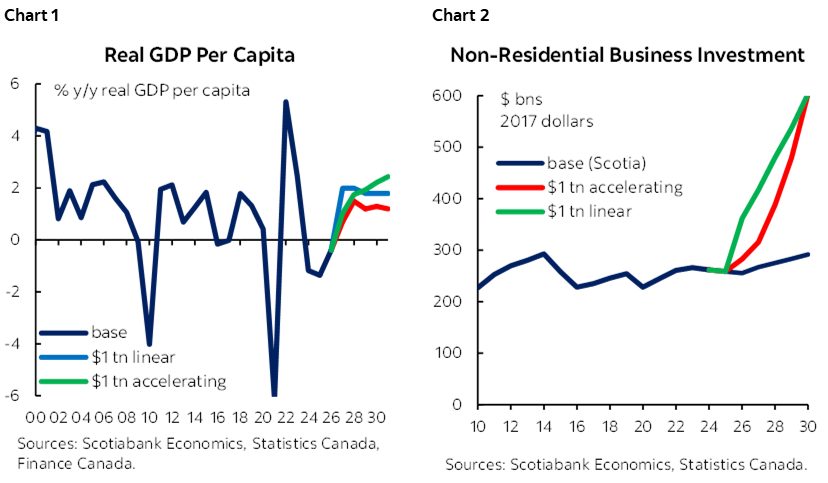
- Time will be the final arbiter but there should be little doubt that the trillion dollar promise is very ambitious. If achieved, it would drive meaningful improvements in living standards consistent with our earlier call for a 2% GDP per capita growth target with an accompanying accountability framework (chart 1).
- While the government stops short of binding itself to this trillion dollar target, the Prime Minister and Finance Minister are hanging their hats on it (and more) in their post-budget roadshow. We will track it as such.
- This brief note sets out the numbers and the math behind the plethora of pledges presented in the plan. The numbers mostly add up on paper—and the recent string of major projects announcements is very promising—but real-world challenges are enormous.
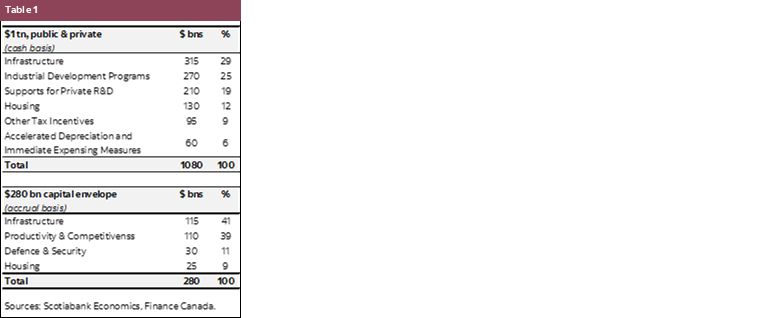
- Canada’s new policy agenda has the potential to be transformative, but its success hinges on businesses and investors—domestic and international—stepping up. Meeting the target would suggest a rough doubling of annual capital investment within five years (chart 2). Success would also depend not only on capital but on talent and disciplined delivery where Canada doesn’t have a great track record.
- For now, we will be watching for momentum before upgrading our outlook as noted in our post-budget forecast update—and of course reflecting the relatively benign incremental reveal on budget day itself.
AIMING HIGH
Ottawa has reframed Canada’s growth story as an investment one. The budget headline is blunt: the federal government aims to leverage its new capital framework—with a $279 bn fiscal backing ($451 bn on a cash basis)—to unlock $1 tn in total investments over the five-year horizon. Private investment is expected to pitch in half of these outlays. Dispelling a first potential misconception off the bat, this plan reflects both existing and new policy efforts. (See Table 1 for key themes, as well as Annex 1 for further detail).
The textbook math is relatively straightforward. By the government’s estimates, $1 tn in capital investment over five years could lift real GDP by 3.5% above its baseline trajectory (or about $94 bn higher by 2030). A simple Cobb-Douglas framework (with a capital share of 0.3) implies an incremental $312 bn in that final year. Assuming a linear trajectory, the cumulative incremental capital investment over the five-year horizon amounts to just above $1 tn—averaging about $60 bn in annual incremental growth.
The math gets a bit fuzzier when explaining why this boost had not already been incorporated into baselines given much of plan was already in the pipeline: the distinction appears to hinge on regearing investments towards “high-return actions” that can create a “virtuous cycle of economic growth” through a “more dynamic and resilient economy”. (It may also reflect, in part, an earlier discount applied to best laid plans.)
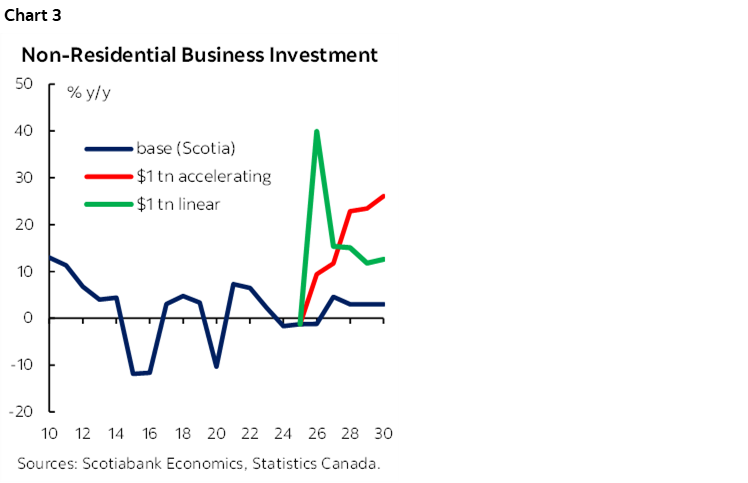
Its execution would be nothing short of transformational. Total fixed capital investment has hovered around $515 bn annually (2017 dollars)—about 80% private. Honing in further on the historically productive-enhancing component (non-residential business investment) private sector outlays have hovered in the $260–270 bn corridor in recent years—and governments between $80–90 bn. Meeting the aspirational trillion dollar target effectively suggests a doubling of private investment over the horizon with a sustained annual uptick potentially exceeding 20% in outer years (chart 3).
This level of ambition could have a meaningful impact on Canadians if achieved. The budget cites an average annual real GDP boost of $1,400 per Canadian. This would be consistent with Scotiabank Economics’ pre-election podium call for a 2% GDP per capita target. At that time, we acknowledged that such a growth target would be “staggering”, that it would require “audacious” capital investments, and “extraordinary coordination” across all policy levers and stakeholders with “little margin for distraction”.
This is effectively what the government has set out on paper. While Ottawa has stopped short of codifying this commitment in a formal accountability framework Scotiabank called for, the Prime Minister and Finance Minister are hanging their hats on this grand vision in their post-budget roadshow.
SHOW ME THE MONEY
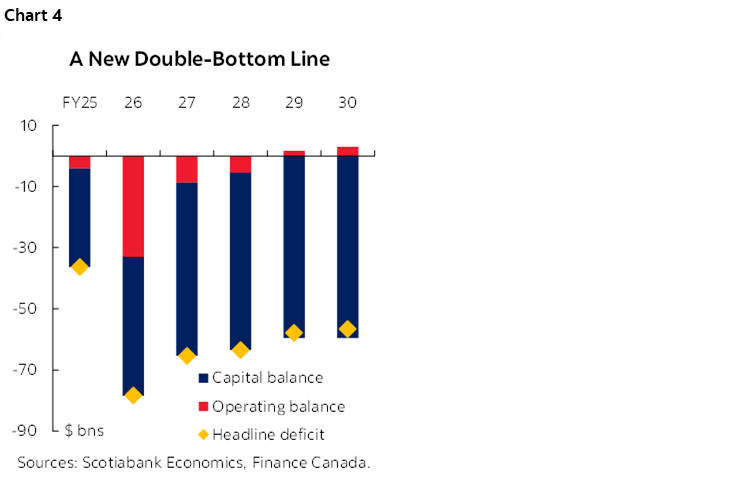
The capital framework sets the foundation for the growth agenda. This new fiscal accounting tool carves out long-term investment from day-to-day operating spending. The government plans to balance the operating budget by FY29, partially offsetting the ramp-up in capital spending that would leave medium-term deficits in the order of 1.5% of GDP over the medium term (chart 4).
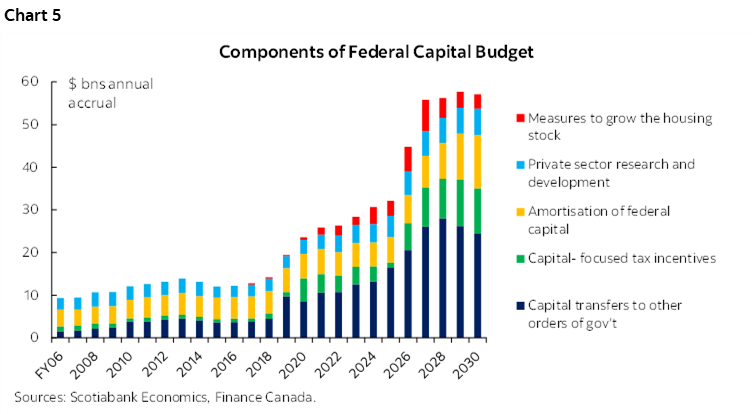
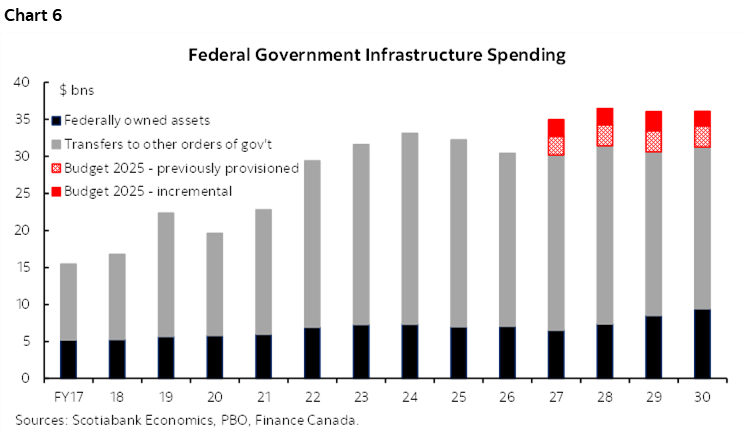
“Investment” is defined broadly. A made-in-Canada approach categorizes investment as an outlay that creates assets—public or private—ranging from traditionally-defined capital expenditures to more discretionary tools like tax incentives, housing supports, and conditional transfers. Almost half would be via transfers to other orders of government, notably infrastructure outlays where the provincial and municipal footprint is much greater (charts 5 & 6). This new approach supplements—not replaces—traditional reporting consistent with public sector accounting standards.
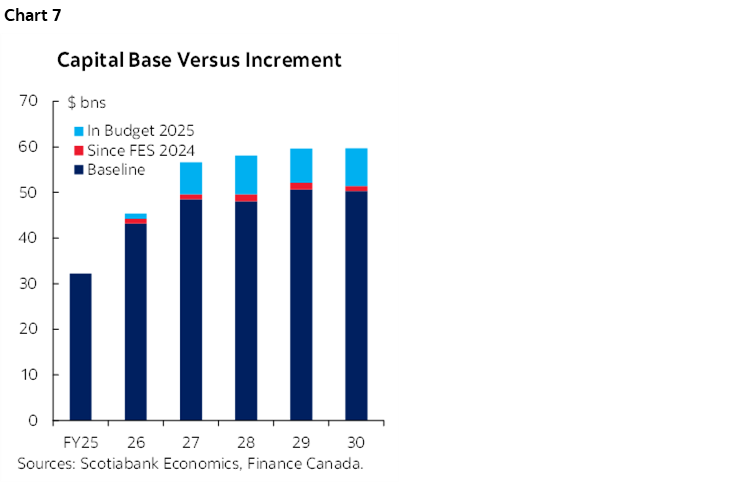
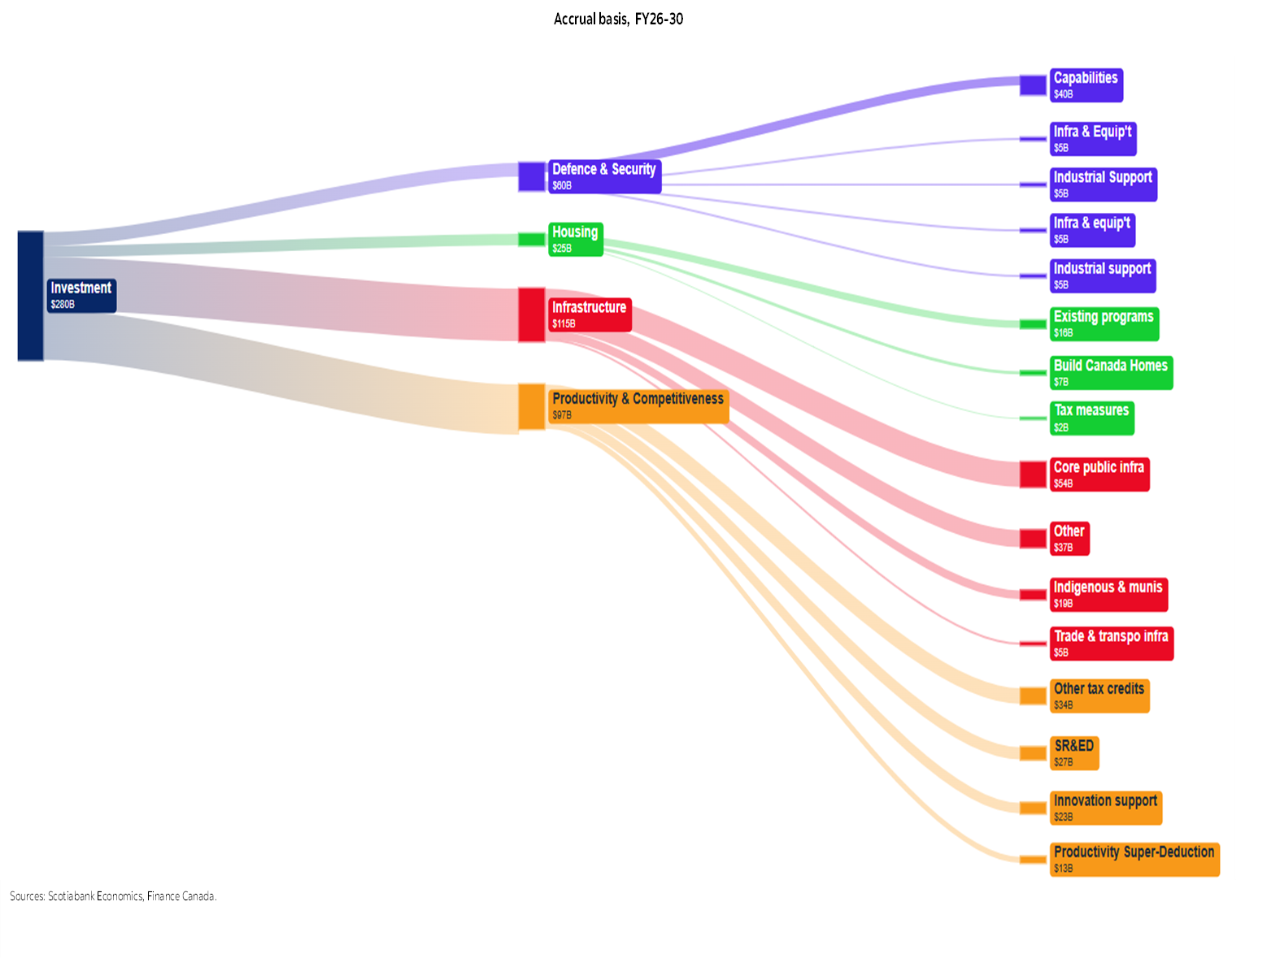
There is a tangle of numbers in the capital budget to clarify. The five-year capital envelope amounts to $279 bn in accrual terms (FY26–30). Annual capital commitments are set to near-double from an estimated $32 bn (accrual) in FY25 to almost $60 bn by FY30 (or 1.0% of GDP rising to 1.6% of GDP). However, only $39 bn (~14%) of the $279 bn is ‘new’ since the Carney government took office (chart 7).
These federal capital outlays are expected to crowd in private investment. The budget converts its $279 bn accrual envelope to $451 bn on a cash basis—the latter a better yardstick for scaling assumptions. Just over 60% of the federal government’s cash outlay (or $280 bn cash basis—not to be confused with the earlier $279 bn accrual total envelope) directly targets third parties. The net effect—in theory—would drive that $1 tn in total investment (cash basis) over five years, according to the government.
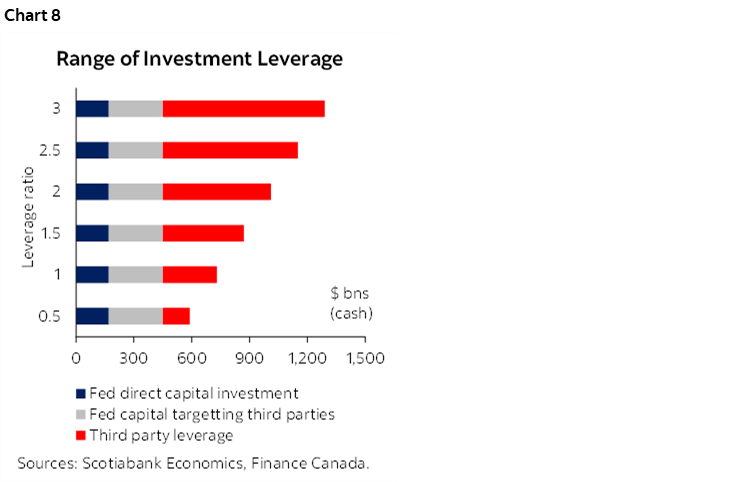
This is predicated on reasonably ambitious scale. Leverage ratios can vary by design to reflect policy intent, risk-sharing structures, and project complexity. In practice, they also shift with market conditions, investor appetite, and regulatory certainty. Ratios range widely—from less than 1:1 in recent subsidy programs to aspirational 3:1 targets at the Canada Infrastructure Bank—but global norms hover around the 1:1 to 2:1 range. The federal government’s capital envelope would need to be towards the higher end of this range to hit the $1 tn goal post—not unreasonable—but it relies on a lot going right (chart 8).
SHOW ME THE WAY
The regulatory agenda is equally if not more critical to scale. The federal government has introduced measures to streamline approvals for major projects, including a “one project, one review” approach to reduce duplication, a “one-window” system for permitting, and a commitment to reach federal decisions within two years (inclusive of environmental scoping). These changes are intended to cut red tape and provide greater certainty for proponents navigating complex regulatory processes—an important signal to investors that Canada is serious about accelerating project delivery—following decades of a near-unnavigable landscape.
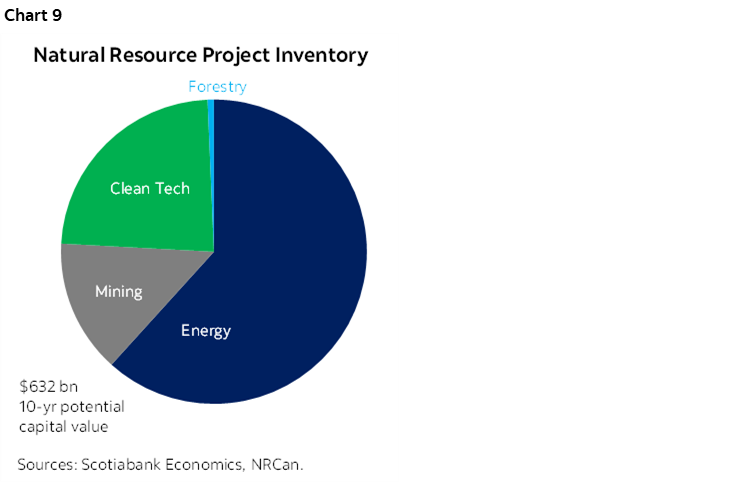
The new Major Projects Office is central to these efforts. By centralizing oversight, improving coordination, and facilitating financing, the Office aims to fast-track projects from concept to construction and help restore Canada’s reputation for delivering major projects at scale (and on time, on budget). The current referral pipeline reflects an estimated $115 bn in investment across 11 projects at various stages of development along with five “transformative strategies” (see Annex 2 from Scotiabank’s Equity Research team for details). This $115 bn would be cross-cutting within the overarching trillion dollar goal and compares meaningfully (in an oranges-to-tangerines sort of way) to the $635 bn 10-year major project pipeline tracked by Natural Resources Canada as of September 2024 (chart 9).
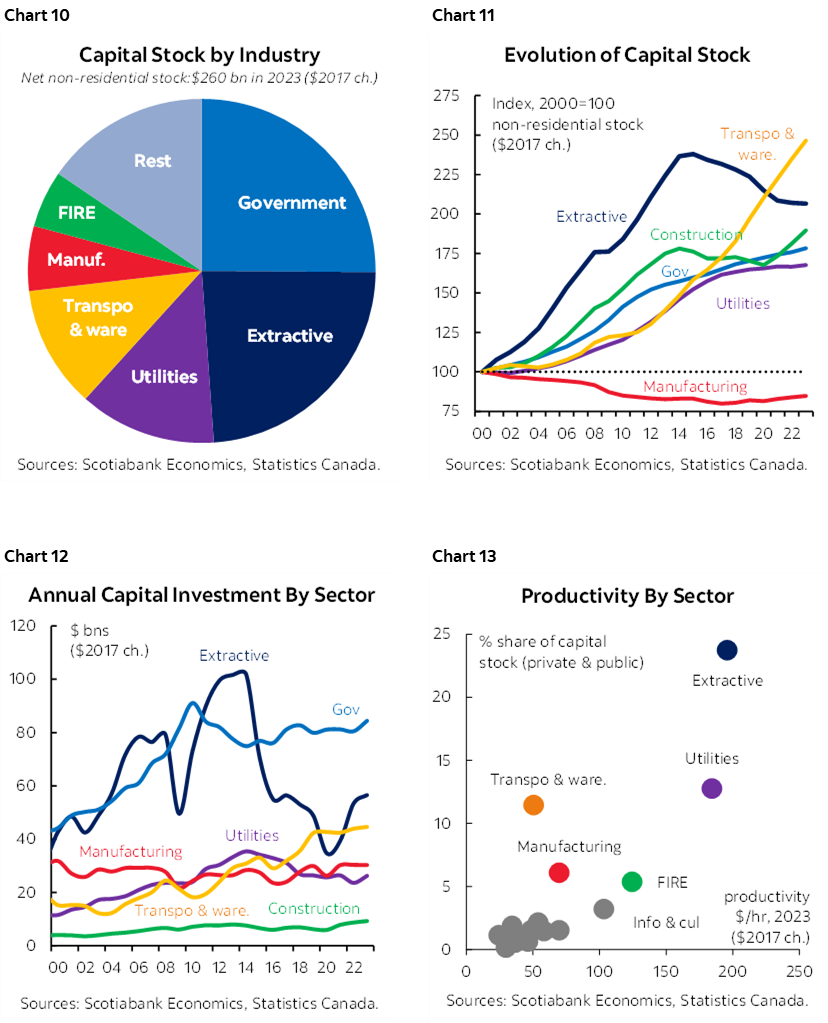
The investment agenda mostly targets sectors that punch above their weight in the Canadian economy. Extractive and utility sectors alone account for half of Canada’s private capital stock, while adding transportation, warehousing, and manufacturing brings that share to three-quarters. These sectors also rank among the most productive, yet investment trends have diverged sharply—transportation has surged since 2000, manufacturing has hollowed out, and utilities have stalled despite clear need. Simply restoring investment in extractives and utilities to prior peaks would add $50 bn, while returning government investment to its 2010 high would push the tally near $70 bn (charts 10–13). Meanwhile, the government’s push to double homebuilding rests on higher capital spending aimed at unlocking productivity gains in the construction sector.
PROOF IN THE PUDDING
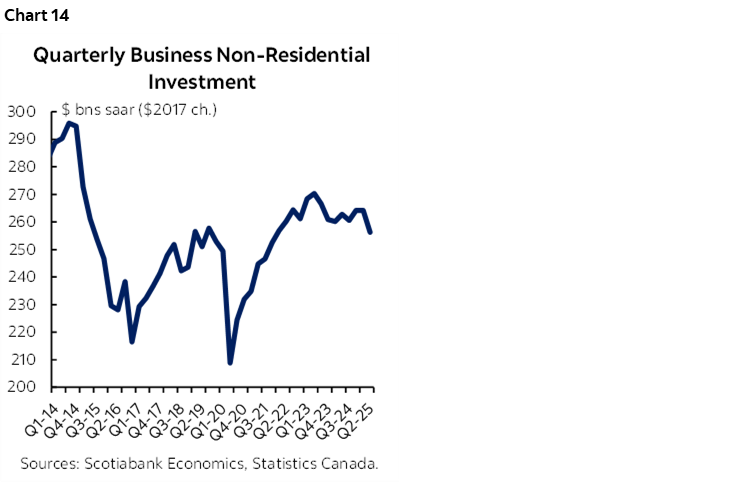
The math might be simple but execution isn’t. The government faces tremendous hurdles ahead, from skill-specific labour shortages to a well-documented history of chronic major project delays and cost overruns. The geo-political overlay has also otherwise dampened the investment environment (chart 14). Canada’s new policy agenda has the makings to be transformational, but it is contingent on business and investors coming to the table.
Hard work lays ahead. There is no shortcut to higher investment, greater competitiveness and higher welfare. Over time, disciplined execution should pay off if Canadians have the patience and resolve.
ANNEX 1: DETAILED BREAKDOWN OF FEDERAL CAPITAL ENVELOPE
ANNEX 2: SCOTIABANK’S EQUITY RESEARCH ON BUILDING CANADA INITIATIVES
Scotiabank’s Global Equity Research team has published four Focus On Building Canada reports:
- A Mari Usque ad Mare: Canada’s Nation-Building Project Opportunities and Potential Funding Mechanisms
- It Has Begun: Canada’s Five “Nation-Building” Projects
- The Grand Bargain: An Evaluation of Emissions, Economics, and Egress
- Digging Into Canada’s Second Tranche of “Nation-Building” Projects
These reports collectively evaluate projects, economics, and funding mechanisms. Please see your Scotiabank Global Banking and Markets representative for access to these reports.
– Patrick Bryden | Analyst
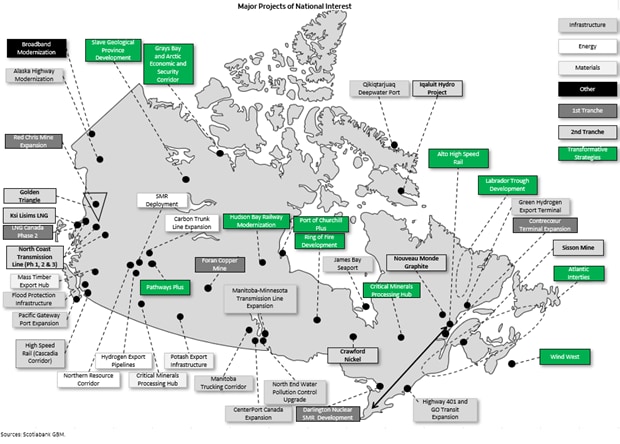
ANNEX 2: CONT’D: DETAILS ON MAJOR PROJECTS OF NATIONAL INTEREST

DISCLAIMER
This report has been prepared by Scotiabank Economics as a resource for the clients of Scotiabank. Opinions, estimates and projections contained herein are our own as of the date hereof and are subject to change without notice. The information and opinions contained herein have been compiled or arrived at from sources believed reliable but no representation or warranty, express or implied, is made as to their accuracy or completeness. Neither Scotiabank nor any of its officers, directors, partners, employees or affiliates accepts any liability whatsoever for any direct or consequential loss arising from any use of this report or its contents.
These reports are provided to you for informational purposes only. This report is not, and is not constructed as, an offer to sell or solicitation of any offer to buy any financial instrument, nor shall this report be construed as an opinion as to whether you should enter into any swap or trading strategy involving a swap or any other transaction. The information contained in this report is not intended to be, and does not constitute, a recommendation of a swap or trading strategy involving a swap within the meaning of U.S. Commodity Futures Trading Commission Regulation 23.434 and Appendix A thereto. This material is not intended to be individually tailored to your needs or characteristics and should not be viewed as a “call to action” or suggestion that you enter into a swap or trading strategy involving a swap or any other transaction. Scotiabank may engage in transactions in a manner inconsistent with the views discussed this report and may have positions, or be in the process of acquiring or disposing of positions, referred to in this report.
Scotiabank, its affiliates and any of their respective officers, directors and employees may from time to time take positions in currencies, act as managers, co-managers or underwriters of a public offering or act as principals or agents, deal in, own or act as market makers or advisors, brokers or commercial and/or investment bankers in relation to securities or related derivatives. As a result of these actions, Scotiabank may receive remuneration. All Scotiabank products and services are subject to the terms of applicable agreements and local regulations. Officers, directors and employees of Scotiabank and its affiliates may serve as directors of corporations.
Any securities discussed in this report may not be suitable for all investors. Scotiabank recommends that investors independently evaluate any issuer and security discussed in this report, and consult with any advisors they deem necessary prior to making any investment.
This report and all information, opinions and conclusions contained in it are protected by copyright. This information may not be reproduced without the prior express written consent of Scotiabank.
™ Trademark of The Bank of Nova Scotia. Used under license, where applicable.
Scotiabank, together with “Global Banking and Markets”, is a marketing name for the global corporate and investment banking and capital markets businesses of The Bank of Nova Scotia and certain of its affiliates in the countries where they operate, including; Scotiabank Europe plc; Scotiabank (Ireland) Designated Activity Company; Scotiabank Inverlat S.A., Institución de Banca Múltiple, Grupo Financiero Scotiabank Inverlat, Scotia Inverlat Casa de Bolsa, S.A. de C.V., Grupo Financiero Scotiabank Inverlat, Scotia Inverlat Derivados S.A. de C.V. – all members of the Scotiabank group and authorized users of the Scotiabank mark. The Bank of Nova Scotia is incorporated in Canada with limited liability and is authorised and regulated by the Office of the Superintendent of Financial Institutions Canada. The Bank of Nova Scotia is authorized by the UK Prudential Regulation Authority and is subject to regulation by the UK Financial Conduct Authority and limited regulation by the UK Prudential Regulation Authority. Details about the extent of The Bank of Nova Scotia's regulation by the UK Prudential Regulation Authority are available from us on request. Scotiabank Europe plc is authorized by the UK Prudential Regulation Authority and regulated by the UK Financial Conduct Authority and the UK Prudential Regulation Authority.
Scotiabank Inverlat, S.A., Scotia Inverlat Casa de Bolsa, S.A. de C.V, Grupo Financiero Scotiabank Inverlat, and Scotia Inverlat Derivados, S.A. de C.V., are each authorized and regulated by the Mexican financial authorities.
Not all products and services are offered in all jurisdictions. Services described are available in jurisdictions where permitted by law.