CANADA HOUSING MARKET: EVERYTHING IN MODERATION, EVEN HOUSING MARKET MODERATION
SUMMARY
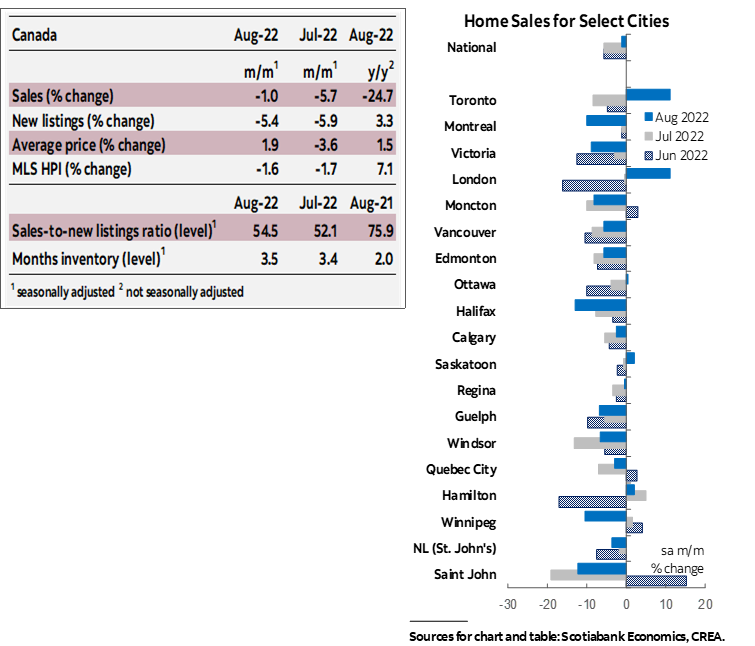
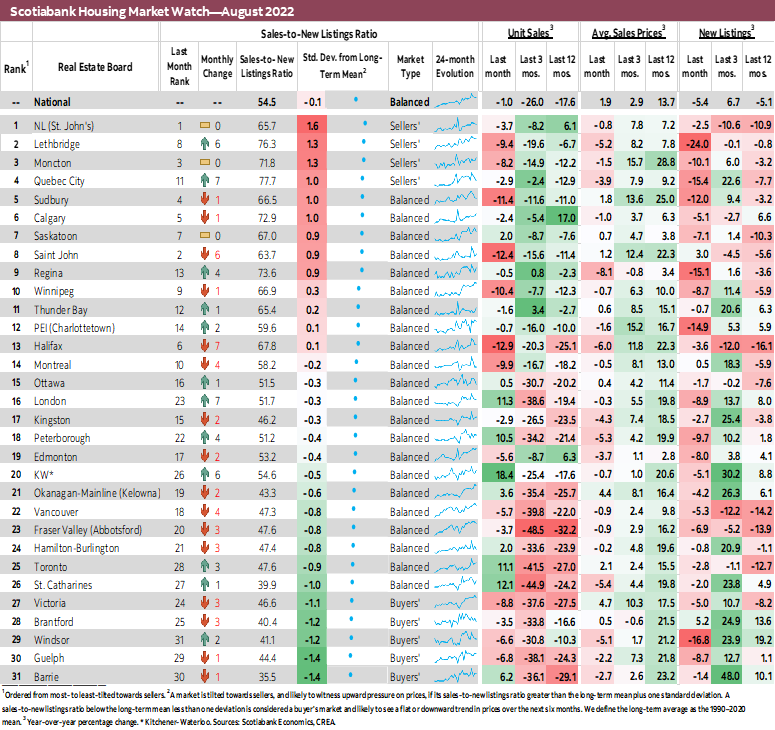
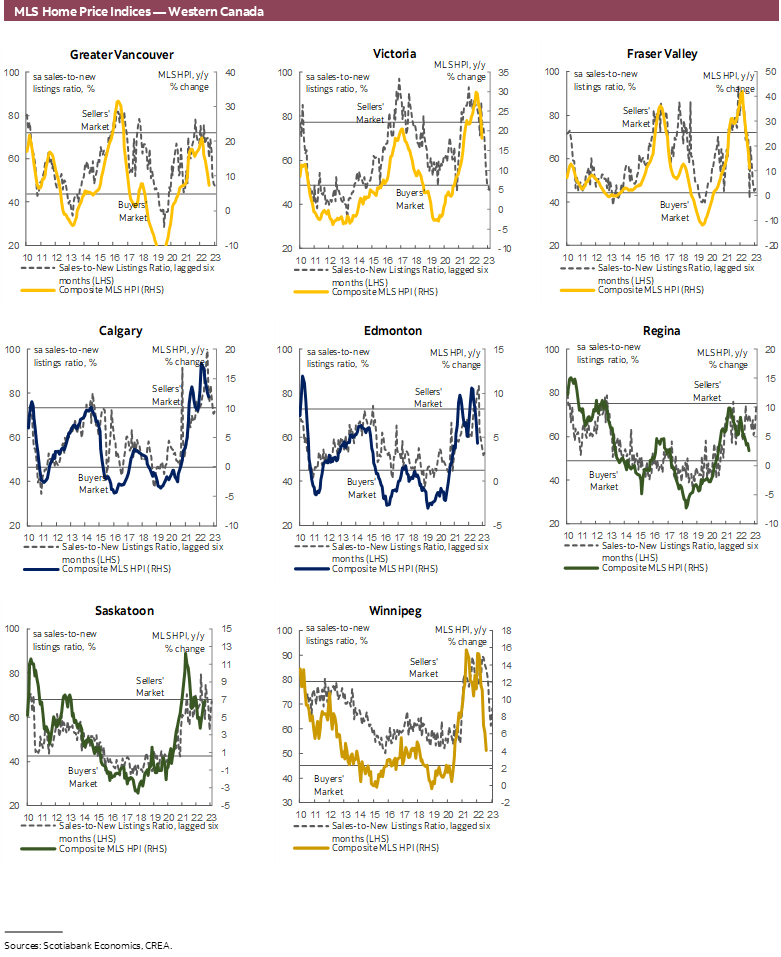
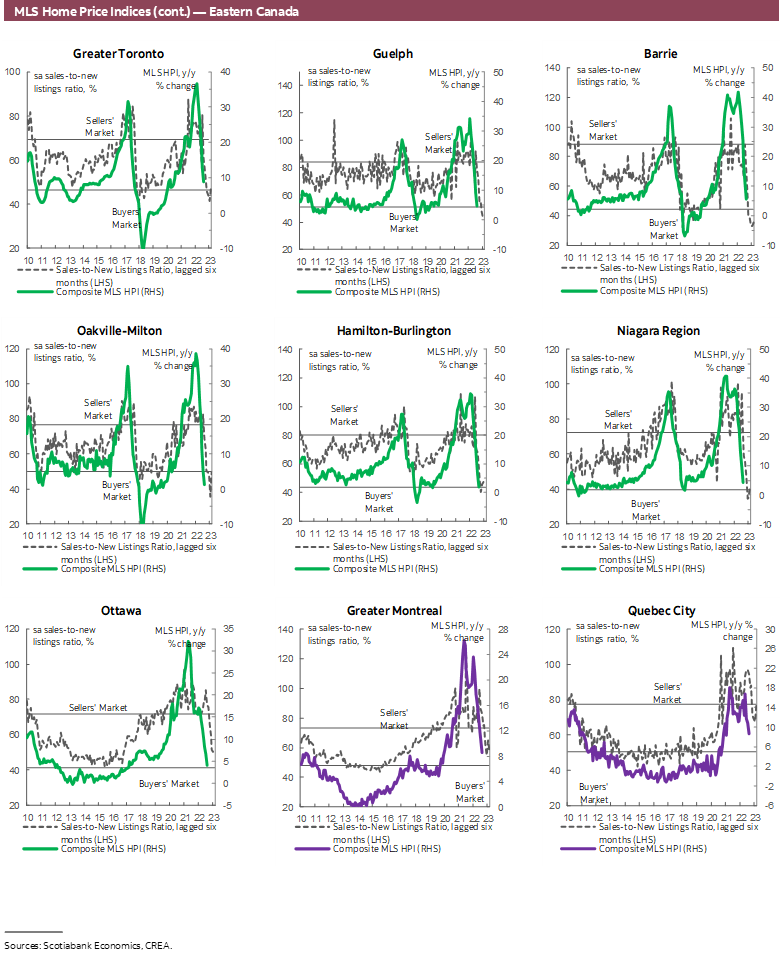
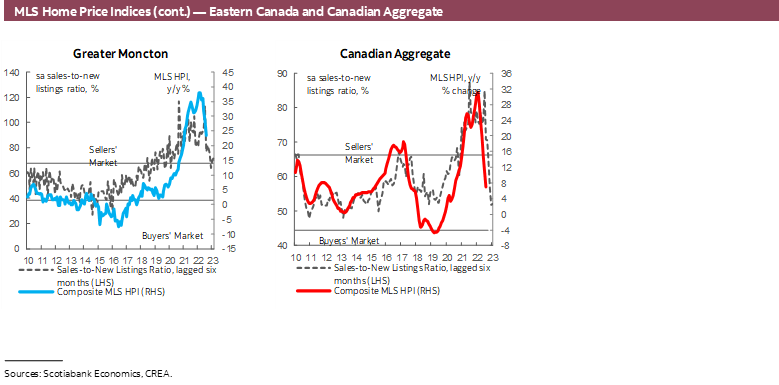
Canadian home sales fell for the sixth month in a row, dropping by 1% (sa m/m) in August, while listings retreated by 5.4% (sa m/m). As a result of the larger decline in listing relative to sales, the sales-to-new listings ratio, an indicator of how tight the market is, climbed up to 54.5%—still closely in line with its long-term average of 55.1%. Despite the small uptick in this ratio, the overall more balanced market conditions brought about another decline in the composite MLS Home Price Index (HPI), which edged down 1.6% (sa m/m) in August compared to July, a small deceleration from July’s 1.7% decline.
Sales fell in two-thirds of the local markets we track, with double digits gains in the GTA and other urban centers in Ontario offsetting declines elsewhere. The national decline brings the level of sales closer to pre-pandemic levels, with August’s sales hovering around 9% above the month’s long-term average.
Listings declined in almost all of our markets, causing markets to shift from buyers’ territory and back to balanced. 22 of our local centres, including all large markets, are now in balanced territory, while only four remain in sellers’ territory. Months of inventory continued to climb up from its record lows, reaching 3.5 months in August — still below its long-term average of 5 months, but much higher than its all-time low of 1.7 months.
For the third month in a row, single-family homes led the decline in prices—measured by the MLS Home Price Index (HPI)—while apartments continued to lag in pace. Apartments are better able to hold value as they increasingly become the more affordable option in a rising-rate environment. While the composite MLS HPI for all home types is down 7% from February 2022, for apartments it is a mere 1% below its February 2022 level. In annual terms, the composite MLS HPI was up 16.2 (nsa y/y), above the composite increase of 7.1% (nsa y/y)—a marked deceleration from just a few months ago, when it was up by 30% (nsa y/y) in January and February 2022.
IMPLICATIONS
Housing markets in Canada continued their adjustment in response to changing market and policy conditions in August. Since the Bank of Canada began hiking its policy rate in March of this year, national sales have declined by 32%, bringing them closer to pre-pandemic levels. The average selling prices slightly pared down some of the past few months’ declines in August, ending the month 16% below its February 2022 peak, but 16% above its February 2020 level—right before the pandemic started.
Focusing on changes in the average selling price could be misleading, however, as it does not indicate a change in the value of the average home—it is simply taking the total dollar value of the sales in a single month divided by the total number of units sold in a single month. Fluctuations in the average selling price therefore can overestimate movements in the market as more people shift to smaller, more affordable units as they get priced out of larger, more expensive, ones. The MLS House Price Index (HPI), a much more reliable measure that accounts for differences in house type and size, is only 7% below the February 2022 peak and remains 41% above pre-pandemic levels. August saw the average selling price increase while the MLS HPI trended downwards—such opposite monthly movements in the two measures suggest a greater share of more expensive homes sold in August.
Supply-demand conditions have been easing in many parts of the country, with the national market now in balanced territory. The recalibration in the housing market has so far been a reasonably orderly—and welcome—process, with many factors, including higher mortgage rates, leading to less demand for homes and creating much more balanced markets than seen earlier this year.
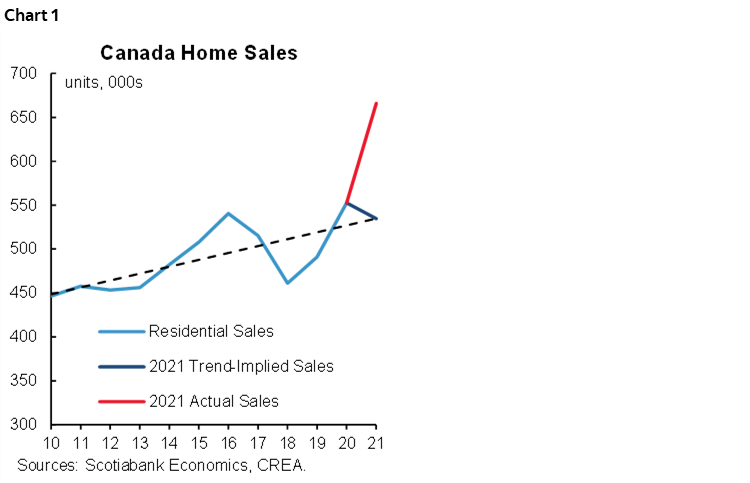
Murtaza Haider from the Urban Analytics Institute made the interesting point that a simple trend line of the number of sales over the past decade, notwithstanding covid disruptions in 2020, suggests we should’ve seen roughly 530,000 units sold in 2021. Actual units sold in 2021 were over 130,000 above the trend-suggested level, however (chart 1), despite the rate of population growth that year being the slowest in a decade, which he prescribes to forward buying. Some of the sales that would’ve happened this year happened last year, and those who advanced their purchases won’t be back to the market this year. Therefore, the slowdown in sales volume this year relative to last is at least partly due to this advancement in demand, and not entirely due to the increase in mortgage rates.
In a note last month, René Lalonde and I show that last point to be true—we find the loss of purchasing power associated with higher inflation and input costs, along with the decline in equity markets, would have halted the demand for homes and generated a decline in home prices even if mortgage rates had not increased in response to monetary policy tightening. We estimate that if mortgage rates follow our forecast of the GoC 5-year bond yields, home prices could fall by around 23% from their 2022Q1 peak by end of 2023. This is not as dramatic as it may seem, however, as home prices would still be over 11% above their pre-pandemic levels, hovering around their December 2020 levels. Of course, the potential for further tightening reinforces downward price pressures—a scenario that Derek Holt sees as more likely with the recently announced Canadian fiscal stimulus likely adding pressures on measures of core inflation relative to what would have otherwise occurred and hence aggravating the Bank of Canada’s stance on monetary policy.
In any case, housing markets across the country are expected to continue to moderate into next year. The speed at which the moderation is occurring might seem alarming right now, particularly as they coincide with a changing and uncertain macroeconomic environment, in addition to worsening consumer sentiment. But this speed is related to many factors (discussed in detail in previous reports, see here for example), including heightened sensitivity to increased rates, investors’ activity, urgent sales, shifts in buyers’ psychology, and self-reinforcing expectations of price declines. But once those settle in, we can expect a more comfortable pace of adjustment. In fact, while August’s decline was the sixth monthly decline in a row, it was the smallest as the size of the decline has been tapering each month.
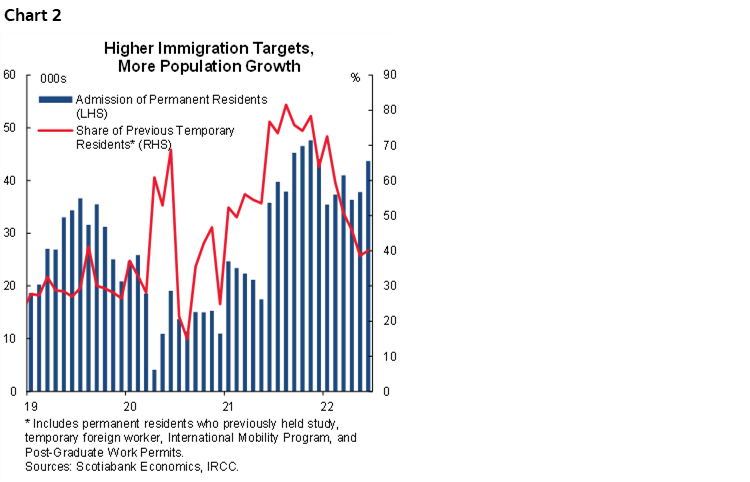
And in the longer term, demand fundamentals, including the acceleration of immigration and the existing challenges to increasing supply, are expected to put a floor on the adjustment. This is particularly true as higher immigration targets in the next few years should translate to higher population growth relative to 2021. Unlike last year, when the government met its immigration target mostly by making already-in-Canada temporary residents permanent, effectively generating no population growth, this year’s target is increasingly being met by newcomers arriving in the country (chart 2). This means that the following years’ immigration targets will actually translate to more population growth and more demand for housing, whether owned or rented. The latter segment will see more immediate pressure as most newcomers rent during their first few years of arrival, adding to an already heated rental market, and incentivizing some investors to re-enter the market.
DISCLAIMER
This report has been prepared by Scotiabank Economics as a resource for the clients of Scotiabank. Opinions, estimates and projections contained herein are our own as of the date hereof and are subject to change without notice. The information and opinions contained herein have been compiled or arrived at from sources believed reliable but no representation or warranty, express or implied, is made as to their accuracy or completeness. Neither Scotiabank nor any of its officers, directors, partners, employees or affiliates accepts any liability whatsoever for any direct or consequential loss arising from any use of this report or its contents.
These reports are provided to you for informational purposes only. This report is not, and is not constructed as, an offer to sell or solicitation of any offer to buy any financial instrument, nor shall this report be construed as an opinion as to whether you should enter into any swap or trading strategy involving a swap or any other transaction. The information contained in this report is not intended to be, and does not constitute, a recommendation of a swap or trading strategy involving a swap within the meaning of U.S. Commodity Futures Trading Commission Regulation 23.434 and Appendix A thereto. This material is not intended to be individually tailored to your needs or characteristics and should not be viewed as a “call to action” or suggestion that you enter into a swap or trading strategy involving a swap or any other transaction. Scotiabank may engage in transactions in a manner inconsistent with the views discussed this report and may have positions, or be in the process of acquiring or disposing of positions, referred to in this report.
Scotiabank, its affiliates and any of their respective officers, directors and employees may from time to time take positions in currencies, act as managers, co-managers or underwriters of a public offering or act as principals or agents, deal in, own or act as market makers or advisors, brokers or commercial and/or investment bankers in relation to securities or related derivatives. As a result of these actions, Scotiabank may receive remuneration. All Scotiabank products and services are subject to the terms of applicable agreements and local regulations. Officers, directors and employees of Scotiabank and its affiliates may serve as directors of corporations.
Any securities discussed in this report may not be suitable for all investors. Scotiabank recommends that investors independently evaluate any issuer and security discussed in this report, and consult with any advisors they deem necessary prior to making any investment.
This report and all information, opinions and conclusions contained in it are protected by copyright. This information may not be reproduced without the prior express written consent of Scotiabank.
™ Trademark of The Bank of Nova Scotia. Used under license, where applicable.
Scotiabank, together with “Global Banking and Markets”, is a marketing name for the global corporate and investment banking and capital markets businesses of The Bank of Nova Scotia and certain of its affiliates in the countries where they operate, including; Scotiabank Europe plc; Scotiabank (Ireland) Designated Activity Company; Scotiabank Inverlat S.A., Institución de Banca Múltiple, Grupo Financiero Scotiabank Inverlat, Scotia Inverlat Casa de Bolsa, S.A. de C.V., Grupo Financiero Scotiabank Inverlat, Scotia Inverlat Derivados S.A. de C.V. – all members of the Scotiabank group and authorized users of the Scotiabank mark. The Bank of Nova Scotia is incorporated in Canada with limited liability and is authorised and regulated by the Office of the Superintendent of Financial Institutions Canada. The Bank of Nova Scotia is authorized by the UK Prudential Regulation Authority and is subject to regulation by the UK Financial Conduct Authority and limited regulation by the UK Prudential Regulation Authority. Details about the extent of The Bank of Nova Scotia's regulation by the UK Prudential Regulation Authority are available from us on request. Scotiabank Europe plc is authorized by the UK Prudential Regulation Authority and regulated by the UK Financial Conduct Authority and the UK Prudential Regulation Authority.
Scotiabank Inverlat, S.A., Scotia Inverlat Casa de Bolsa, S.A. de C.V, Grupo Financiero Scotiabank Inverlat, and Scotia Inverlat Derivados, S.A. de C.V., are each authorized and regulated by the Mexican financial authorities.
Not all products and services are offered in all jurisdictions. Services described are available in jurisdictions where permitted by law.