CANADA HOUSING MARKET: CONTINUE TO TREND UP … NOT SO FOR PRICES
SUMMARY
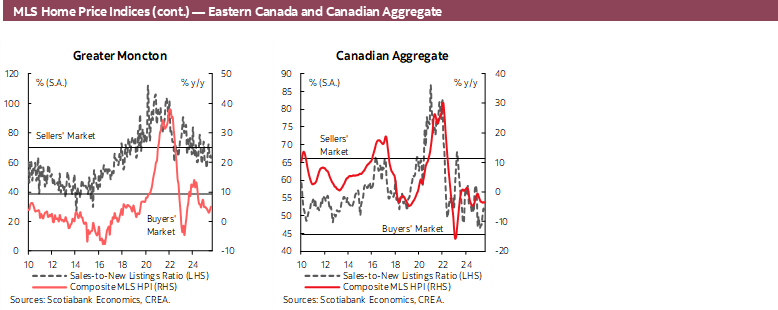
National housing sales posted a fifth consecutive increase in August. The sales-to-new listings ratio edged down nationally from July to August as new listings rose at a faster pace than sales. The national MLS House Price Index declined mildly in August, hence still on its downward trend since summer of 2023.
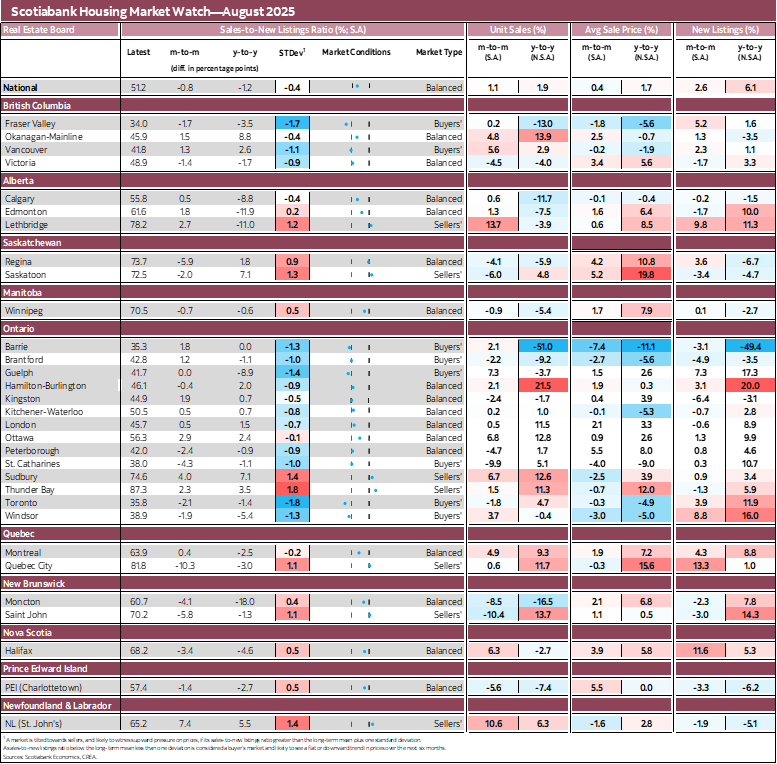
Housing sales rose 1.1% (sa) nationally from July to August, the fifth consecutive monthly gain since their most recent trough in March of this year. The cumulative increase in national sales since March is 12.5%, but they were 7.4% weaker in August than their most recent peak achieved last November. In August, national sales rose 1.9% (nsa) from their level in the same month of 2024. New listings increased 2.6% from July to August (sa) and by 6.1% (nsa) since August 2024. They have been mostly trending up since early 2023 and were approaching in August their level just before the Bank of Canada started tightening its policy rate in March 2022.
With the rising pace of national new listings exceeding that of sales in August, the national sales-to-new listings ratio edged down from 52% in July to 51.2% in August. This indicator of housing market conditions has been in the lower half of our estimated balanced conditions’ range (of between 44.7 and 66.1%) since 2025 began. The other indicator of market conditions—months of inventory—stayed unchanged from July to August at 4.4 (sa figures), still below its pre-pandemic long-term average of 5.2. This indicator of market conditions has eased since its most recent trough in November 2024 when it was at 3.7.
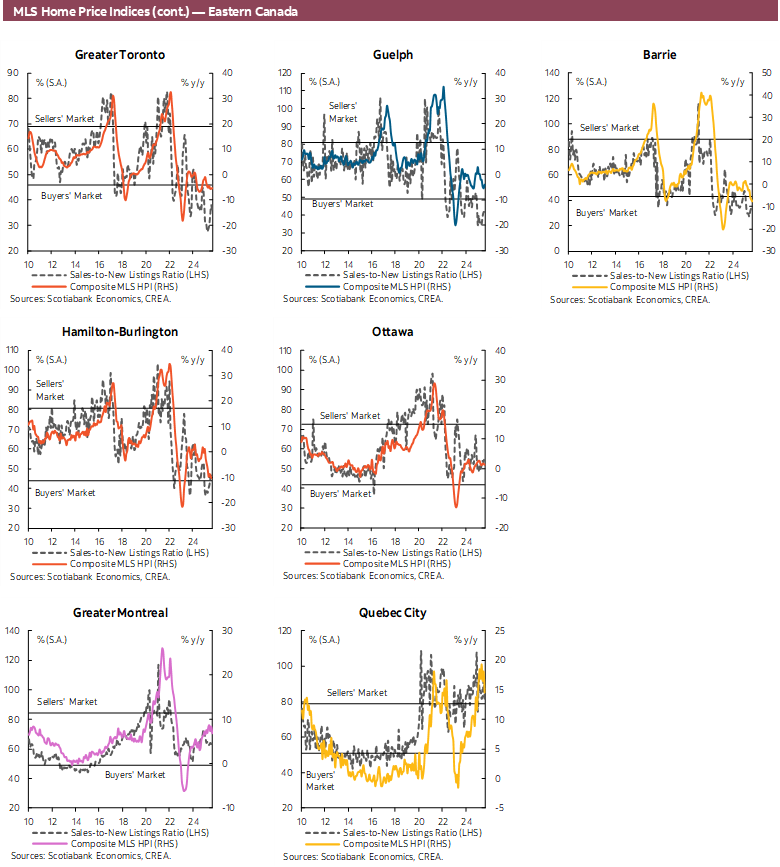
The national MLS House Price Index (HPI) edged down -0.1% (sa) from July to August with all unit types contributing to this monthly decline, except for 1-storey singles (+0.2%). 2-storey singles and apartment units both posted a -0.2% monthly decline in August while townhouse units declined -0.3%. From August 2024 to August 2025, the MLS HPI declined -3.4% (nsa), and all unit types contributed to this annual decline. The largest annual declines were observed for apartments (-5.3%) and townhouses (-4.6%) while the smallest decline was observed for 1-storey single units (-1.1%). The National MLS HPI in August was near 18% below its March 2022 level (sa figures)—the month when the Bank of Canada started tightening its policy stance—and more than 26% above its pre-pandemic (December 2019) level.
Sales increased in about 60% of local markets we track from July to August while new listings increased in near 55% of them. Market conditions—as measured by the sales-to-new listings ratio—eased in just below 50% of these local markets over this period.
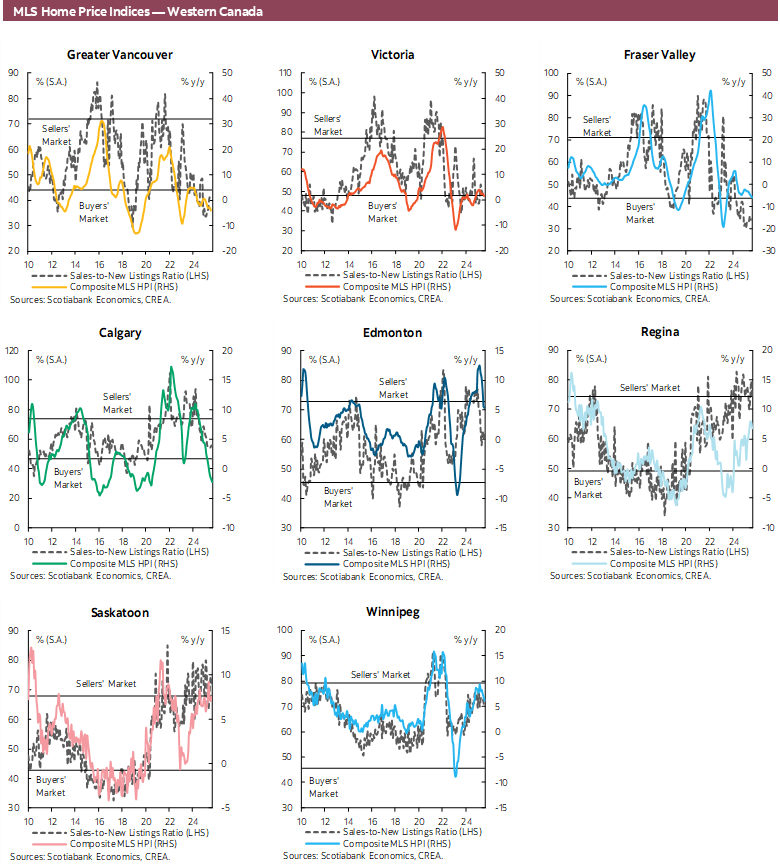
Housing resale conditions—as measured by the sales-to-new listings ratio—were deemed balanced for just over half of the local markets we monitor in August, and buyers’ favourable for slightly over 1/4 of them and all in British Columbia and Ontario, as was the case for July.
The strongest rise in unit sales from July to August was observed in Lethbridge (13.7% sa), followed by St. John’s (NL; 10.6%). The largest monthly declines in sales in August was observed in St John (NB; -10.4%) and in St. Catharines (-9.9%).
IMPLICATIONS
The upward trend in national sales that started in April continued in August, adding support to our assumption of trade-uncertainty fatigue mentioned in our previous reports, suggesting potential buyers have been looking through this uncertainty since spring. But this improvement must still show up in market conditions before we start seeing a sustained recovery in the MLS HPI. The combination of a sales-to-new listings ratio in the lower half of its balanced conditions’ range and a weak trend (and declining) performance for the MLS HPI suggest that the unobserved underlying strength of housing demand is not yet sufficient to generate a recovery in the MLS HPI. Hence, additional rise in demand significantly outpacing that of new listings will be needed to push the MLS HPI up.
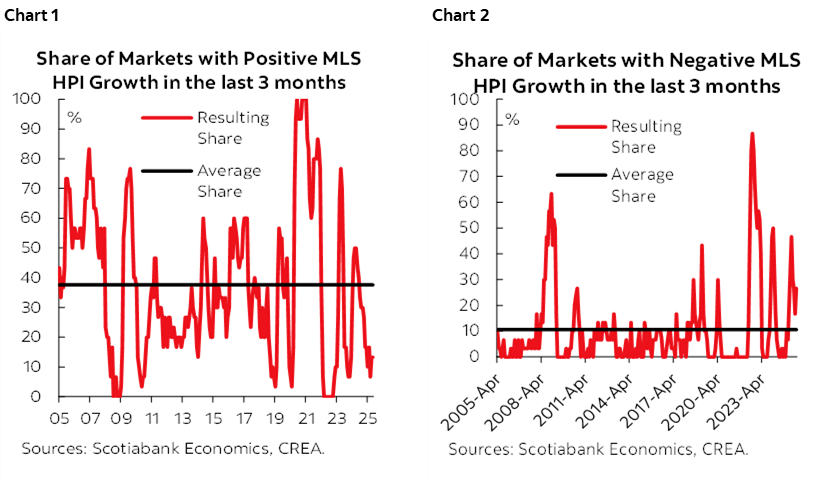
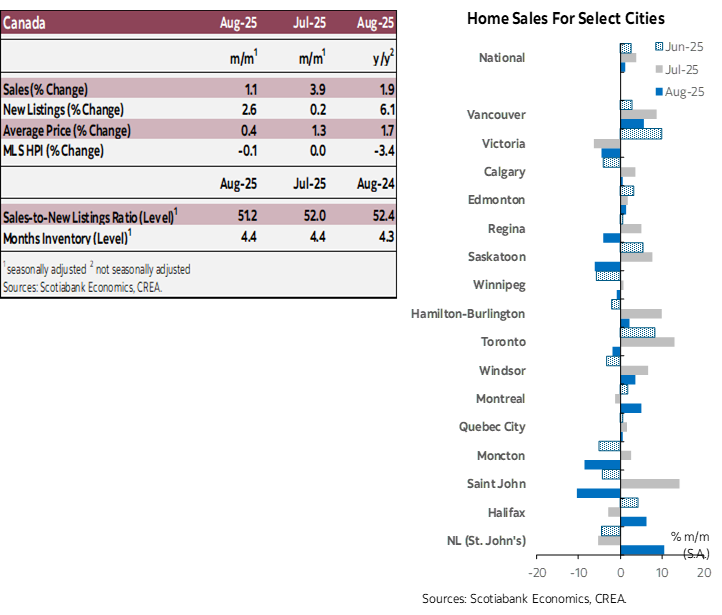
The absence of recovery in the MLS HPI is also shared by most local markets that report this indicator. Charts 1 and 2 provide information about the state of recovery in the MLS HPI across these markets. Chart 1 shows the ratio (in %) of local markets that posted an increase in their MLS HPI in each of the last three months while chart 2 shows this ratio but for price declines over same period, along with their respective average over the shown period (horizontal lines). These ratios are informative about the breadth of a potential price recovery across local markets. From these charts, the weakness in the MLS HPI is significantly spread over these local markets as the ratio showing an increase in each of the last three months is currently well below its period average while the ratio of those showing a decline in the previous three months is well above average.
DISCLAIMER
This report has been prepared by Scotiabank Economics as a resource for the clients of Scotiabank. Opinions, estimates and projections contained herein are our own as of the date hereof and are subject to change without notice. The information and opinions contained herein have been compiled or arrived at from sources believed reliable but no representation or warranty, express or implied, is made as to their accuracy or completeness. Neither Scotiabank nor any of its officers, directors, partners, employees or affiliates accepts any liability whatsoever for any direct or consequential loss arising from any use of this report or its contents.
These reports are provided to you for informational purposes only. This report is not, and is not constructed as, an offer to sell or solicitation of any offer to buy any financial instrument, nor shall this report be construed as an opinion as to whether you should enter into any swap or trading strategy involving a swap or any other transaction. The information contained in this report is not intended to be, and does not constitute, a recommendation of a swap or trading strategy involving a swap within the meaning of U.S. Commodity Futures Trading Commission Regulation 23.434 and Appendix A thereto. This material is not intended to be individually tailored to your needs or characteristics and should not be viewed as a “call to action” or suggestion that you enter into a swap or trading strategy involving a swap or any other transaction. Scotiabank may engage in transactions in a manner inconsistent with the views discussed this report and may have positions, or be in the process of acquiring or disposing of positions, referred to in this report.
Scotiabank, its affiliates and any of their respective officers, directors and employees may from time to time take positions in currencies, act as managers, co-managers or underwriters of a public offering or act as principals or agents, deal in, own or act as market makers or advisors, brokers or commercial and/or investment bankers in relation to securities or related derivatives. As a result of these actions, Scotiabank may receive remuneration. All Scotiabank products and services are subject to the terms of applicable agreements and local regulations. Officers, directors and employees of Scotiabank and its affiliates may serve as directors of corporations.
Any securities discussed in this report may not be suitable for all investors. Scotiabank recommends that investors independently evaluate any issuer and security discussed in this report, and consult with any advisors they deem necessary prior to making any investment.
This report and all information, opinions and conclusions contained in it are protected by copyright. This information may not be reproduced without the prior express written consent of Scotiabank.
™ Trademark of The Bank of Nova Scotia. Used under license, where applicable.
Scotiabank, together with “Global Banking and Markets”, is a marketing name for the global corporate and investment banking and capital markets businesses of The Bank of Nova Scotia and certain of its affiliates in the countries where they operate, including; Scotiabank Europe plc; Scotiabank (Ireland) Designated Activity Company; Scotiabank Inverlat S.A., Institución de Banca Múltiple, Grupo Financiero Scotiabank Inverlat, Scotia Inverlat Casa de Bolsa, S.A. de C.V., Grupo Financiero Scotiabank Inverlat, Scotia Inverlat Derivados S.A. de C.V. – all members of the Scotiabank group and authorized users of the Scotiabank mark. The Bank of Nova Scotia is incorporated in Canada with limited liability and is authorised and regulated by the Office of the Superintendent of Financial Institutions Canada. The Bank of Nova Scotia is authorized by the UK Prudential Regulation Authority and is subject to regulation by the UK Financial Conduct Authority and limited regulation by the UK Prudential Regulation Authority. Details about the extent of The Bank of Nova Scotia's regulation by the UK Prudential Regulation Authority are available from us on request. Scotiabank Europe plc is authorized by the UK Prudential Regulation Authority and regulated by the UK Financial Conduct Authority and the UK Prudential Regulation Authority.
Scotiabank Inverlat, S.A., Scotia Inverlat Casa de Bolsa, S.A. de C.V, Grupo Financiero Scotiabank Inverlat, and Scotia Inverlat Derivados, S.A. de C.V., are each authorized and regulated by the Mexican financial authorities.
Not all products and services are offered in all jurisdictions. Services described are available in jurisdictions where permitted by law.