CANADA HOUSING MARKET: NATIONAL HOUSING CONDITIONS STILL NEED FIRMING UP AS OUR KEY HOUSE PRICE INDICATOR CONTINUED ITS DOWNWARD TREND IN NOVEMBER
SUMMARY
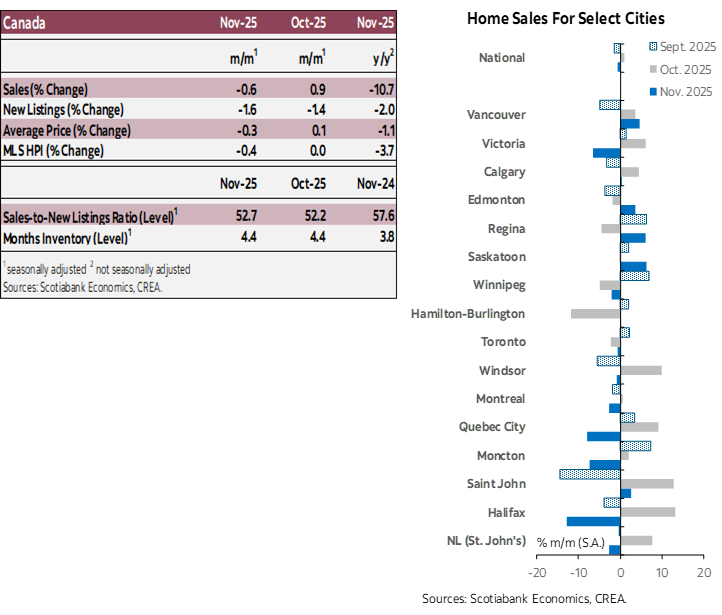
National housing sales (in units) declined in November. They have been essentially flat since July when looking through the inherent volatility of these data. The sales-to-new listings ratio—one indicator of market tightness—edged up from October to November as new listings posted a larger decline than sales. The MLS House Price Index continued in November the downward trend it has been displaying for above 2 years.
Unit sales declined -0.6% (sa figures) from October to November. They have declined from November 2024—their most recent peak—to March 2025 in the wake of rising global trade tensions triggered by the new U.S. administration. This negatively impacted housing demand from rising uncertainty about future economic and income conditions. Sales recovered in Spring but have essentially stayed flat near their July level since. Compared to the same month in 2024, sales fell 10.7% (nsa) in November.
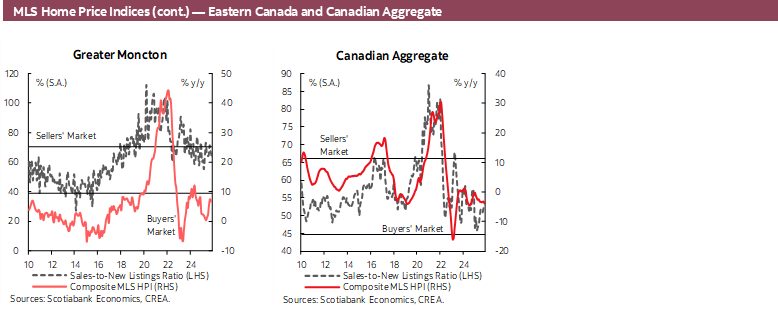
New listings posted a third consecutive monthly decline in November at -1.6% (sa) and were -2.0% (nsa) below their November 2024 level. With this monthly decline in new listings exceeding that of sales, the sales-to-new listing ratio—an indicator of market conditions—edged up from 52.2% in October to 52.7% in November, but still within the lower half of our estimated range for balanced conditions. And with sales posting a worst progression than new listings since November 2024, the sales-to-new listings ratio lost 4.9 percentage points over this period, reflecting a softening in resale market conditions.
The national MLS House Price Index (HPI) continued its downward trend in November, declining -0.4% (sa) from October and -3.7% since November 2024 (nsa). In November, this index was 18.4% below its February 2022 historical high (from sa figures)—just before the Bank of Canada started its policy rate hike cycle to reduce elevated inflation—but 27.4% higher than its pre-pandemic (December 2019) level.
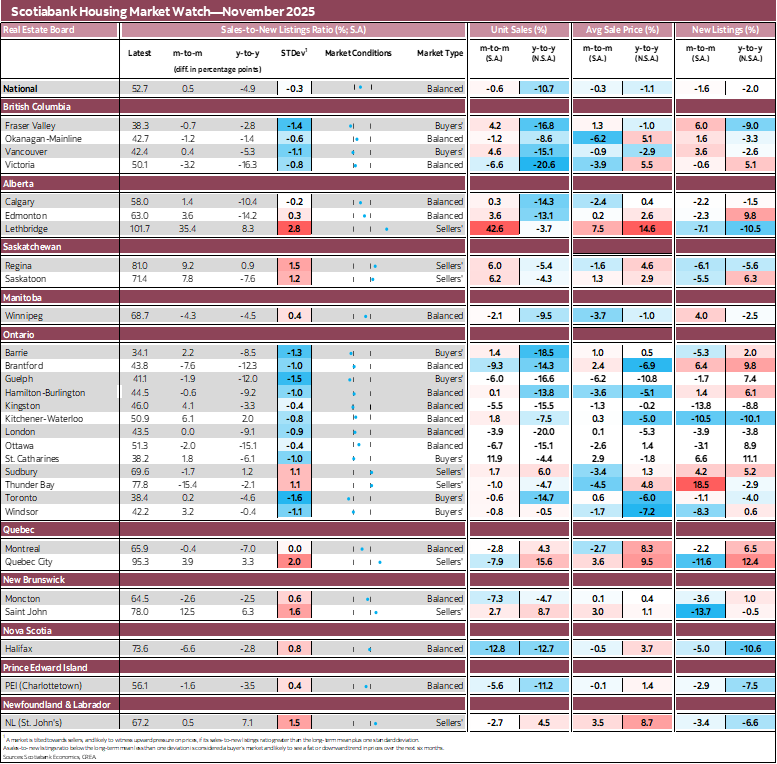
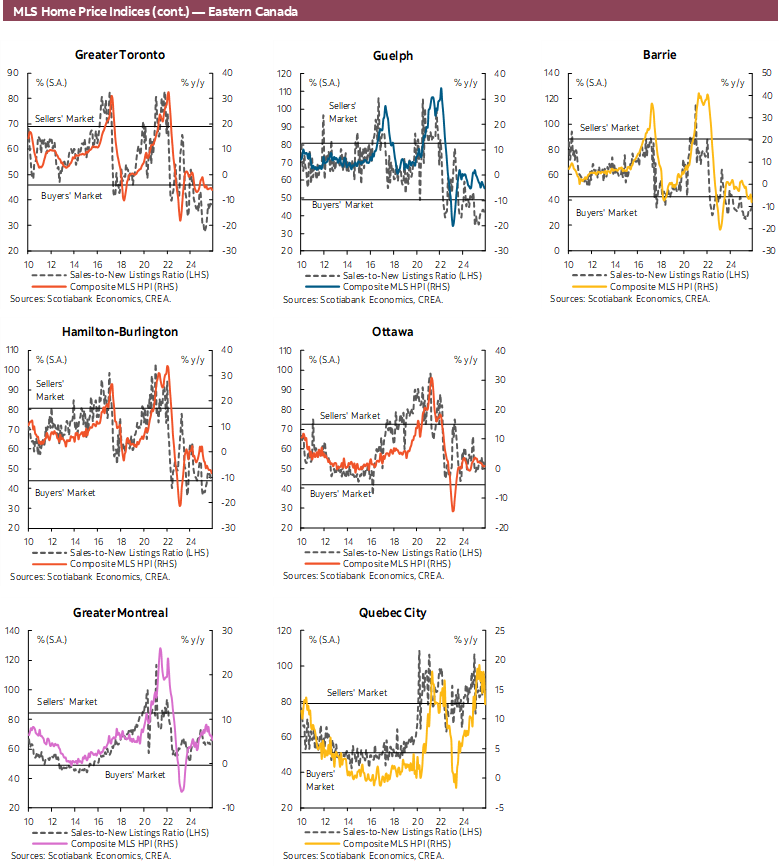
Sales declined in 17 of the reported local markets we monitor1 from October to November while the sales-to-new listings ratio tightened for 15 of them. However, from November 2024 to November 2025, this indicator of market conditions softened in more than ¾ of these markets.
Market conditions were deemed balanced in 15 of the reported local markets we track in November and favouring buyers in 7 of these markets and favouring sellers in 8 of them. Strongest monthly declines in November sales were observed for Halifax (-12.8% sa), Brantford (-9.3%) and Quebec City (-7.9%). Sharpest increases in sales were observed for Lethbridge (42.6%), and St. Catharines (11.9%).
IMPLICATIONS
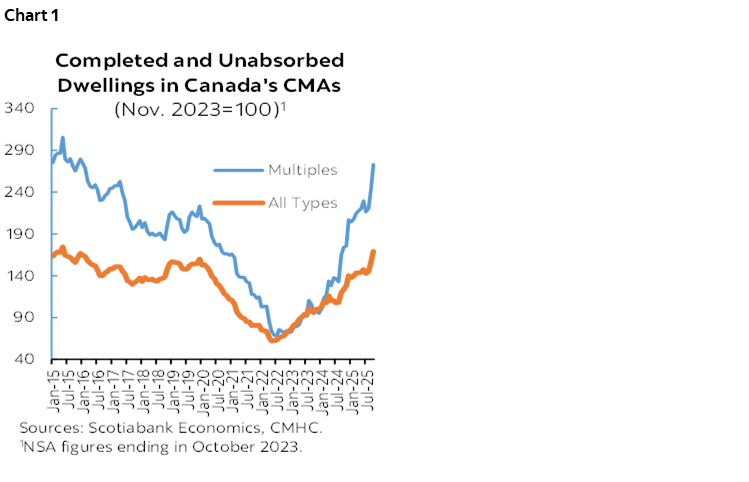
Housing market conditions are still relatively soft, thereby contributing in November to the trend decline in the MLS HPI since fall of 2023. These easy conditions are reflected by the sales-to-new listings ratio in the lower half of our estimated range for balanced conditions (from 44.7 to 66.1%) since then, and the sharp rise in recently completed and unabsorbed dwellings in Census Metropolitan Areas over this period, and in 2025, with strong contribution from multi-dwelling units (chart 1). We do not expect these easy market conditions to tighten significantly enough in the coming months to generate a significant reversal in the MLS HPI.
At most, we see a modest rise in this price index in 2026 roughly in line with inflation in consumer prices. We expect a modest tightening in housing market conditions from the past decline in mortgage rates and fading headwinds from global trade tensions, including through reduced uncertainty about income conditions for potential buyers. Of course, unexpected policy announcements by the U.S. could revert these fading headwinds, thereby leading to additional softening in housing market conditions and prices.
1 November 2025 information was incomplete for Peterborough at the time of producing this report. Therefore, this market is not included in the Housing Market Watch table.
DISCLAIMER
This report has been prepared by Scotiabank Economics as a resource for the clients of Scotiabank. Opinions, estimates and projections contained herein are our own as of the date hereof and are subject to change without notice. The information and opinions contained herein have been compiled or arrived at from sources believed reliable but no representation or warranty, express or implied, is made as to their accuracy or completeness. Neither Scotiabank nor any of its officers, directors, partners, employees or affiliates accepts any liability whatsoever for any direct or consequential loss arising from any use of this report or its contents.
These reports are provided to you for informational purposes only. This report is not, and is not constructed as, an offer to sell or solicitation of any offer to buy any financial instrument, nor shall this report be construed as an opinion as to whether you should enter into any swap or trading strategy involving a swap or any other transaction. The information contained in this report is not intended to be, and does not constitute, a recommendation of a swap or trading strategy involving a swap within the meaning of U.S. Commodity Futures Trading Commission Regulation 23.434 and Appendix A thereto. This material is not intended to be individually tailored to your needs or characteristics and should not be viewed as a “call to action” or suggestion that you enter into a swap or trading strategy involving a swap or any other transaction. Scotiabank may engage in transactions in a manner inconsistent with the views discussed this report and may have positions, or be in the process of acquiring or disposing of positions, referred to in this report.
Scotiabank, its affiliates and any of their respective officers, directors and employees may from time to time take positions in currencies, act as managers, co-managers or underwriters of a public offering or act as principals or agents, deal in, own or act as market makers or advisors, brokers or commercial and/or investment bankers in relation to securities or related derivatives. As a result of these actions, Scotiabank may receive remuneration. All Scotiabank products and services are subject to the terms of applicable agreements and local regulations. Officers, directors and employees of Scotiabank and its affiliates may serve as directors of corporations.
Any securities discussed in this report may not be suitable for all investors. Scotiabank recommends that investors independently evaluate any issuer and security discussed in this report, and consult with any advisors they deem necessary prior to making any investment.
This report and all information, opinions and conclusions contained in it are protected by copyright. This information may not be reproduced without the prior express written consent of Scotiabank.
™ Trademark of The Bank of Nova Scotia. Used under license, where applicable.
Scotiabank, together with “Global Banking and Markets”, is a marketing name for the global corporate and investment banking and capital markets businesses of The Bank of Nova Scotia and certain of its affiliates in the countries where they operate, including; Scotiabank Europe plc; Scotiabank (Ireland) Designated Activity Company; Scotiabank Inverlat S.A., Institución de Banca Múltiple, Grupo Financiero Scotiabank Inverlat, Scotia Inverlat Casa de Bolsa, S.A. de C.V., Grupo Financiero Scotiabank Inverlat, Scotia Inverlat Derivados S.A. de C.V. – all members of the Scotiabank group and authorized users of the Scotiabank mark. The Bank of Nova Scotia is incorporated in Canada with limited liability and is authorised and regulated by the Office of the Superintendent of Financial Institutions Canada. The Bank of Nova Scotia is authorized by the UK Prudential Regulation Authority and is subject to regulation by the UK Financial Conduct Authority and limited regulation by the UK Prudential Regulation Authority. Details about the extent of The Bank of Nova Scotia's regulation by the UK Prudential Regulation Authority are available from us on request. Scotiabank Europe plc is authorized by the UK Prudential Regulation Authority and regulated by the UK Financial Conduct Authority and the UK Prudential Regulation Authority.
Scotiabank Inverlat, S.A., Scotia Inverlat Casa de Bolsa, S.A. de C.V, Grupo Financiero Scotiabank Inverlat, and Scotia Inverlat Derivados, S.A. de C.V., are each authorized and regulated by the Mexican financial authorities.
Not all products and services are offered in all jurisdictions. Services described are available in jurisdictions where permitted by law.