CANADA HOUSING MARKET: MARKET CONDITIONS TIGHTENED IN OCTOBER, BUT HOUSE PRICES ARE STILL FACING HEADWINDS
SUMMARY
After a decline in September, housing sales in October were back on their upward trend that started last April. This sales performance and a decline in new listings contributed to tighten the sales-to-new listings ratio in October. Also, during that month, the national MLS House Price Index posted its first monthly rise—albeit modest—since November 2024.
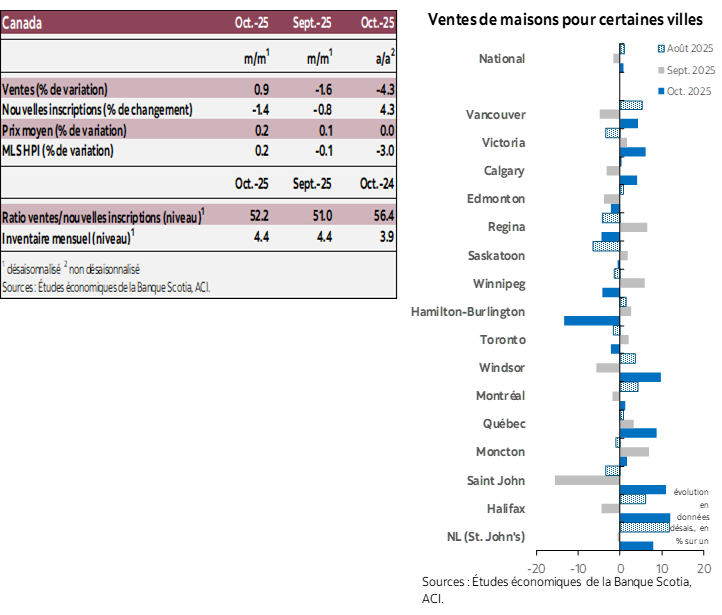
Unit sales rose nationally by 0.9% (sa figures) from September to October, partially offsetting the -1.6% decline from August to September. Sales are back on the upward trend they have been exhibiting since their most recent trough in March of this year when economic uncertainty was rising with trade tensions. From the same month in 2024, sales declined -4.3% (nsa) in October. National new listings posted a -1.4% (sa) monthly decline in October, the second in a row with a -0.8% decline in the previous month. Despite these monthly declines, new listings have been generally trending up in 2025, and in October were higher by 4.3% (nsa) than in the same month in 2024.
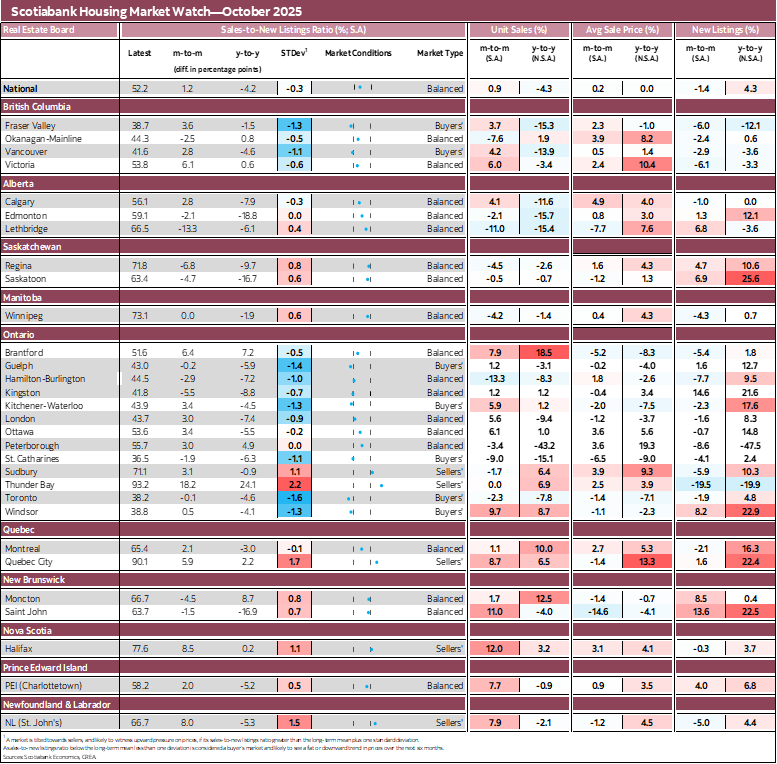
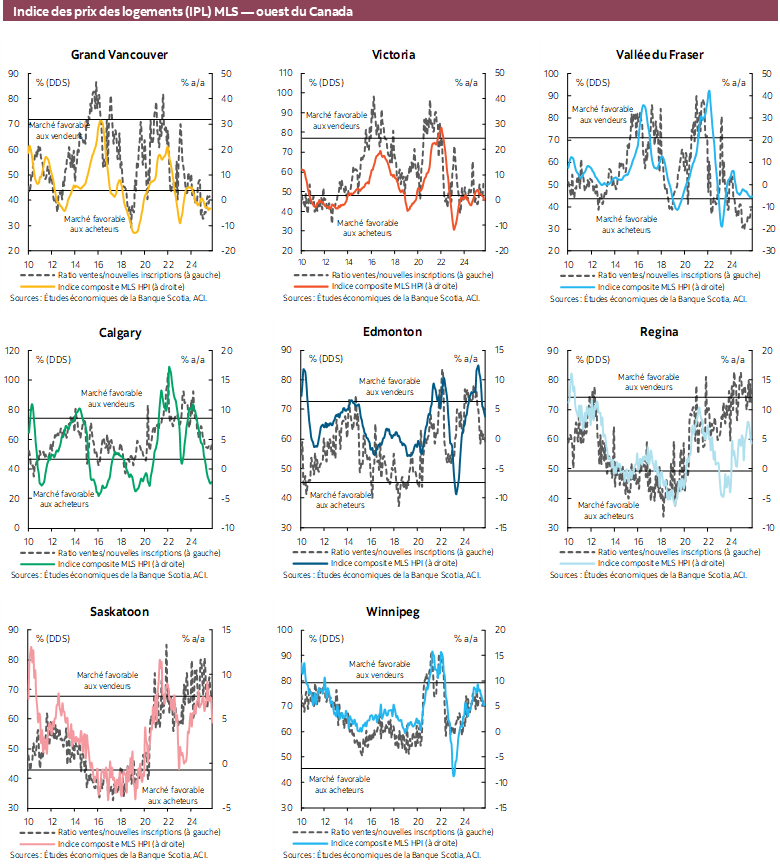
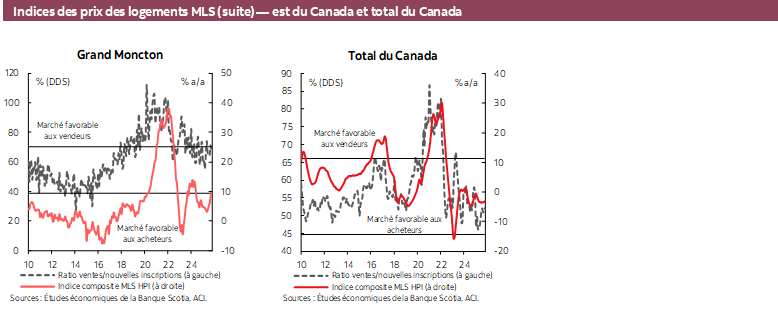
With the monthly rise in national (unit) sales and the decline in new listings, the sales-to-new listings ratio tightened (rose) by 1.2 percentage point in October to 52.2% (sa), still in the lower half of the estimated balanced conditions range for this indicator. The other indicator of market tightness we track—months of inventory—was at 4.4 nationally in October (sa figures), mostly stable at that level since July of this year, and below its 5.2 long-term (pre-pandemic) average. As in previous months, this market-tightness indicator was below its long-term average in most provinces, except in British Columbia and Ontario at 0.9 months above this average for both.
For the first time since November 2024, the national MLS House Price Index (MLS HPI) posted a monthly rise in October, but relatively modest at +0.2% (sa). This price index declined -3.0% (nsa) from the same month last year and, from sa figures, is now 26.7% above its December 2019 level but nearly 18% below its February 2022 historical peak.
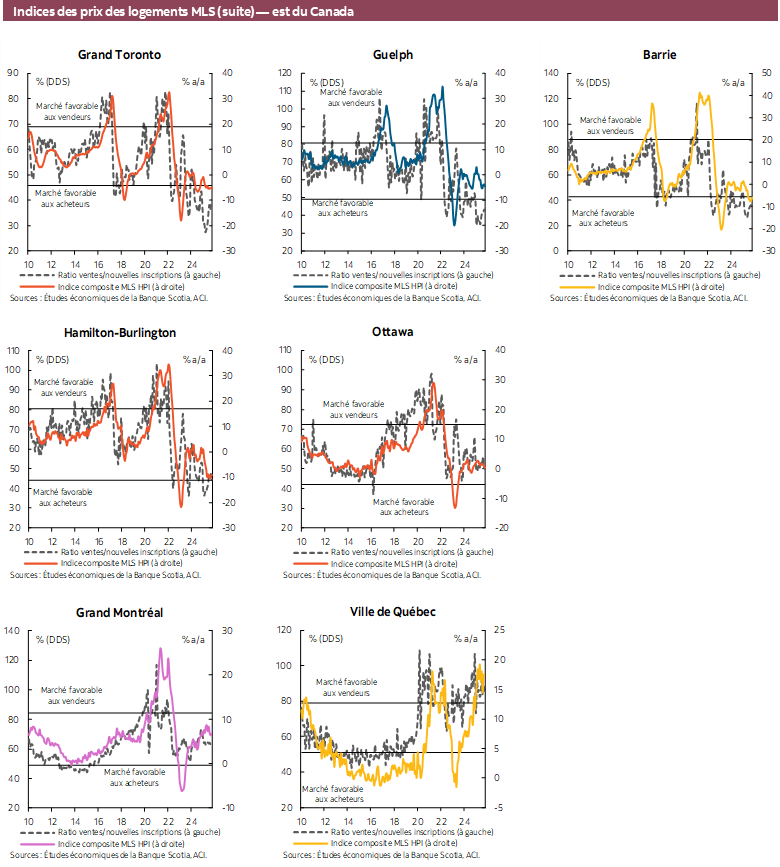
From September to October 2025, sales increased in 18 of the 30 reported1 local markets we monitor while the sales-to-new listings ratio tightened (increased) in 17 of these markets. But as for Canada, this latter indicator of market conditions cooled in 22 of these markets.
According to the sales-to-new listings ratio, market conditions were deemed balanced in 18 of the reported local markets we track in October, favouring buyers for 7 of them and sellers for 5 of them. All Quebec and Atlantic markets we follow posted an increase in their sales from September to October. Strongest monthly rises in sales in October were observed for Halifax (12%; sa), Saint John (NB; 11%) and Windsor (9.7%) while sharpest declines were observed for Hamilton-Burlington (-13.3%), Lethbridge (-11%) and St. Catharines (-9%).
IMPLICATIONS
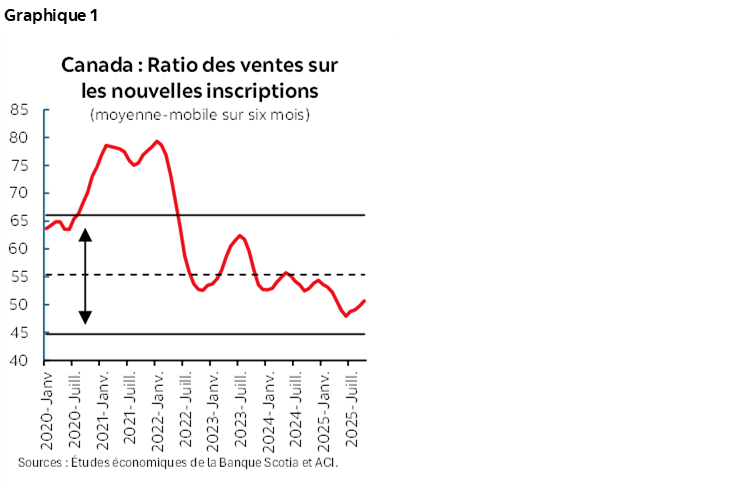
The monthly rise in the national MLS HPI in October along with the increase in sales and in the sales-to-new listings ratio are a bit of good news. However, to our view, this house price index is still facing headwinds. Housing market conditions are still easy as suggested by the sales-to-new listings ratio that has been trending in the lower half of the balanced conditions range (and somewhat downwards) since autumn of 2023 (chart 1) and because of the elevated level of recently completed and unabsorbed units as discussed in our previous report which increases the pool of options for potential buyers. And these market conditions are likely to ease further with the robust performance for housing starts so far in 2025 combined with the expected slowdown in population growth. Therefore, these current and expected relatively relaxed market conditions are delaying the sustained recovery in the MLS HPI, and even more so when factoring the economic—and income—uncertainty from the current global trade landscape.
1 October 2025 information was incomplete for Barrie at the time of producing this report. Therefore, this market is not included in the Housing Market Watch table.
DISCLAIMER
This report has been prepared by Scotiabank Economics as a resource for the clients of Scotiabank. Opinions, estimates and projections contained herein are our own as of the date hereof and are subject to change without notice. The information and opinions contained herein have been compiled or arrived at from sources believed reliable but no representation or warranty, express or implied, is made as to their accuracy or completeness. Neither Scotiabank nor any of its officers, directors, partners, employees or affiliates accepts any liability whatsoever for any direct or consequential loss arising from any use of this report or its contents.
These reports are provided to you for informational purposes only. This report is not, and is not constructed as, an offer to sell or solicitation of any offer to buy any financial instrument, nor shall this report be construed as an opinion as to whether you should enter into any swap or trading strategy involving a swap or any other transaction. The information contained in this report is not intended to be, and does not constitute, a recommendation of a swap or trading strategy involving a swap within the meaning of U.S. Commodity Futures Trading Commission Regulation 23.434 and Appendix A thereto. This material is not intended to be individually tailored to your needs or characteristics and should not be viewed as a “call to action” or suggestion that you enter into a swap or trading strategy involving a swap or any other transaction. Scotiabank may engage in transactions in a manner inconsistent with the views discussed this report and may have positions, or be in the process of acquiring or disposing of positions, referred to in this report.
Scotiabank, its affiliates and any of their respective officers, directors and employees may from time to time take positions in currencies, act as managers, co-managers or underwriters of a public offering or act as principals or agents, deal in, own or act as market makers or advisors, brokers or commercial and/or investment bankers in relation to securities or related derivatives. As a result of these actions, Scotiabank may receive remuneration. All Scotiabank products and services are subject to the terms of applicable agreements and local regulations. Officers, directors and employees of Scotiabank and its affiliates may serve as directors of corporations.
Any securities discussed in this report may not be suitable for all investors. Scotiabank recommends that investors independently evaluate any issuer and security discussed in this report, and consult with any advisors they deem necessary prior to making any investment.
This report and all information, opinions and conclusions contained in it are protected by copyright. This information may not be reproduced without the prior express written consent of Scotiabank.
™ Trademark of The Bank of Nova Scotia. Used under license, where applicable.
Scotiabank, together with “Global Banking and Markets”, is a marketing name for the global corporate and investment banking and capital markets businesses of The Bank of Nova Scotia and certain of its affiliates in the countries where they operate, including; Scotiabank Europe plc; Scotiabank (Ireland) Designated Activity Company; Scotiabank Inverlat S.A., Institución de Banca Múltiple, Grupo Financiero Scotiabank Inverlat, Scotia Inverlat Casa de Bolsa, S.A. de C.V., Grupo Financiero Scotiabank Inverlat, Scotia Inverlat Derivados S.A. de C.V. – all members of the Scotiabank group and authorized users of the Scotiabank mark. The Bank of Nova Scotia is incorporated in Canada with limited liability and is authorised and regulated by the Office of the Superintendent of Financial Institutions Canada. The Bank of Nova Scotia is authorized by the UK Prudential Regulation Authority and is subject to regulation by the UK Financial Conduct Authority and limited regulation by the UK Prudential Regulation Authority. Details about the extent of The Bank of Nova Scotia's regulation by the UK Prudential Regulation Authority are available from us on request. Scotiabank Europe plc is authorized by the UK Prudential Regulation Authority and regulated by the UK Financial Conduct Authority and the UK Prudential Regulation Authority.
Scotiabank Inverlat, S.A., Scotia Inverlat Casa de Bolsa, S.A. de C.V, Grupo Financiero Scotiabank Inverlat, and Scotia Inverlat Derivados, S.A. de C.V., are each authorized and regulated by the Mexican financial authorities.
Not all products and services are offered in all jurisdictions. Services described are available in jurisdictions where permitted by law.