CANADA HOUSING MARKET: NATIONAL HOUSING CONDITIONS CONTINUE TO COOL
SUMMARY
National unit sales significantly fell from December to January. This weakening in sales combined with a sharp rise in new listings contributed to lower the sales-to-new listings ratio to near the lower bound of the estimated range for balanced conditions. However, unusually inclement weather in Ontario centres contributed to amplify the slowdown in national sales in January.
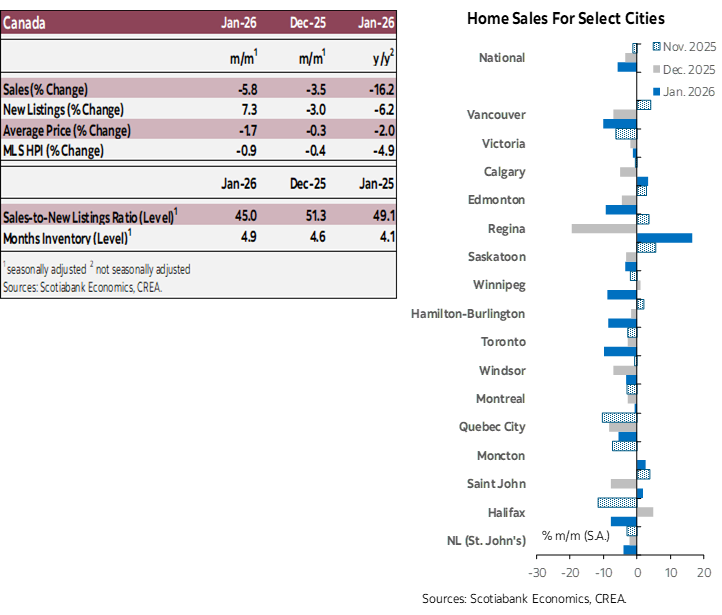
National sales (in units) posted a -5.8% (sa) drop from December to January. They weakened in each of the last 3 months, posting a cumulative -10.2% decline (with sa figures) since October 2025. In January, they were 16.2% below their level in November 2024, the period when trade tensions started to emerge as the incoming U.S. administration announced its intention to increase tariffs on imports from key economic partners. Compared to the same month in 2025, national sales were 16.2% (nsa) lower in January. Following 4 months of monthly declines, new listings rose sharply in January (7.3% m/m, sa) but fell 6.2% (nsa) from the same month in 2025.
With this significant decline in sales and the sharp rise in new listings from December to January, the sales-to-new listings ratio fell from 51.3% (sa) in December to 45% in January, a 6.3 percentage points (pps) drop. This indicator of housing market conditions now stands very close to our 44.6% estimate for the lower bound of the balanced conditions range. This indicator declined by 4.1 pps (from sa figures) since January of 2025.
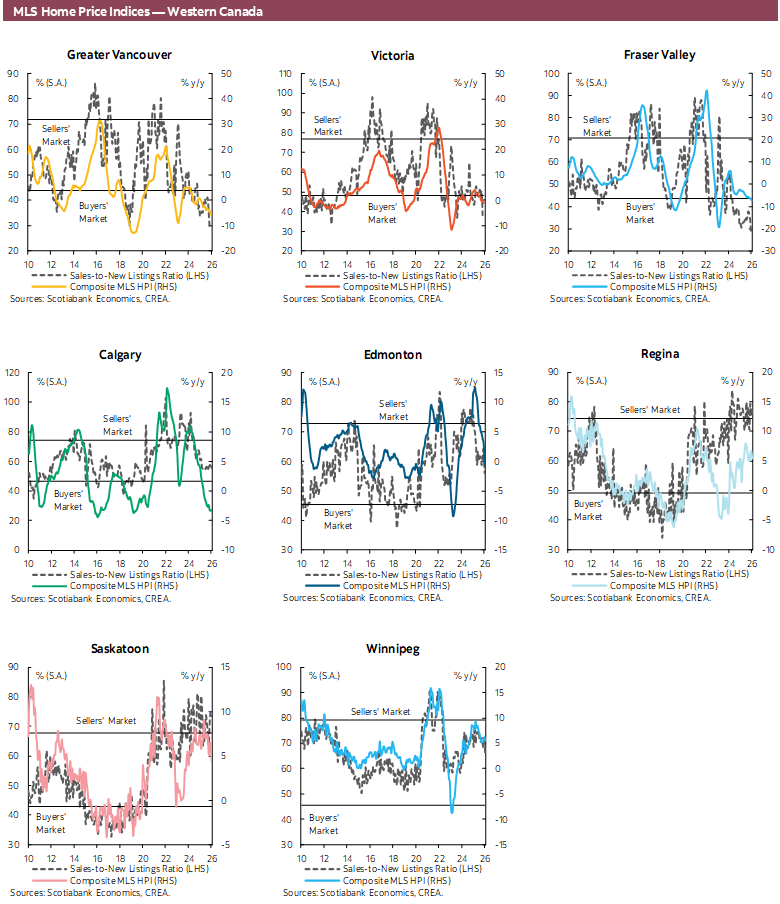
Months of inventory, the other indicator of market conditions we track, also eased from December to January, increasing from 4.6 to 4.9 over this period (sa figures). In each of the last 3 months, this indicator has been moving up towards its 5.1 long-term pre-pandemic average. As in previous months, it was below its long-term average in all provinces, except in B.C. (+1.8 month) and Ontario (+1.7), and with Quebec and Atlantic provinces again showing the largest negative deviations from their long-term average.
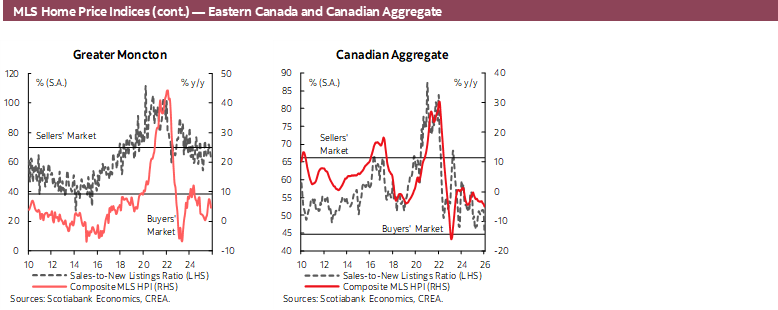
The national MLS HPI continued its downward trend in January, posting a significant -0.9% (sa) decline from the previous month. All unit types contributed to this monthly decline, with 2-storey units posting the largest (-1.3%), and 1-storey the mildest (-0.1%). From January 2025 to January 2026, this indicator fell by -4.9% (nsa), with all unit types also contributing to this yearly decline, and largest declines posted for townhouses (-6.2%) and apartments (-5.9%).
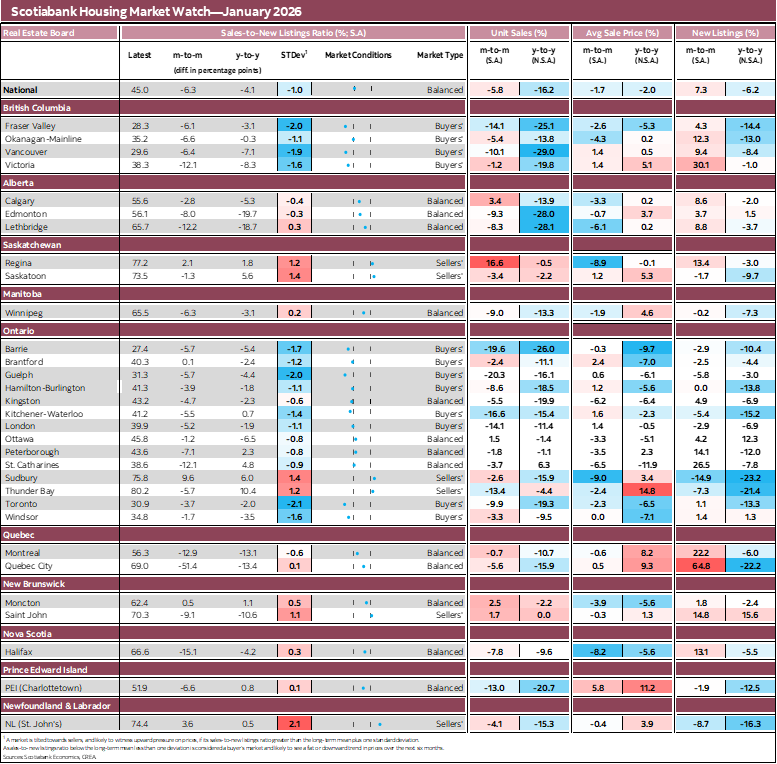
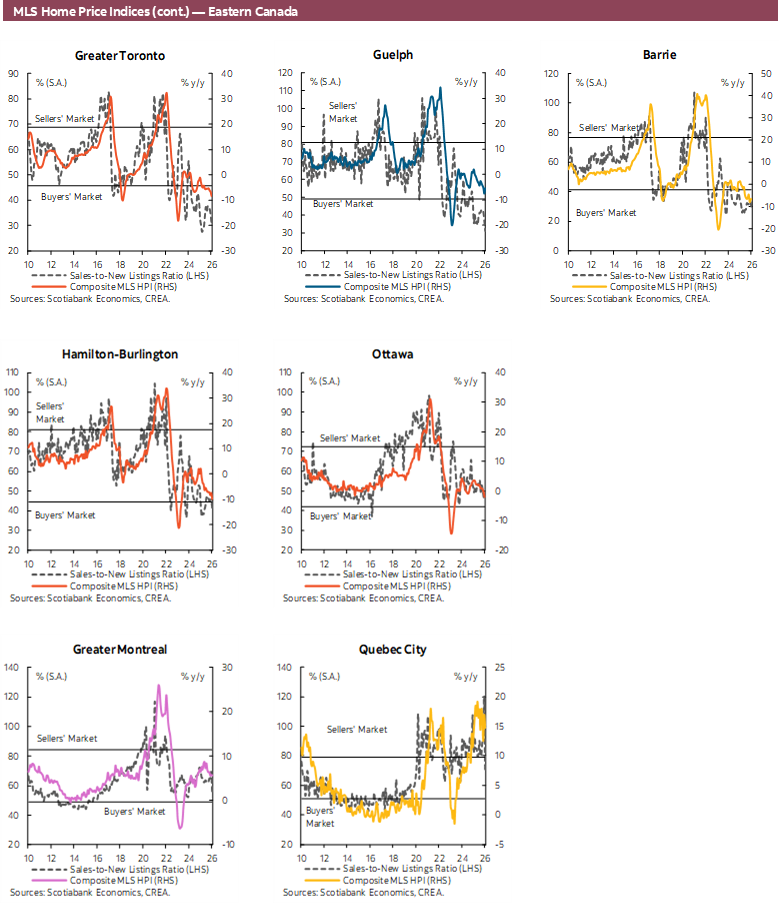
Sales declined in 26 of the 31 local markets we track from December to January, and in 29 of these markets since January of 2025. Housing conditions—as reflected by the sales-to-new listings ratio—cooled in 26 of the markets we monitor from December to January. Since January 2025, the sales-to-new listings ratio eased in 21 of the monitored markets. Based on this indicator, 13 tracked markets were deemed balanced in January while 12 of them were favouring buyers and 6 favouring sellers.
Largest declines in sales from December to January were observed in Guelph (-20.3%; sa), Barrie (-19.6%) and Kitchener-Waterloo (-16.6%). The unusually unfavourable weather conditions for a January in Southern Ontario likely contributed to reduced sales. As mentioned earlier, a few markets posted a monthly increase in their sales in January with the strongest one posted for Regina (+16.6%)
IMPLICATIONS
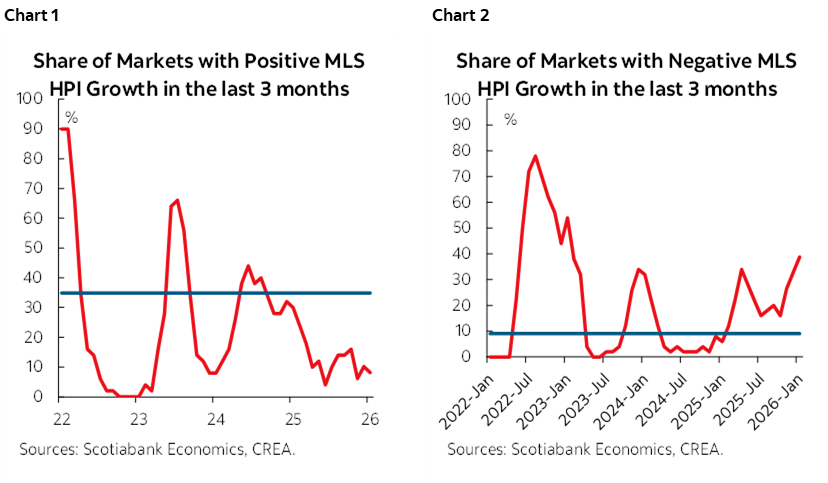
The unusually inclement weather conditions witnessed in Southern Ontario likely contributed to amplify the fall in national sales in January. But with centres in most other provinces—except New Brunswick—also witnessing declines in their sales, it suggests the weakness in national housing market conditions as reported in our previous reports is still relatively broadly shared across provinces. This shared weakness is also reflected in the behaviour of market specific MLS HPI indices across regions that report this price indicator. As shown in charts 1 and 2, the share of markets that posted a decline in their MLS HPI in each of the last three months is well above its longer term (two-decade) average, while the share of those that posted an increase in each of the latest three months is well below its long-term average. Hence, housing conditions are still relatively weak nationally and across regions, still affected by the uncertainty from global trade tensions and challenging affordability conditions for potential buyers as per the Bank of Canada Housing Affordability Index. We still expect the housing market to recover, along with the expected near-term strengthening in economic and income growth, and with lagging effects from the past decline in mortgage rates since about mid-2024. However, headwinds from a still-appreciable amount of housing supply—as mentioned in our previous housing report—and still-challenging affordability conditions will limit the expected recovery in housing conditions and prices in the near-term. Consequently, we still expect the national MLS HPI to start recovering in 2026, but its pace of growth will be modest.
DISCLAIMER
This report has been prepared by Scotiabank Economics as a resource for the clients of Scotiabank. Opinions, estimates and projections contained herein are our own as of the date hereof and are subject to change without notice. The information and opinions contained herein have been compiled or arrived at from sources believed reliable but no representation or warranty, express or implied, is made as to their accuracy or completeness. Neither Scotiabank nor any of its officers, directors, partners, employees or affiliates accepts any liability whatsoever for any direct or consequential loss arising from any use of this report or its contents.
These reports are provided to you for informational purposes only. This report is not, and is not constructed as, an offer to sell or solicitation of any offer to buy any financial instrument, nor shall this report be construed as an opinion as to whether you should enter into any swap or trading strategy involving a swap or any other transaction. The information contained in this report is not intended to be, and does not constitute, a recommendation of a swap or trading strategy involving a swap within the meaning of U.S. Commodity Futures Trading Commission Regulation 23.434 and Appendix A thereto. This material is not intended to be individually tailored to your needs or characteristics and should not be viewed as a “call to action” or suggestion that you enter into a swap or trading strategy involving a swap or any other transaction. Scotiabank may engage in transactions in a manner inconsistent with the views discussed this report and may have positions, or be in the process of acquiring or disposing of positions, referred to in this report.
Scotiabank, its affiliates and any of their respective officers, directors and employees may from time to time take positions in currencies, act as managers, co-managers or underwriters of a public offering or act as principals or agents, deal in, own or act as market makers or advisors, brokers or commercial and/or investment bankers in relation to securities or related derivatives. As a result of these actions, Scotiabank may receive remuneration. All Scotiabank products and services are subject to the terms of applicable agreements and local regulations. Officers, directors and employees of Scotiabank and its affiliates may serve as directors of corporations.
Any securities discussed in this report may not be suitable for all investors. Scotiabank recommends that investors independently evaluate any issuer and security discussed in this report, and consult with any advisors they deem necessary prior to making any investment.
This report and all information, opinions and conclusions contained in it are protected by copyright. This information may not be reproduced without the prior express written consent of Scotiabank.
™ Trademark of The Bank of Nova Scotia. Used under license, where applicable.
Scotiabank, together with “Global Banking and Markets”, is a marketing name for the global corporate and investment banking and capital markets businesses of The Bank of Nova Scotia and certain of its affiliates in the countries where they operate, including; Scotiabank Europe plc; Scotiabank (Ireland) Designated Activity Company; Scotiabank Inverlat S.A., Institución de Banca Múltiple, Grupo Financiero Scotiabank Inverlat, Scotia Inverlat Casa de Bolsa, S.A. de C.V., Grupo Financiero Scotiabank Inverlat, Scotia Inverlat Derivados S.A. de C.V. – all members of the Scotiabank group and authorized users of the Scotiabank mark. The Bank of Nova Scotia is incorporated in Canada with limited liability and is authorised and regulated by the Office of the Superintendent of Financial Institutions Canada. The Bank of Nova Scotia is authorized by the UK Prudential Regulation Authority and is subject to regulation by the UK Financial Conduct Authority and limited regulation by the UK Prudential Regulation Authority. Details about the extent of The Bank of Nova Scotia's regulation by the UK Prudential Regulation Authority are available from us on request. Scotiabank Europe plc is authorized by the UK Prudential Regulation Authority and regulated by the UK Financial Conduct Authority and the UK Prudential Regulation Authority.
Scotiabank Inverlat, S.A., Scotia Inverlat Casa de Bolsa, S.A. de C.V, Grupo Financiero Scotiabank Inverlat, and Scotia Inverlat Derivados, S.A. de C.V., are each authorized and regulated by the Mexican financial authorities.
Not all products and services are offered in all jurisdictions. Services described are available in jurisdictions where permitted by law.