Next Week's Risk Dashboard
- Tariff cliff week
- The deals to date, the deadlines to come
- Tariffs + rebates + capital gains relief ≠ Fed cuts
- The debate over market reactions to trade deals
- FOMC will remain patient
- Bank of Canada to stand pat
- Nonfarm payrolls preview—one of many before next decision
- Fed’s preferred inflation gauge to show moderate inflation
- BoJ likely to hold, hawkish bias in question
- Canada’s economy flat in Q2, exiting stronger
- US Q2 GDP likely to remain resilient in
- ISM to be littered with tariff references
- Mexico’s Q2 GDP to test tariff effects
- BCCh may have a long way to go yet
- BanRep’s split likely to favour a cut this time
- Brazil’s Selic rate to be unchanged
- SARB said they’d cut
- Eurozone GDP still resilient?
- Eurozone inflation still on target?
- China PMIs to refresh growth risks
- Australian CPI to tee up the RBA’s August decision
Chart of the Week
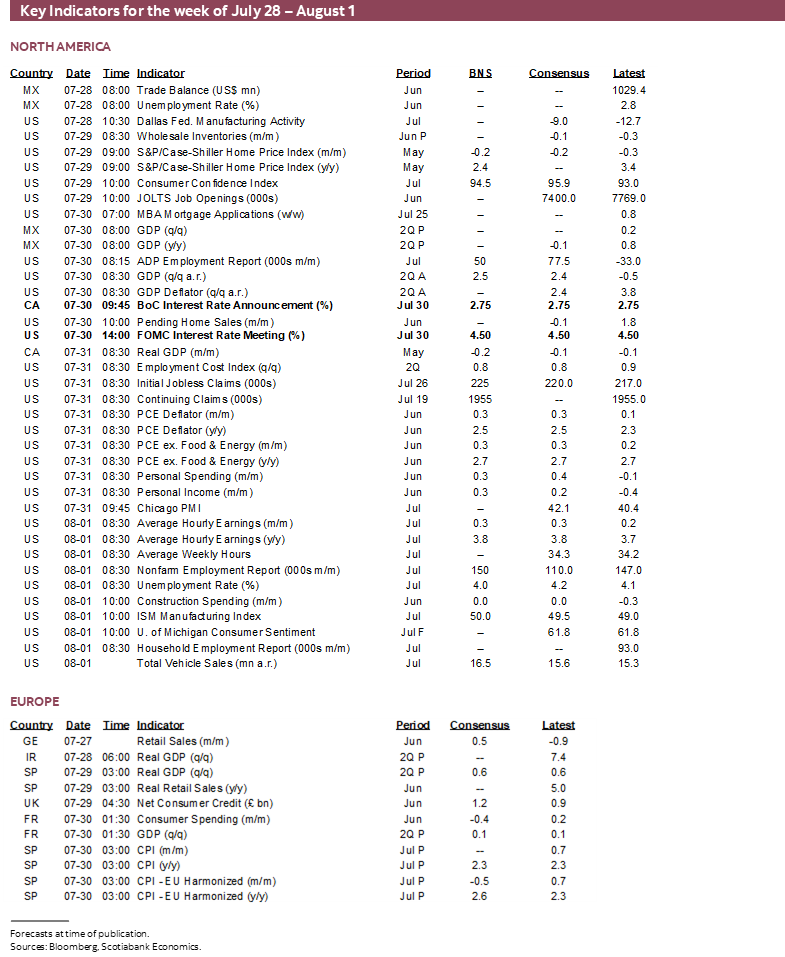
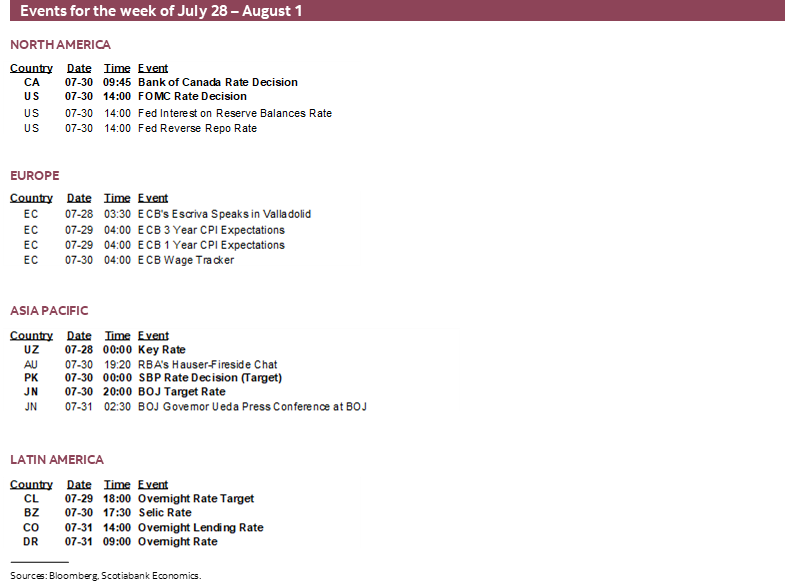
July is going to go out with a bang, or several. A packed week of global developments lies ahead. Trump’s tariff deadlines intensify this week. Multiple central banks weigh in with decisions including the Federal Reserve, BoC, BoJ, Brazil, BCCh, BanRep and SARB. Data risk will be high including US nonfarm payrolls, the Fed’s preferred inflation gauges, Eurozone inflation, GDP reports (Canada, US, Mexico, Eurozone), China’s PMIs, Australian CPI, European consumer spending, and Peru’s inflation. Not enough? There will also be global earnings reports including over 150 S&P500 releases, about five dozen TSX-listed companies in Canada, and many other global corporations.
TARIFF CLIFF
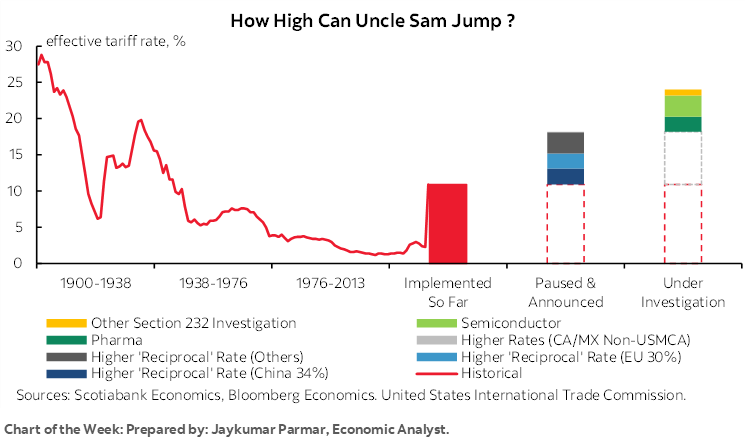
Trade policy uncertainty is on the rise again (chart 1). To date, we figure that the US has imposed an average effective tariff rate on its own imports of about 17.5% compared to 2.3% at the start of the year. That’s the highest rate since 1935 (chart 2).
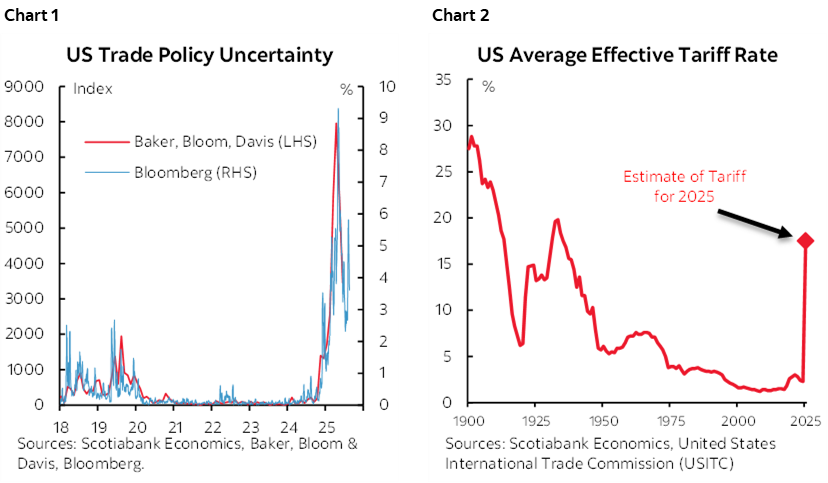
This week’s chart of the week on the front cover by Jay Parmar shows what would happen to this rate if Trump went ahead with all tariffs that are in effect, announced but paused, and under investigation. The rate would soar to 24% which would be the highest since 1906. Whatever happens this week, the evolution of the tariff threat is highly unlikely to be anywhere close to being over.
This week’s developments could further inform such observations and calculations. Several tariff deadlines arrive this week that could be impactful to markets. Twenty-five letters have been sent by the US administration to other countries thus far. Some may be implemented, some may be replaced by further ‘deals,’ and some may be postponed. Additional letters may be sent to some countries that amend earlier ones. Negotiations are likely to be ongoing. Some countries—Canada and China come to mind—may dig in and prolong negotiations to avert a bad deal they may be stuck with for a long time.
Markets have tended to respond favourably to deals when struck at first with the main ones being with Japan and the UK. That’s despite the high tariffs, trade restrictions and capital and investment controls—not to mention the need for formal agreements with implementation details, timelines, tracking and enforcement mechanisms.
Why have markets responded this way? Multiple plausible theories abound. It’s possible that the first-round market response is merely a relief trade that at least we might have the new rules of the game if they prove to be durable which reduces uncertainty for now, while leaving the toll upon global commerce yet to be paid over time. It’s possible that markets are relieved that the countries that have struck deals did not retaliate against US tariffs, although any toll on their economies may resurrect this issue. Markets may be overly exuberant with the price-to-trailing earnings on the S&P500 at 25 times and price-to-one-period-forward multiple at over 24 times while the Nasdaq’s ratios are in the low- to mid-30s. Markets may be implicitly pricing trade diversion away from the US toward other regions of the world that multinationals may be better positioned to deal with than smaller firms. It’s possible that markets in the short-run may be incapable of fathoming the complex forces being unleashed in terms of trade diversion and substitution, risks to supply chains and inflation, and risks to global growth.
In short, I’m inclined to treat the early reactions very cautiously into further coming developments.
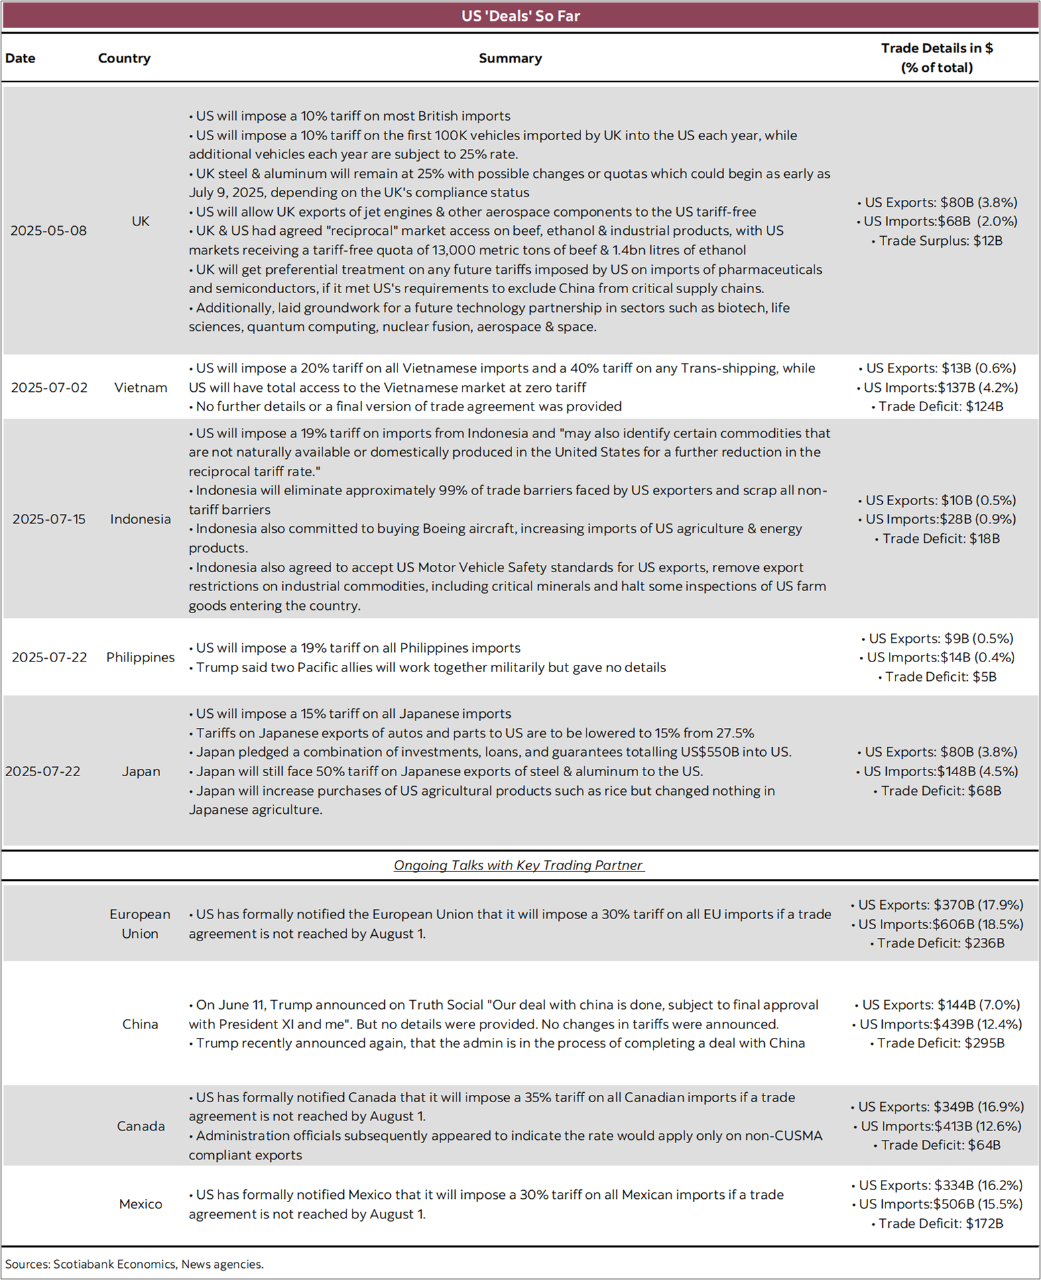
The first of two tables on the next pages was created by my colleague Jay Parmar and provides some details on agreements reached to date between the US and the UK, Japan, Indonesia, Philippines and Vietnam. The table also summarizes where there is an absence of deals with America’s top trading partners including Canada, Mexico, the EU and China.
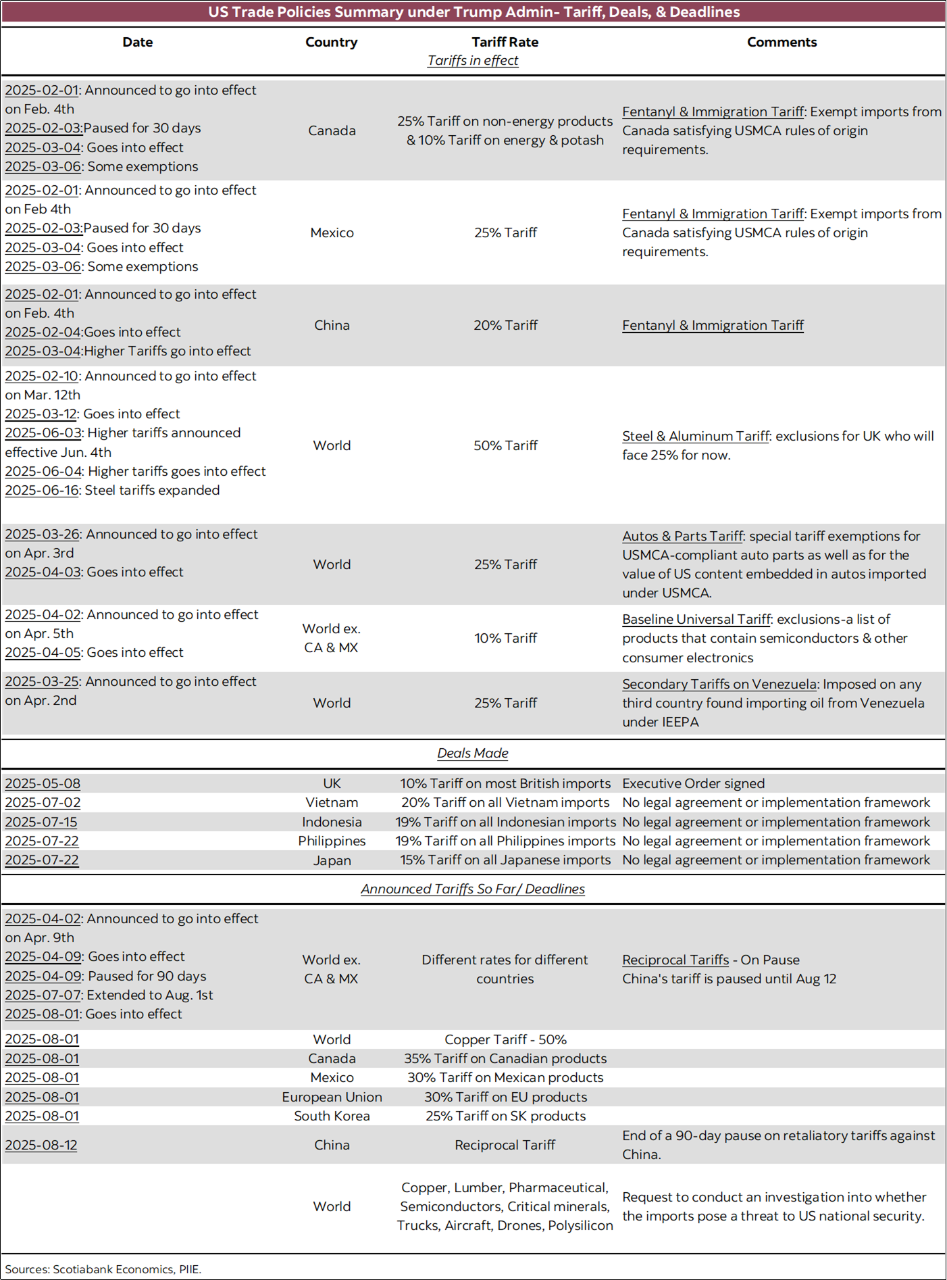
Jay’s second table summarizes developments in terms of tariffs to date since Trump’s inauguration.
Among the coming deadlines this week are the following:
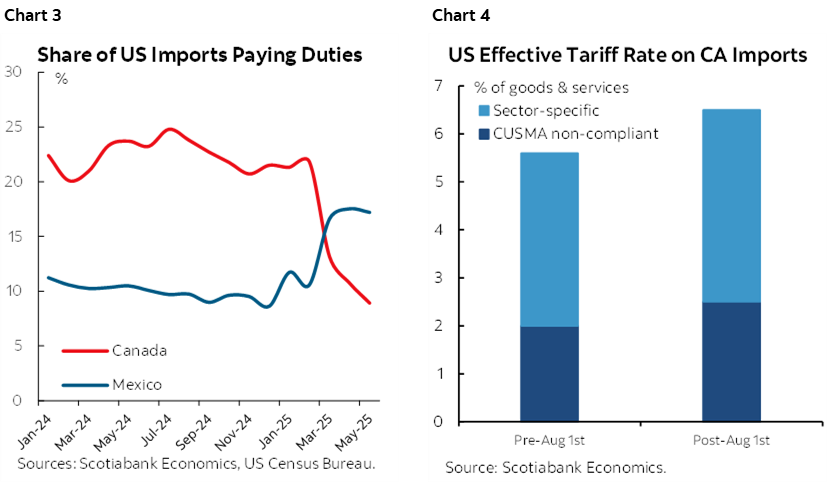
- Canada faces a 35% tariff on all Canadian imports into the US after August 1st that an administration official later remarked would be on non-CUSMA-compliant exports. This note previously reviewed the letter and its false claims about Canada. We figure that exempts around 90% of Canadian exports judging by US data on duties actually paid and using a chart I snagged from my colleague John McNally (chart 3). Chart 4 shows what would happen to Canada’s effective tariff rate on exports to the US under two scenarios: pre-Friday when the tariff rate was previously guided to be 25% on non-energy products and 10% on oil, electricity and potash, and post-Friday if the 35% non-compliant hit kicks in. In both cases, we’ve also included separate sectoral tariffs.
- Mexico faces a 30% tariff rate on all Mexican imports into the US if a trade deal is not struck by Friday.
- Treasury Secretary Bessent has already advised that his negotiating team will meet their Chinese counterparts in Stockholm on Monday and Tuesday and “we’ll be working out what is likely an extension then” to the 90-day pause on retaliatory tariffs that expires on August 12th.
- A 30% tariff on imports from the EU will be applied if a trade agreement cannot be achieved by Friday. Negotiating teams are meeting this Sunday and Trump has said there are “maybe 20 things” that are sticking points (phew, I thought there would be many…). Trump gave 50–50 odds of achieving a deal. The EU has indicated it will retaliate if tariffs go into effect.
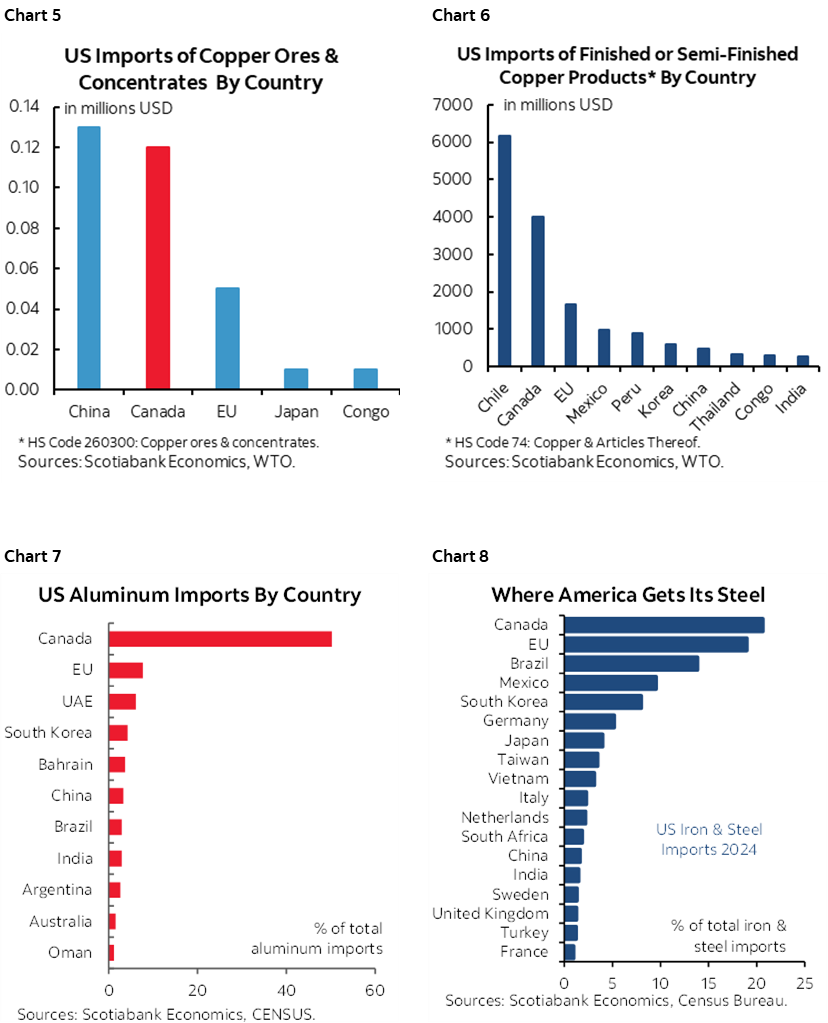
- A 50% tariff on imports of copper from all countries kicks in on Friday, adding to America’s import costs for metals (charts 5–8).
- Other countries face higher reciprocal tariffs on top of the pre-existing baseline 10% tariff.
Additional tariff threats pending completion of so-called investigations into national security threats have no hard deadline but may apply to lumber, pharmaceuticals, semiconductors, critical minerals, trucks, aircraft, drones and polysilicon.
The MAGA line that US President Trump’s trade wars will serve to liberalize trade was probably always nonsense but is looking increasingly so in light of recent ‘deals’ that have been struck with some countries.
Consider the ‘deals’ struck with some countries so far. Philippines agreed to a 19% tariff on its exports to the US—two points worse than the ‘Liberation Day’ rate—and pledged to allow US closer cooperation on military efforts perhaps including missiles on its soil. Indonesia agreed to the same tariff rate while reducing export restrictions on critical minerals. Vietnam agreed to 20%, 40% on items in transit, and eliminated tariffs on US imports.
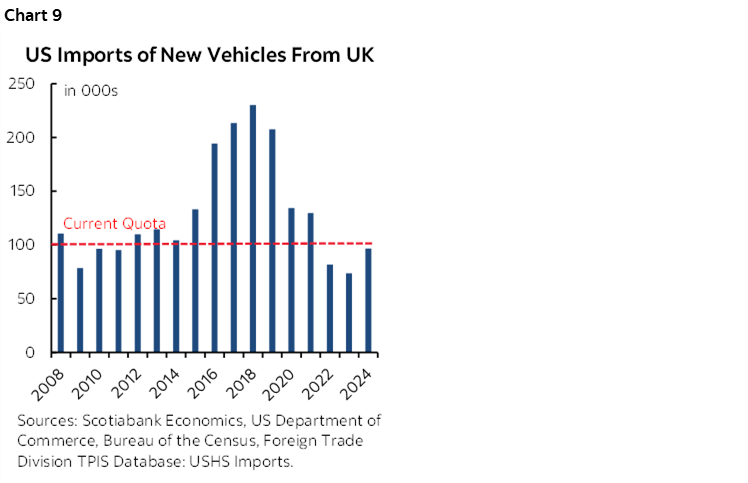
This article offers a decent take on the UK deal that generally confirms my initial understanding that it was at best a loose pledge that guarantees nothing pending further details. The UK agreed to a baseline tariff rate of 10%, 25% on metals, and secured an exemption for Rolls Royce jet engines. In particular, note that the UK agreed to what is essentially an import quota on its vehicles set at last year’s volume of exports to the US that may never allow the country to return to prior peaks for auto exports to the US (chart 9). That’s because a 10% tariff applies on British vehicle imports up to 100,000 vehicles per year, but then a 25% tariff applies above this threshold.
My thoughts on Japan’s deal are explained here in an earlier daily note. Japan agreed to a 15% tariff on its exports including autos, but 50% on its steel and aluminum. US auto firms that face tariffs on imports of metals and have N.A. content requirements were probably placed at a relative disadvantage.
These ‘deals’ often lack formal structures and seem to be more like loose pledges as noted by Japanese negotiator Akazawa who bluntly stated there was no discussion on a legally binding agreement or how to implement one yet. The US generally secured little from these countries by way of market access. My Japan note explains skepticism toward investment commitments and commitments to purchase planes.
Whatever is agreed to by individual countries, they must keep in mind that this is likely to be a multi-period game with the Trump administration that may return again and again.
Amid such developments is that movement is afoot toward potential further fiscal policy measures in the US. Trump has increasingly mused about using tariffs to provide one-off rebates to some households but did not mention details. If tariffs don’t cause inflation, giving folks more money to spend with implications for US fiscal deficits might tip the balance away from any rate cuts. Ditto for talk of potentially provided capital gains tax relief on primary residences in addition to mortgage interest deductibility at present. The US can make further use of budget reconciliation bills in an attempt to advance such causes through Congress.
NONFARM—ONE OF MANY
Another nonfarm payrolls report lands two days after the FOMC’s latest decision. Not much will hang on this one report for July from a monetary policy standpoint since it’s one of three payroll reports before the next FOMC decision on September 17th, and one of two before the Jackson Hole symposium on August 21st–23rd. Market volatility is pretty much assured surrounding possibly the world’s single most important economic indicator, but the monetary policy dialogue is likely to remain in patient mode.
My estimate is for a gain of 150k with downtick of the unemployment rate to 4.0%. There are several reasons for why I think continued resilience is feasible.
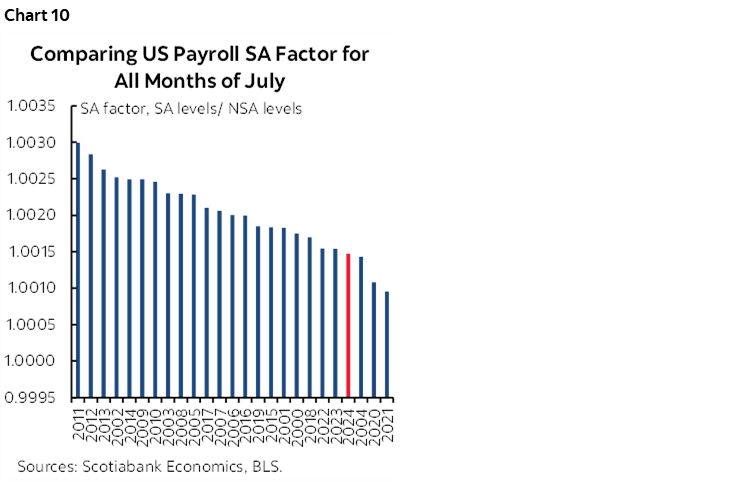
Seasonal adjustment factors will probably serve to artificially tamp down growth in payrolls. The recency bias to how they are calculated results in these factors being lower than historically usual across like months of July (chart 10). If this happens, then adjustments will be made for alternate SA factors lacking this recency bias that itself may not be appropriate.
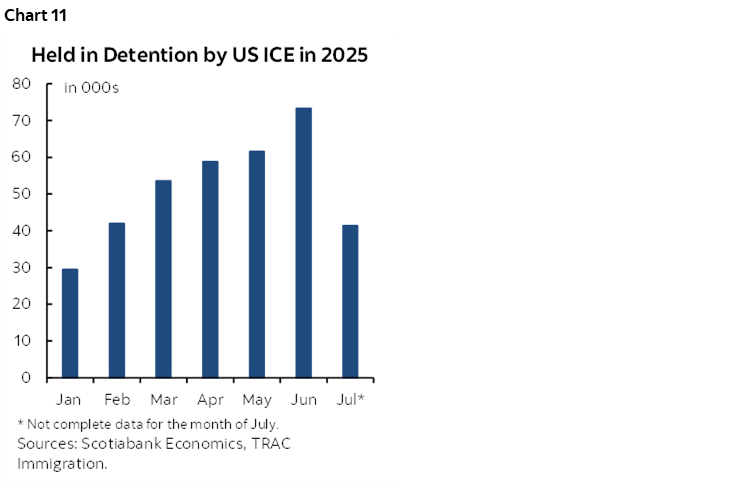
An immigration purge was incrementally modest in July/June as indicated by ICE arrests (here, chart 11). That shouldn’t have much of a direct effect on payrolls especially if more of the ICE arrests focus upon off-payroll workers. What we don’t know, however, is the indirect effect of frankly cruel extremes of immigration policy on those who have committed no crimes but may be increasingly detached from the labour force out of fear. Again, however, this is probably more of an issue for the household survey than the more formal types of employment in the nonfarm payrolls report.
Tariffs pose uncertain effects on employment. Given the erratic nature of US trade policy, it’s feasible that it dampens appetite for hiring. It’s also feasible that it supports appetite for hiring in order to produce and sell before the possible day when more draconian tariffs apply. That day may be just around the corner, or perhaps not.
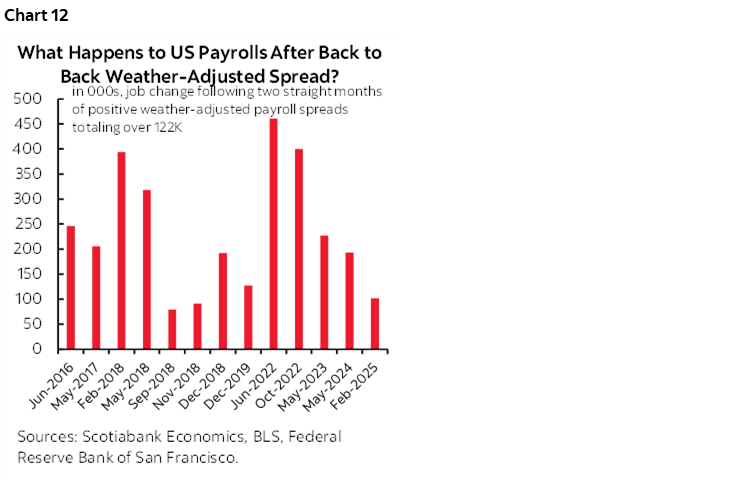
Historically, when weather effects have resulted in drags on nonfarm employment in back-to-back months as happened this May and June, the next month usually offers some catch-up (chart 12).
The health and education sector has been driving a disproportionate share of job creation for some time. Some of that is because health sector jobs often have associated visa sponsorship which has probably become more valuable under tighter immigration rules and ICE arrests. This could work against thoughts about the impact of tighter immigration that may ultimately emerge but perhaps not quite yet.
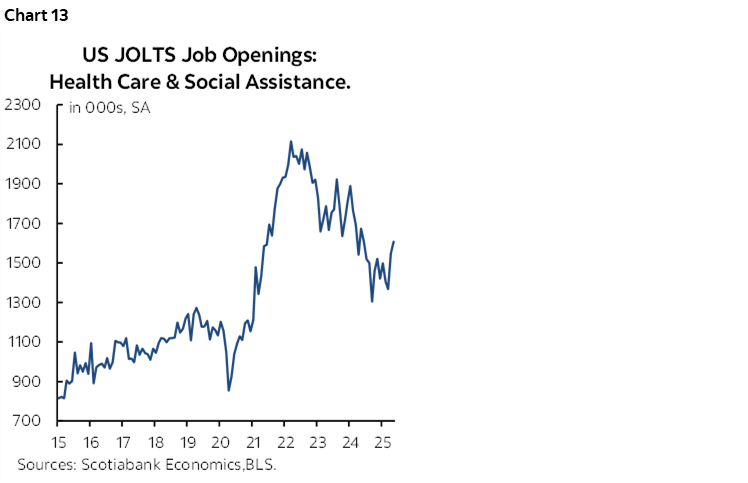
JOLTS job openings moved up in May, with June pending. Postings for jobs in health care and social assistance were especially strong (chart 13). That said, it’s not a great guide for nonfarm payrolls. Still, the increase in openings was led by leisure and hospitality which has been a job growth leader.
Initial jobless claims remained low between the July and June nonfarm reference periods and the household survey reference weeks, possibly indicating a resilient job market.
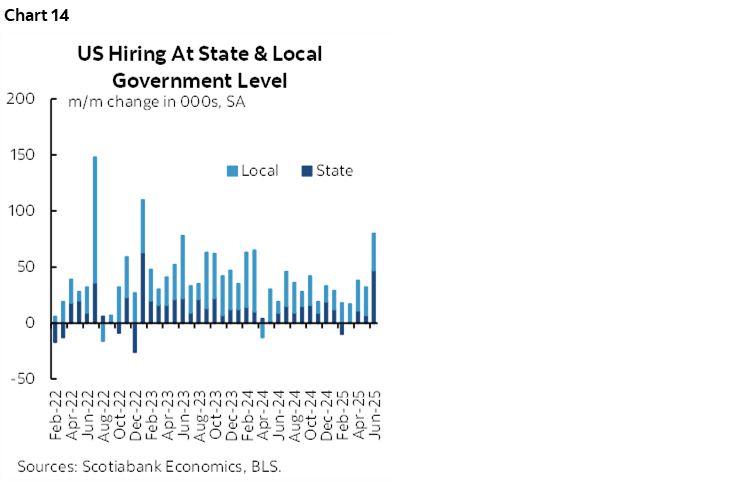
State and local government hiring probably continued to offset federal government layoffs (chart 14). That said, the strong gain in state and local government jobs in May could be difficult to repeat while a pick-up in private payrolls may be offsetting on the net effect. State and local government hiring has been underestimated by many forecasters for an extended period.
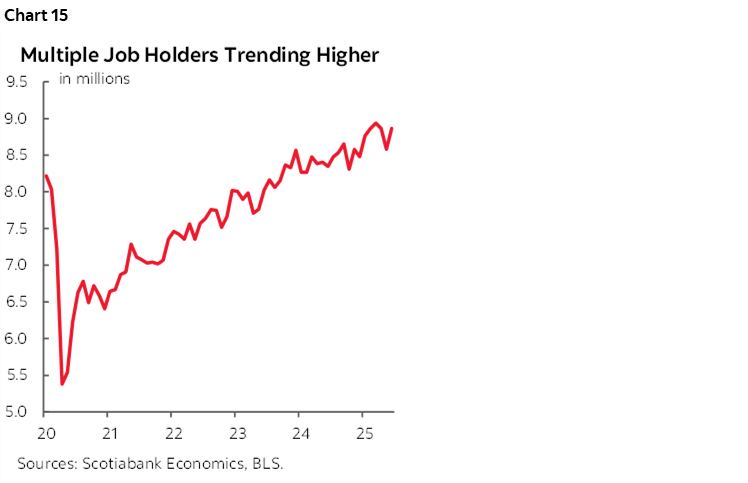
Multiple job holders continue to be trending higher according to the household survey (chart 15). This may be taken as an indirectly positive sign for nonfarm payrolls given that the Current Employment Statistics survey (nonfarm) counts jobs versus the Current Population Survey (household survey) that counts employed bodies only once.
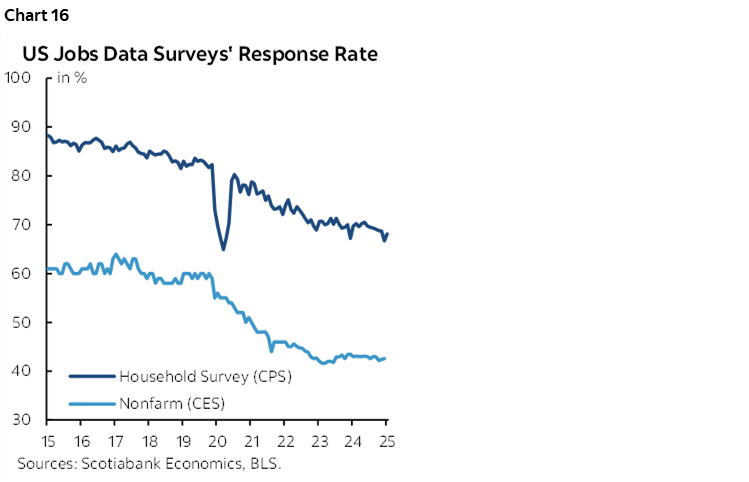
A big caution, however, concerns US data quality insofar as the job market is concerned and not just inflation statistics. Survey response rates are tumbling (here and here) for nonfarm (Current Employment Statistics) and the household survey (Current Population Survey) as shown in chart 16. This is driven by multiple factors dating back many years before the pandemic but worsened by recent budget cuts to the BLS.
Another key may be hours worked. They fell by 2.8% m/m SAAR in June possibly in part due to weather disruptions. What’s also possible is that employers are rationing hours rather than reducing jobs in the event that the economy proves to be resilient in the face of nearer term shocks.
A pick-up in wage growth is also likely off the modest 2.7% m/m SAAR rate of increase in June.
Also note that several other labour market readings are due out. They will include the JOLTS job openings and related figures for June (Tuesday), ADP private payrolls for July (Wednesday), Thursday’s trio of reports including Challenger job layoffs in July, weekly jobless claims that remain low, and the Q2 measure of employment costs including benefits. There is usually a very high bar set against changing a nonfarm payrolls call after seeing these other readings which is why I personally almost never do.
CENTRAL BANKS—DM INACTION
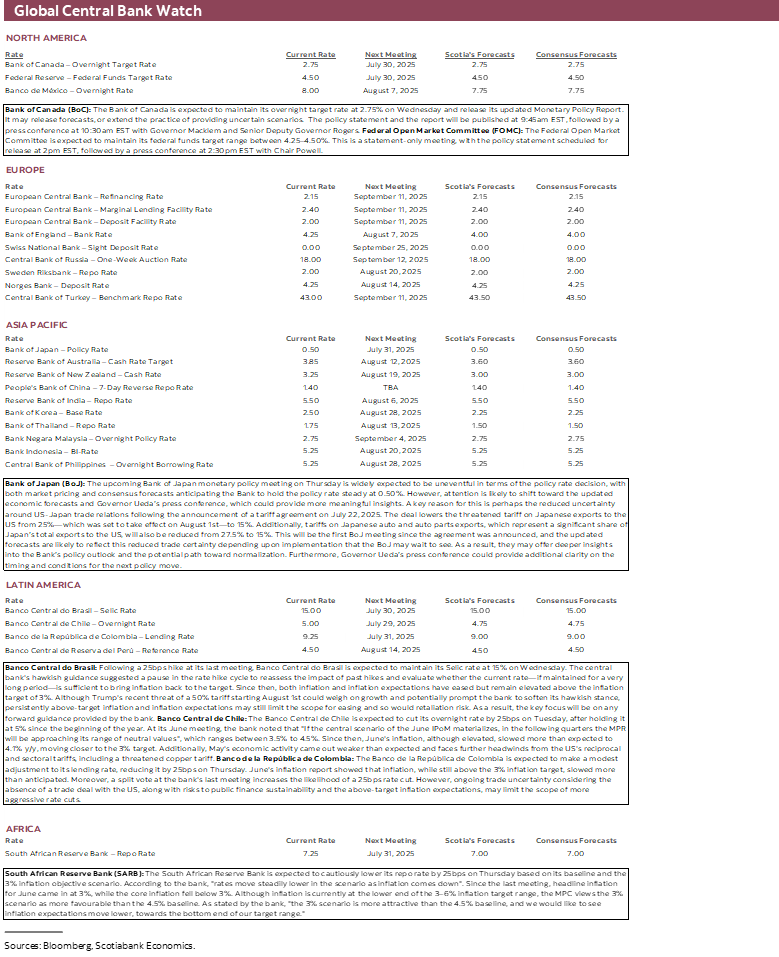
A bevy of central banks will weigh in during the final days of July before what is classically a relatively quiet month of August for their decisions and communications. An exception is the Federal Reserve’s annual Jackson Hole Symposium on August 21st-23rd. The biggest central banks (Fed, BoJ, BoC) are not expected to alter their policies, but key may be any guidance. Brazil is also expected to hold, but central banks in Chile, Colombia and South Africa are likely to cut.
Bank of Canada—Still Fighting the Last Fight
The Bank of Canada delivers a full set of communications including its latest rate decision on Wednesday. The statement arrives at 9:45amET along with the fresh Monetary Policy Report and followed by the press conference 45 minutes later. Any local market effects might soon be overwhelmed by the FOMC communications that same afternoon.
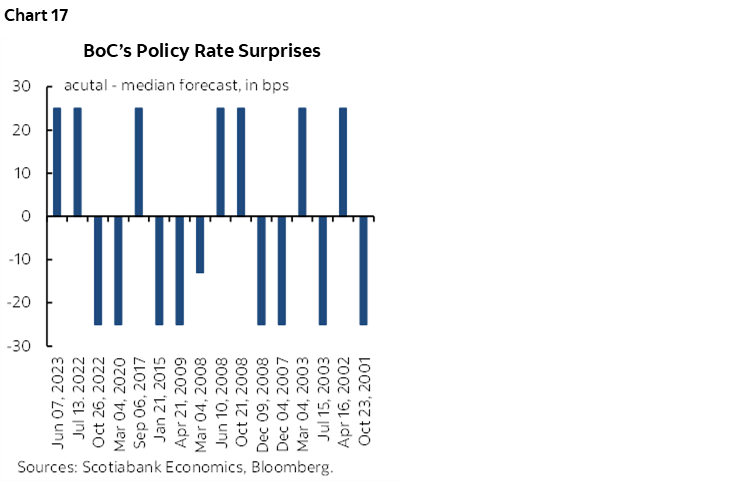
No policy rate change is expected at this meeting. Markets have no move priced. At the time of writing, the freshest estimates within consensus expect a hold but there remain several stale entries. Risk of a cut rests upon the BoC’s willingness to surprise (chart 17) but would be difficult to explain with a credible narrative.
I wouldn’t be surprised to see the BoC continue to boycott the forecasting business by holding off on the production of a base case projection in favour of scenarios as it did in the last MPR in April. If it does produce a base case projection, then they would have to explain what gives them confidence to do so.
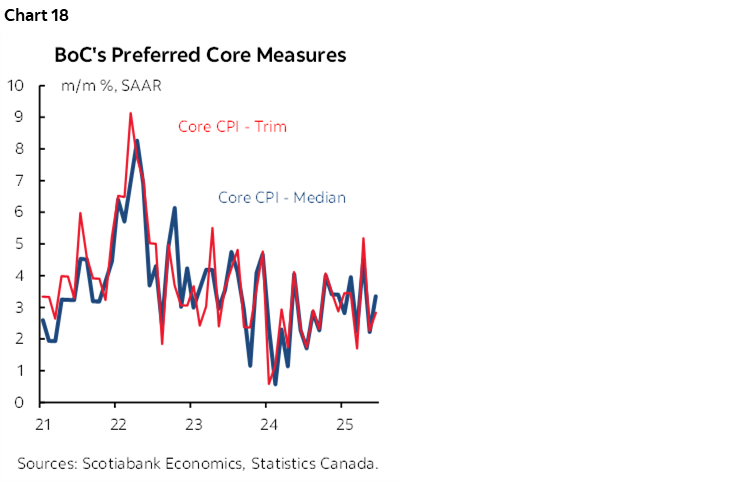
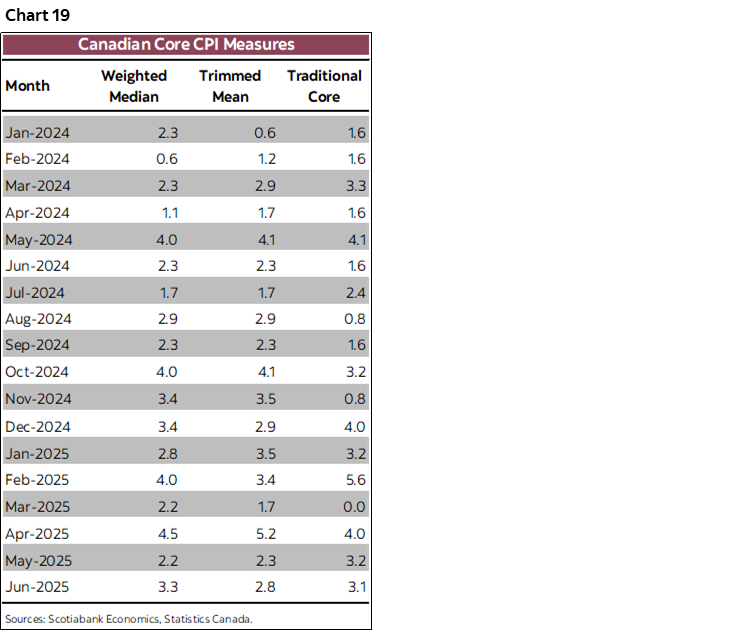
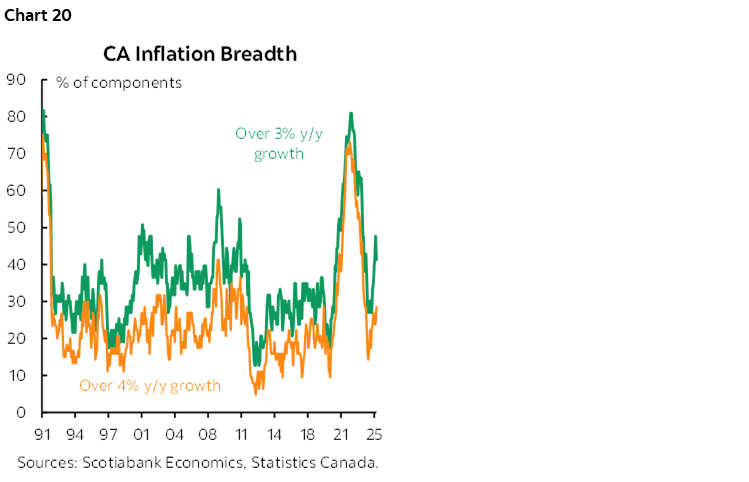
One reason for holding the line is that core inflation remains too hot (here). The BoC’s two preferred gauges of underlying inflation—trimmed mean CPI and weighted median CPI— have been tracking far above the 2% headline inflation target for a long time now which indicates that the BoC has not beaten back the drivers of inflation risk (chart 18, 19). That chart also shows a similar picture for traditional core CPI. Inflation breadth has also been rising over recent months (chart 20).
Sticky underlying core inflation at such high rates is persisting despite the emergence of a modest amount of slack beginning in either 2023Q3 or 2024Q1 depending upon which one of the BoC’s two output gap measures are used. Elevated core inflation 8–10 quarters are slack began emerging may indicate the lags between the emergence of slack and lower inflation take longer today, or that the estimates of slack are too small to have a meaningful impact, or that other forces beyond output gaps are driving inflation. Persistently elevated inflation expectations could be one driver that is feeding a self-perpetuating cycle of elevated actual inflation after the shocks of the pandemic. The effects of trade wars on supply chains may remain at a nascent stage of forcing companies to preserve higher than normal inventories, build them further, and bring chains closer and tighter together away from production markets with higher border risks. All of that means higher costs, borne by consumers and other businesses. The lagging effects of C$ depreciation over recent years may be another incremental factor. So might competition and concentration in some sectors that have pricing power.
Second, the job market remains strong. 83,000 jobs were created in June with decent details. Year-to-date job growth of 144k remains solid and probably understated since the January to April period used seasonal adjustment factors that were among the lowest on record comparing like months in history.
Third, the federal government is working toward a major budget in early fall. The BoC would be well advised to wait and see the contents and evaluate the implications for medium-term growth so it doesn’t repeat the mistake of combining excessive monetary and fiscal stimulus.
Fourth, there is high uncertainty surrounding US trade policy developments and Canada’s response. The BoC may wish to wait until it sees clearer evidence. This meeting coincides with the deadline two days later of the postponed tariff hit to Canada. Even if an agreement arises—which appears highly unlikely based on remarks from PM Carney—it seems unlikely that the BoC will have enough details to be confident in the durability, depth and certainty it offers.
Most of the tariff shock that is likely to hit Canada is sector-specific especially on metals. Monetary policy can’t do anything about that as opposed to fiscal and regulatory supports and transition programs. The rest of the economy faces a light tariff hit.
Fifth, while Q2 GDP growth is likely to be soft as noted in the section on the topic in this report, the BoC might look through it as the flip side of the solid 2.2% growth in Q1 with both quarters distorted by tariff front-running effects on order books and trade. They may wish to wait to evaluate data over the second half of this year.
Sixth, the policy rate is already at 2.75% which rests within the BoC’s estimated neutral rate range of 2.25–3.25%. That connotes balanced policy optionality around multiple scenarios as opposed to a perhaps greater case to adjust policy if it were far above neutral.
Seventh, the evidence may suggest that the BoC cut too far too quickly. The BoC ended quantitative tightening earlier than other central banks. The BoC began cutting in May of last year and has cut by 225bps to date—absent concrete evidence that its data dependent mantra was ticking the box on contained inflationary pressures to date.
In all, how can you adjust policy when you haven’t a clue what trade and fiscal policies might unfold and you are still fighting the last inflation fight alongside resilient data like job growth? That merits keeping their powder dry with data to date not indicating any great reason to rush a decision other than on a total policy lark.
Federal Reserve—Performative Theatre
Despite the theatrics, another FOMC decision should come and go like a summer breeze. The real debate begins in earnest when the kiddies go back to school. September’s decision beckons after more data and maybe some clarity around the administration’s policies on trade. At this point, forecasting a cut for September is done in the same lark that motivated markets to keep pushing out easing bets throughout the year.
Wednesday’s statement (2pmET) will be followed by Chair Powell’s press conference (2:30pmET). There will be no projections or dot plot with this one since that was provided at the last meeting.
Markets are priced for no change at this meeting. They remain stuck in the year-long serial pattern of pushing out rate cut bets after getting successive meetings wrong.
Dissenting votes are possible with the most likely ones being Governor Waller and/or Governor Bowman in that order of likelihood.
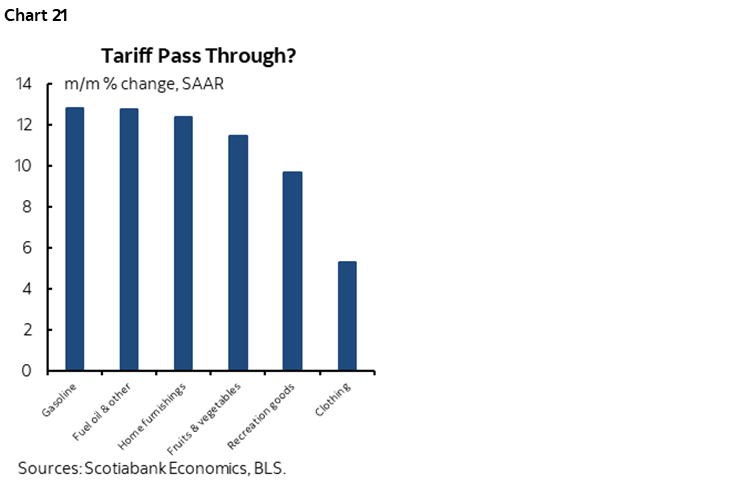
Two key issues will keep the FOMC on hold. One is that the Fed is data dependent and recent data has not supported easier monetary policy up to this point. We’ll get Q2 GDP growth just hours before the Fed on Wednesday and it is expected to remain resilient. Core CPI accelerated in June on a m/m SAAR basis (here) and there were nascent signs of tariff pass through into select categories (chart 21). Soft data like the ISM price gauges serve as a leading indicator of inflation and are rising sharply as covered later in this note. Nonfarm payrolls have remained resilient including June’s 147k rise and the prior month’s 144k gain which is likely ample job growth given that the so-called breakeven rate of job growth that maintains a reasonably stable unemployment rate has moved lower in light of tighter immigration policy and the effects on weaker growth in the labour force.
As an offshoot of this, it’s clearly inconsistent for President Trump and House Speaker Johnson to keep saying that the US has the greatest and strongest and best performing economy on the planet, while nevertheless demanding several percentage points of rate cuts.
Second is that the debate over how trade, fiscal, immigration and regulatory policies may affect the Fed’s dual mandate going forward in future date remains open. The nature of these shocks creates a potential quandary for the Fed in that, for instance, protectionist policies may raise unemployment and inflation simultaneously. Easier monetary policy may be appropriate if growth and the job market sag, but not necessarily if inflation surges. The balance between the two effects and how durable the effects may be will determine appropriate policy actions. Until we have the data over an extended period it may not be advisable to alter course.
That pivots toward the September 17th FOMC meeting and subsequent ones. Multiple rounds of inflation and job market data may be required alongside greater policy clarity and more consistency from the Trump administration. Should tariff pass-through into inflation increase over coming months, then the optics of easing in that environment may be too much to allow the Fed to ease unless payrolls begin falling.
Bank of Japan—Tread Carefully
The Bank of Japan delivers its latest policy decisions with updated projections on Thursday. Markets are priced for no move and consensus unanimously expects no change to the 0.5% target rate. Markets only begin to raise pricing for another rate hike by the October and December meetings and even at that fall shy of full cut pricing.
Key will be the forecasts and Governor Ueda’s guidance. Ueda may continue to generally guide openness toward eventual further policy tightening. Whether he should or not is another matter.
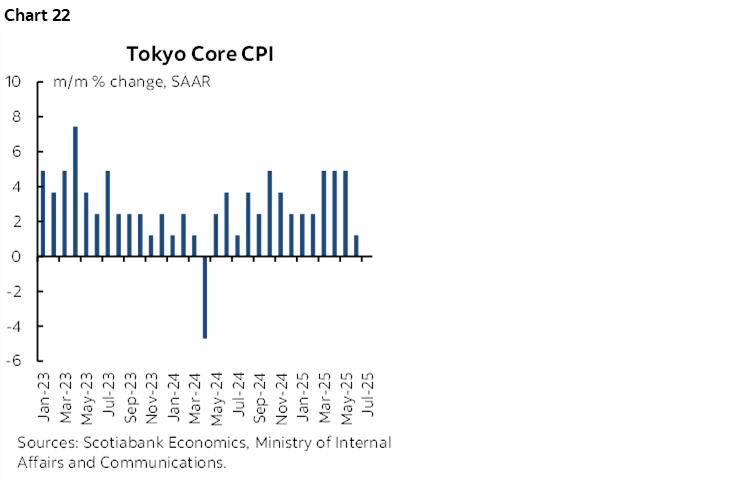
One issue is whether past forces that contributed toward raising inflation that justified tightening will persist or not. The fresh Tokyo measure of core CPI inflation for July was weak again. July’s reading was flat at 0% m/m SA and followed a reading of only 0.1% m/m SA in June (chart 22). Is the surge over? Was it temporarily fed by prior peaks in oil prices in 2023–24 plus peak weakness of the yen in 2024? Are Shunto wage gains not really filtering through to more of the workforce than the under 20% of workers who benefit from the union agreements? Perhaps, but the BoJ will need more evidence than two reports as it refreshes forecasts and guidance at next week’s decision when it is expected to remain on hold.
A second issue is how the BoJ views the recent trade ‘deal’ with the US. It certainly won’t criticize the government’s deal, but will it sound more upbeat on reduced uncertainty or still cautious and circumspect? You could argue both ways. The deal lowers the threatened tariff on Japanese exports to the US from 25% — which was set to take effect on August 1st — to 15%. Additionally, tariffs on Japanese auto and auto parts exports, which represent a significant share of Japan’s total exports to the US, will also be reduced from 27.5% to 15%. In exchange, Japan offered to invest about half a trillion in the US. And yet, as Japan’s negotiator Akazawa put it, there is presently no move toward a legally binding agreement with enforcement and tracking provisions or agreement on implementation.
Third, political uncertainty is hanging in the air. After losing both the lower house election last October and the upper house election this month, PM Ishiba is walking a fine balance in terms of support within his weakened coalition. That could carry implications for other policy arenas, like fiscal policy and immigration particularly as an anti-immigration far right party ascends.
Central Bank of Brazil—A New Wrench
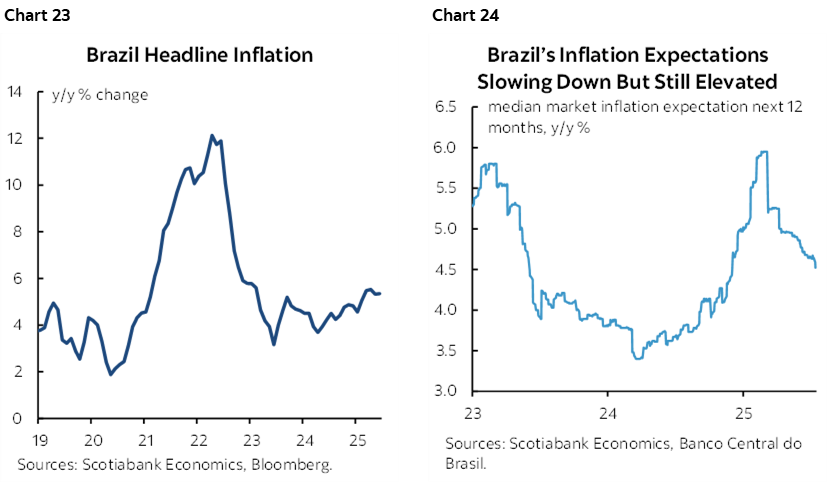
Banco Central do Brasil is widely expected to maintain its Selic rate at 15% on Wednesday.
Inflation remains elevated (chart 23) and so do inflation expectations (chart 24). The central bank may think that the resumption of a tightening cycle that began last September and took the Selic rate up by 450bps to 15%—its highest since 2006—needs to be given more time to work through the economy and bring inflation lower.
The new wrench in the works is Trump’s politically motivated threat to impose a 50% tariff on Brazilian exports to the US unless the Lula administration ceases its prosecutor efforts of former President Bolsonaro who is accused of playing a role in a coup attempt aimed at invalidating the election results when he lost.
Brazil has threatened to retaliate if Trump proceeds this Friday. The net impact of bilateral tariffs on growth and inflation depends upon the course of events on this matter which may mean forward guidance could be rather reserved.
BCCh—Quite a Way to Go
Banco Central de Chile is widely expected to resume easing by cutting its overnight rate by 25bps to 4.75% on Tuesday.
Why? At its June meeting, the bank noted that "If the central scenario of the June IPoM [ed. Monetary Policy Report] materializes, in the following quarters the MPR [ed. Monetary Policy Rate] will be approaching its range of neutral values", which ranges between 3.5% to 4.5%. At 4.75%, the central bank has a way to go before approaching the midpoint. Softening inflation and growth readings offer additional cover for easing at this meeting and so does the threat of US copper tariffs.
BanRep—Split No Longer?
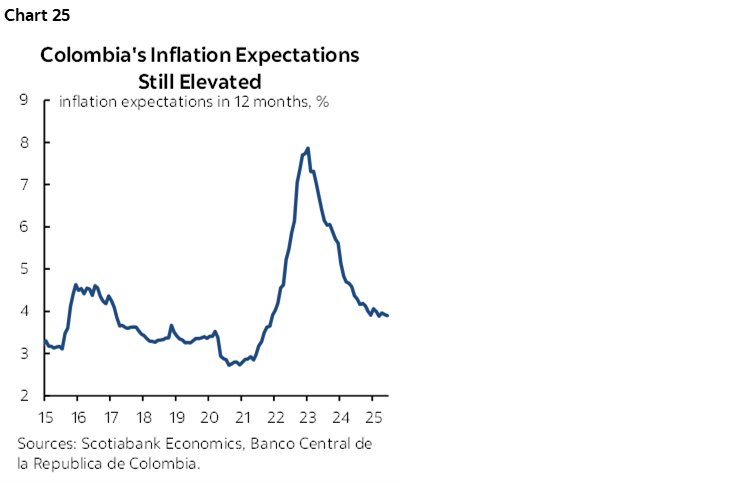
Banco de la Republica de Colombia (BanRep) is widely, but not unanimously, expected to cut its overnight lending rate by 25bps to 9% on Thursday.
There was already somewhat of a bias toward easing among some members at the last meeting on June 27th when the bank held but with a split vote somewhat in favour of easing. Downside risks to growth stemming from US trade policy, softer but not soft recent core inflation (4.9% y/y), lower but not low inflation expectations (chart 25), and a significantly restrictive policy stance are likely to be conveyed as justification for easing but with a careful forward bias.
SARB—They Said So!
The South African Reserve Bank is widely—but not unanimously—expected to cut its policy rate by 25bps to 7% on Thursday. SARB would pick up where it left off the last time it cut back in January in a step that took the rate down by 100bps starting last September.
Previously provided forward guidance noted that "rates move steadily lower in the scenario as inflation comes down". Inflation is currently at the lower end of the 3–6% inflation target range. Trade frictions with the US and trade frictions across the global economy weigh upon the nation’s export exposures.
CANADA’S ECONOMY—A LITTLE NAUGHTY, A LITTLE NICE
Canada refreshes GDP growth figures that will help to round out how the economy performed in Q2.
The final estimate for May GDP arrives on Thursday and is likely to show a modest estimated decline of -0.2% m/m. This is partly based on Statcan’s initial guidance that was provided back on June 27th (-0.1%) plus updated readings and a simple regression model. Details will also be provided this time, since the flash readings only give limited verbal guidance.
The initial estimate for June GDP will also be offered by the agency. Limited readings suggest that the economy may have rebounded to post modest growth of around ¼% m/m SA. Hours worked were up by a large 0.5% m/m and since GDP is hours times labour productivity this gives a bit of a running head start at the estimate. While not based on value-added GDP concepts, other readings also point to strength. Housing starts were slightly higher. Retail sales rebounded with volumes probably up by around 1% m/m or more. Manufacturing volumes were probably flat. The election distortions in April and May will have shaken out of the June figures, while weather was likely more of a support to seasonal activities in June than in May.
In all, if the estimates are in the right ballpark, then Q2 GDP may have stalled out at close to 0% q/q SAAR growth using monthly income-based GDP accounts. That’s not far from our estimate for quarterly expenditure-based GDP that more fully incorporates inventory and net import swings after the wild swings in Q1.
If the June estimate and overall Q2 tracking is on the mark, then the way the quarter evolved and ended could bake-in ¾% q/q SAAR GDP growth into Q3 before we get any actual Q3 data. That’s a modest running head start into more elevated uncertainties.
GLOBAL MACRO—NOT JUST ABOUT NONFARM
This will be a heavy week for broader global economic indicators that will offer significant advances to our understanding of key topics like how global growth is holding up and risks to near-term inflation tracking. Jay Parmar and I have partnered together on portions of the following.
US—Messy GDP, Muted Inflation?
- Nonfarm and the FOMC will clearly dominate the US calendar, but there are several other gems worth flagging.
- Q2 GDP (Wednesday): Q2 GDP is expected to rebound from the -0.5% q/q annualized contraction in GDP, but be careful with the details. Recall that inventories added 2.6 percentage points to Q1 GDP while higher imports (a leakage effect) subtracted 4.7 ppts. Both of these influences were due to tariff front-running activities on order books. Both of these effects could go the other way in Q2. Our estimate is for about 2½% q/q SAAR GDP growth. That’s similar to the Atlanta Fed’s ‘nowcast’ estimate. Key may be consumption in the consumer-driven US economy that is faced by distorting policies. Real consumption growth is likely to post a moderate acceleration to the 1.5–2% q/q SAAR range.
- PI/PS/PCE June (Thursday): The Fed’s preferred inflation gauges are expected to rise by 0.3% for both headline PCE and core PCE excluding food and energy. This is based on what we know about CPI plus estimated differences for weighted components plus the producer price index components of relevance to PCE. Some of the tariff pass through that occurred in select CPI components as previously flagged is likely to be beneath the PCE readings (here). Personal income is expected to accelerate a touch and personal consumption is expected to post continued modest growth in July.
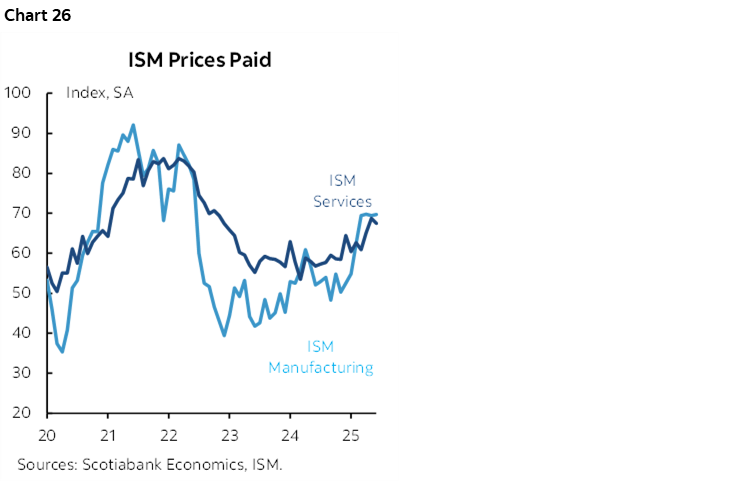
- ISM-manufacturing (Friday): Will it follow the harsh signals sent in the S&P PMIs for July (here)? The word ‘tariff’ appeared 15 times in the S&P’s write-up with tariffs blamed for the second fastest single month increase in prices in the past three years. What ISM surveys say about price pressures is a leading indicator of actual inflation and they’ve been signalling rising price pressures for a while (chart 26). Regional manufacturing surveys from the Fed’s district banks paint a mixed picture with the Empire and Philly measures moving higher, but the Richmond and KC surveys weakening. ISM-services won’t arrive until the following week.
Consumer confidence in July (Tuesday) will lead the rest of the indicators that also include the monthly goods trade balance for June (Tuesday), house prices in May (Tuesday), pending home sales during June as a leading indicator for resales (Wednesday), construction spending in June (Friday) and an expected surge in vehicle sales in July (Friday) with softer prices as explained here.
Europe—Still Resilient?
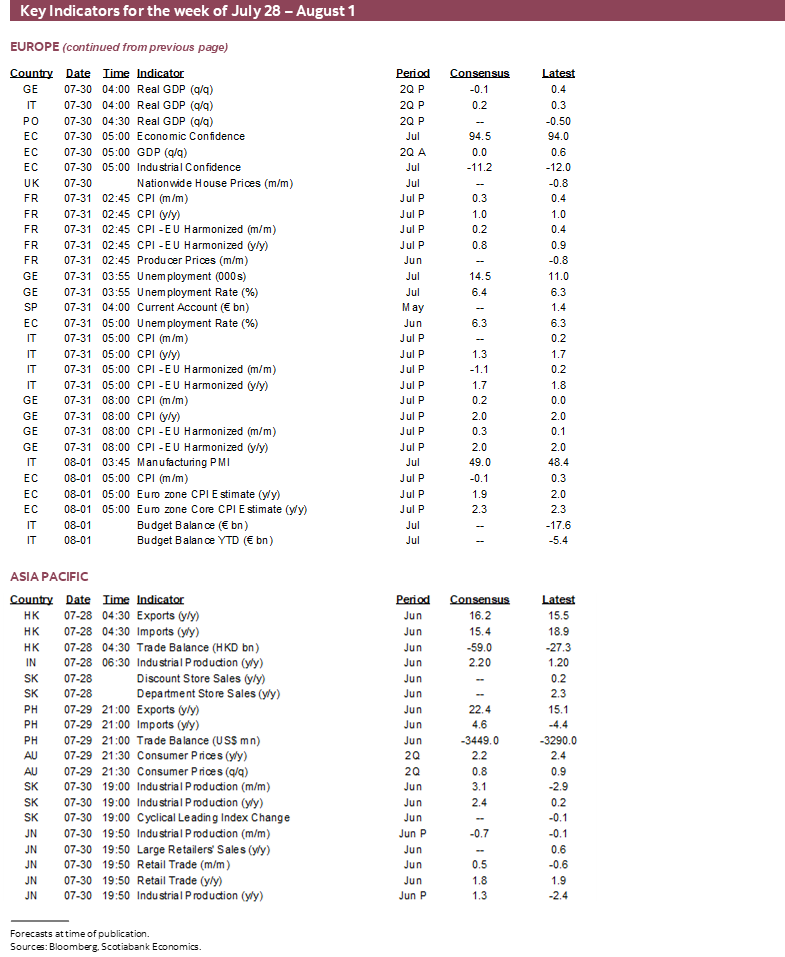
Is the Eurozone economy still resilient? We’ll find out on Wednesday when Q2 GDP is released. The 0.6% q/q SA nonannualized rate of growth in Q1 was recently reference by ECB President Lagarde as among the reasons for standing pat on the deposit rate. Economists expect basically no growth in Q2 and Q3. Spain reports on Tuesday ahead of the other biggest economies the next day. Sweden—outside of the Eurozone—reports on Tuesday.
The other reason that Lagarde cited for standing pat is that CPI inflation was already on the 2% medium-term target while further lagging effects of prior policy easing still lay ahead. She was citing June figures and we’ll get July’s on Friday. Individual country estimates will inform the Eurozone tally in the days before when Spain releases on Wednesday followed by CPI from Germany, France and Italy on Thursday.
Further on the inflation theme will be the focus on the ECB’s 1- and 3-year measures of inflation expectations (Tuesday) and the ECB’s updated wage tracker (Wednesday).
The state of the European consumer will also be in focus. June readings for French consumer spending (Wednesday), German retail sales (sometime this week) and Italian retail sales (Friday) are due out.
China PMIs—Searching for Direction
From China, the release of the state PMI on Wednesday will be watched as a leading indicator of July's economic momentum, given its heavier weighting toward the state-owned enterprises. Both the manufacturing and services components have been hovering near the contraction-expansion threshold in recent months, suggesting a fragile recovery.
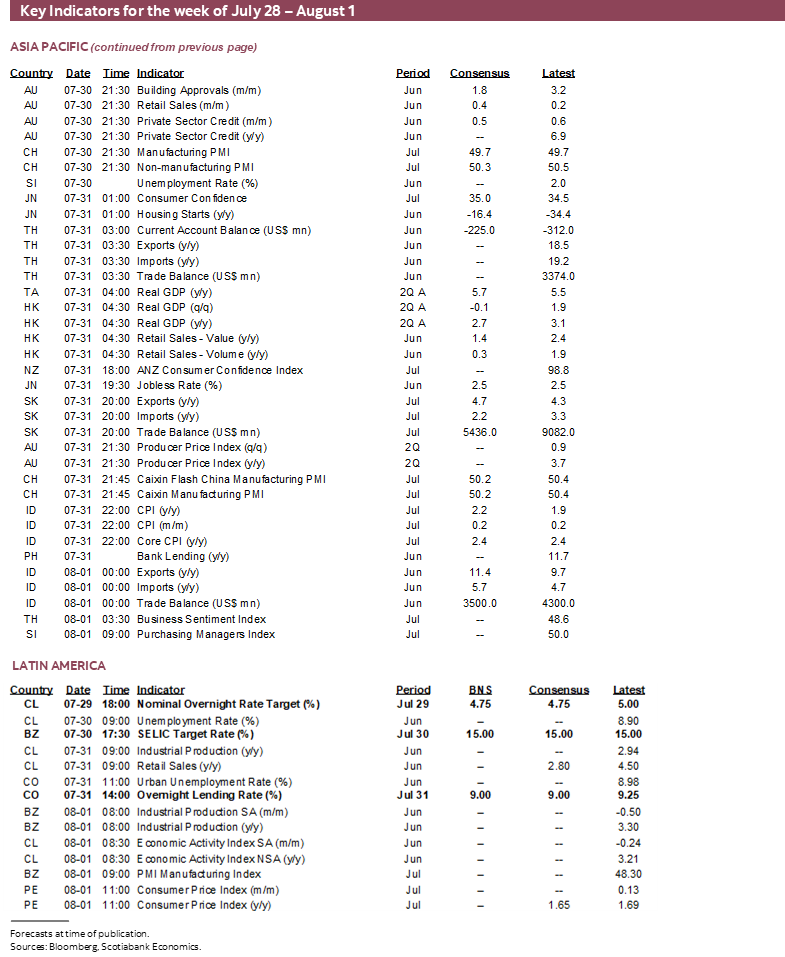
Australia—Teeing Up the RBA’s August Decision
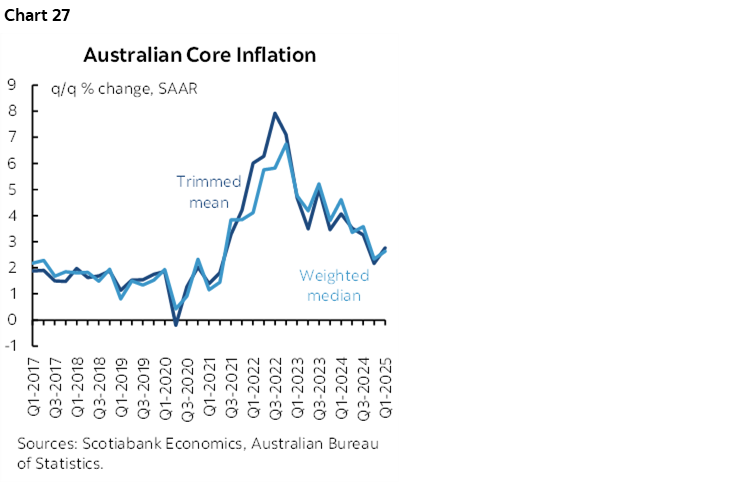
RBA watchers will be closely monitoring Tuesday's Q2 inflation data, which could validate market pricing for a 25bps rate cut at the bank's August 12th meeting. At its last meeting, the bank signaled it would wait for more inflation data before easing further, aiming to ensure progress toward the 2.5% target is sustainable. A key focus will be on the RBA’s core inflation measures—trimmed mean and weighted median—which have remained within the 2–3% target range for the past two quarters (chart 27).
In addition, Thursday's PPI release for Q2 will offer insight into whether producer prices have continued to show resilience and if any renewed cost pressures are emerging.
Beyond inflation, attention will also turn to the health of the Australian consumer, with Q2 retail sales due Wednesday. While monthly retail sales growth through May has been modest, broader household spending data for May showed a strong rebound, offering mixed signals on consumer strength.
LatAm—Mexican Resilience, Peruvian Inflation
Finally, in LatAm, two key indicators will be in focus: Mexico’s Q2 GDP on Wednesday, which will show how the economy fared amid rising U.S. trade uncertainty, and Peru’s latest inflation print ahead of its August 14 policy meeting, where a hold is expected by our LatAm team.
DISCLAIMER
This report has been prepared by Scotiabank Economics as a resource for the clients of Scotiabank. Opinions, estimates and projections contained herein are our own as of the date hereof and are subject to change without notice. The information and opinions contained herein have been compiled or arrived at from sources believed reliable but no representation or warranty, express or implied, is made as to their accuracy or completeness. Neither Scotiabank nor any of its officers, directors, partners, employees or affiliates accepts any liability whatsoever for any direct or consequential loss arising from any use of this report or its contents.
These reports are provided to you for informational purposes only. This report is not, and is not constructed as, an offer to sell or solicitation of any offer to buy any financial instrument, nor shall this report be construed as an opinion as to whether you should enter into any swap or trading strategy involving a swap or any other transaction. The information contained in this report is not intended to be, and does not constitute, a recommendation of a swap or trading strategy involving a swap within the meaning of U.S. Commodity Futures Trading Commission Regulation 23.434 and Appendix A thereto. This material is not intended to be individually tailored to your needs or characteristics and should not be viewed as a “call to action” or suggestion that you enter into a swap or trading strategy involving a swap or any other transaction. Scotiabank may engage in transactions in a manner inconsistent with the views discussed this report and may have positions, or be in the process of acquiring or disposing of positions, referred to in this report.
Scotiabank, its affiliates and any of their respective officers, directors and employees may from time to time take positions in currencies, act as managers, co-managers or underwriters of a public offering or act as principals or agents, deal in, own or act as market makers or advisors, brokers or commercial and/or investment bankers in relation to securities or related derivatives. As a result of these actions, Scotiabank may receive remuneration. All Scotiabank products and services are subject to the terms of applicable agreements and local regulations. Officers, directors and employees of Scotiabank and its affiliates may serve as directors of corporations.
Any securities discussed in this report may not be suitable for all investors. Scotiabank recommends that investors independently evaluate any issuer and security discussed in this report, and consult with any advisors they deem necessary prior to making any investment.
This report and all information, opinions and conclusions contained in it are protected by copyright. This information may not be reproduced without the prior express written consent of Scotiabank.
™ Trademark of The Bank of Nova Scotia. Used under license, where applicable.
Scotiabank, together with “Global Banking and Markets”, is a marketing name for the global corporate and investment banking and capital markets businesses of The Bank of Nova Scotia and certain of its affiliates in the countries where they operate, including; Scotiabank Europe plc; Scotiabank (Ireland) Designated Activity Company; Scotiabank Inverlat S.A., Institución de Banca Múltiple, Grupo Financiero Scotiabank Inverlat, Scotia Inverlat Casa de Bolsa, S.A. de C.V., Grupo Financiero Scotiabank Inverlat, Scotia Inverlat Derivados S.A. de C.V. – all members of the Scotiabank group and authorized users of the Scotiabank mark. The Bank of Nova Scotia is incorporated in Canada with limited liability and is authorised and regulated by the Office of the Superintendent of Financial Institutions Canada. The Bank of Nova Scotia is authorized by the UK Prudential Regulation Authority and is subject to regulation by the UK Financial Conduct Authority and limited regulation by the UK Prudential Regulation Authority. Details about the extent of The Bank of Nova Scotia's regulation by the UK Prudential Regulation Authority are available from us on request. Scotiabank Europe plc is authorized by the UK Prudential Regulation Authority and regulated by the UK Financial Conduct Authority and the UK Prudential Regulation Authority.
Scotiabank Inverlat, S.A., Scotia Inverlat Casa de Bolsa, S.A. de C.V, Grupo Financiero Scotiabank Inverlat, and Scotia Inverlat Derivados, S.A. de C.V., are each authorized and regulated by the Mexican financial authorities.
Not all products and services are offered in all jurisdictions. Services described are available in jurisdictions where permitted by law.