Next Week's Risk Dashboard
- How nonfarm payrolls could be weak on a technicality…
- …with some support from fundamentals
- Why Canadian jobs might rebound…
- …and further inform the BoC’s coming decision
- Negara to hold
- Inflation updates: Eurozone, LatAm and Asia
- Light global indicators
- Canadian and US markets shut on Monday
Chart of the Week
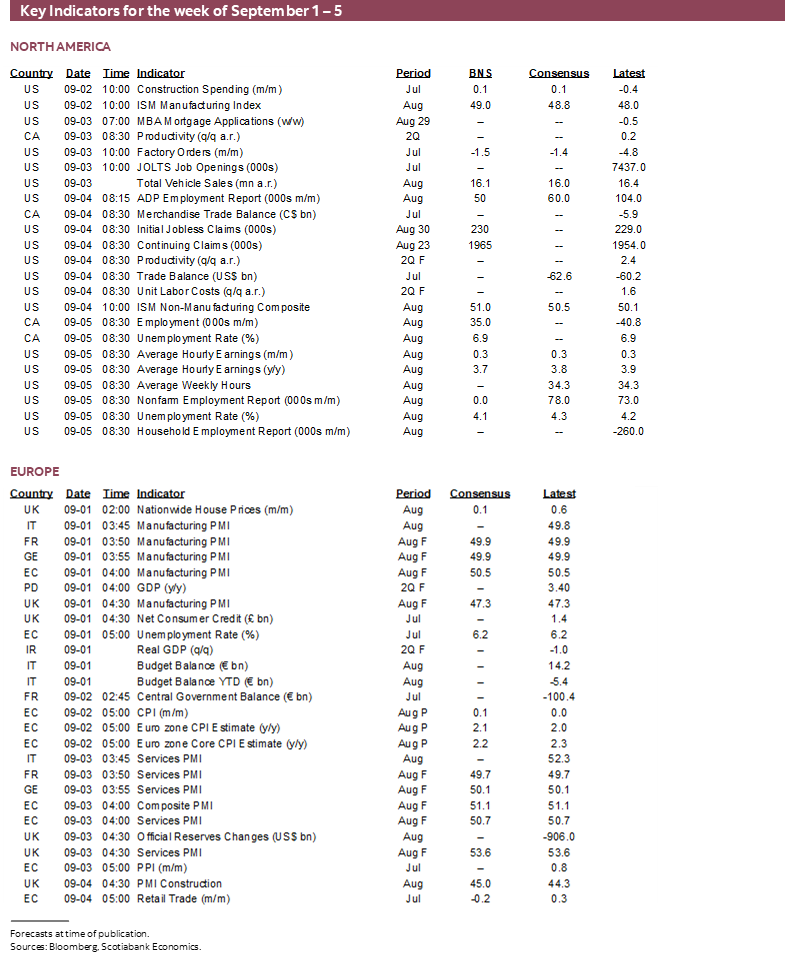
What’s the Federal Reserve to do now? The answer to this question might become more informed after this week, assuming Chair Powell’s Jackson Hole speech hasn’t already set the script for a cut on September 17th which it probably has. Nonfarm payrolls will be the marquee development when it arrives on Friday of this coming shortened week in the US and Canada.
Not that there is any doubt about the appropriate course of action, if one listens to VP Vance who said this the other day:
"I don't think we allow bureaucrats to make decisions about monetary policy and interest rates without any input from the people that were elected to serve the American people...POTUS is much better able to make these determinations."
I know where I stand on that quote and assume (hope!) that most of the readers of a publication like this are of similar minds. And yet evidence and risks face the distinct possibility of being in the backseat to politics as the Trump administration moves to stack the Board of Governors and possibly move next toward messing with the regional Presidents on the FOMC in an all-out effort toward the Magafication of the Federal Reserve (here). This is an excellent example of how politics, economics and markets are inseparable from one another in our age.
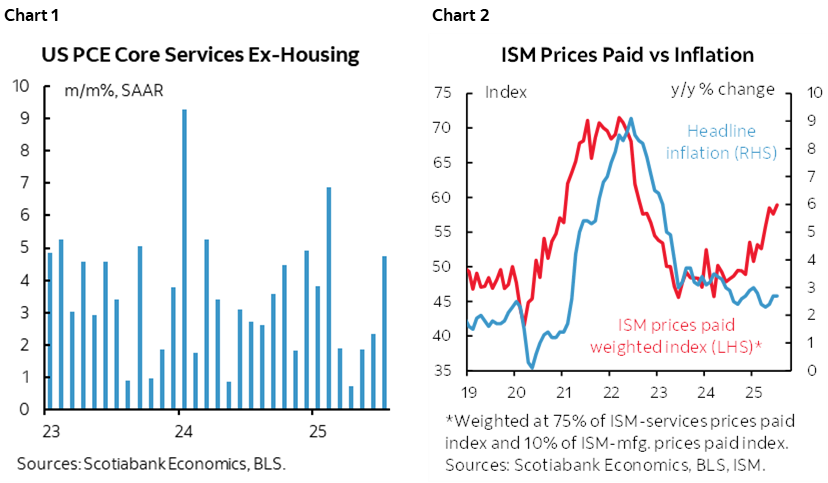
Powell’s JH speech pivoted more toward the full employment side of the mandate than the price stability part and sounded dovish on the latter with transitory talk that avoided use of the maligned term. He may have spoken too soon since we just got two back-to-back months of fairly elevated core inflation risk driven heavily not by tariffs, but more disturbingly by stubbornly high service sector price inflation (chart 1). Purchasing manager surveys indicate a coming surge of inflation that may or may not build upon itself as supply chains are roiled (chart 2).
If I’m right on payrolls, however, then the Fed’s concern might become more dovish yet—correctly or not on its behalf and whether for the right reasons on what could drive nonfarm. My argument for nonfarm payrolls to be soft is more rooted in a technicality than something going severely wrong in the US economy, but there is a supporting case in some of the other arguments.
After all, the Atlanta Fed’s ‘nowcast’ for Q3 GDP growth is running at 3.5% q/q SAAR after revising it up by nearly a percentage point in the wake of better than expected figures for net merchandise trade which may be an overreaction. Over time, GDP growth and employment growth tend to be pretty correlated. The regional district bank’s Taylor Rules for US monetary policy were updated in the wake of recent data and continue to indicate that policy is about right; presumably this is behind voices like Atlanta’s Bostic who are more cautious toward easing.
Please read on for the reasons behind my flat nonfarm estimate with more downside than upside risk, but treat it as one opinion alongside others in the market that are all dealing with a high noise factor around payrolls. The 90% confidence interval for monthly changes in nonfarm payrolls is about +/-130,000. That means in repeated sampling 90 times out of 100 the estimated job change will land somewhere between the estimate minus 130k and the estimate plus 130k. Still, I think the logic around a weak print is compelling.
Canadian jobs will also matter perhaps a great deal to the September 17th BoC decision when they arrive at the same time as nonfarm. A rebound is expected and would arrive in the wake of a much stronger set of GDP numbers than the headline estimates indicated (here). After that, it’s onto Canadian CPI the week after.
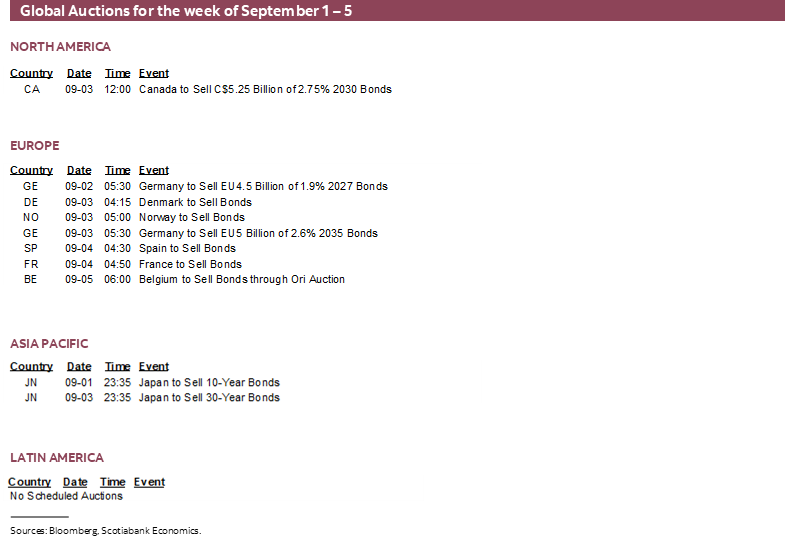
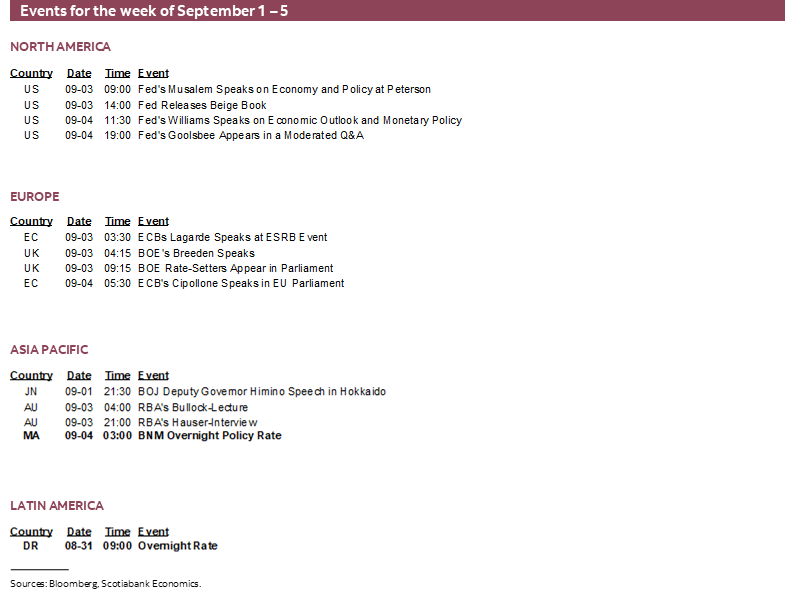
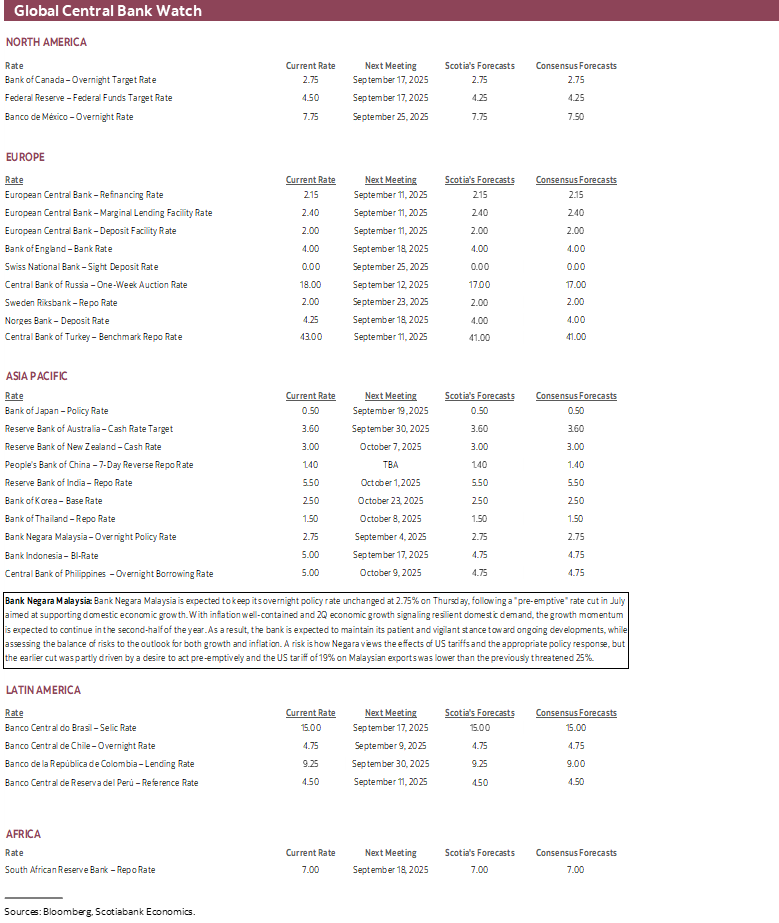
Central banks will be fairly quiet with just Negara on tap alongside some Fed- and ECB-speak. The rest of the global macro line-up is also highlighted.
US JOBS—MIRACLE NEEDED
It may take a miracle for payrolls to stay in the black on Friday when August’s nonfarm reading and related labour force gauges get updated. Even if they do, it’s likely to be a small gain, and there is solid risk of a negative payrolls report. A weakish number would likely cement a rate cut on September 17th if it isn’t already largely assured. A low probability big gain would be like a spit into the wind for doves.
My estimates are for zero change in payrolls but a slight dip in the unemployment rate. The UR is a totally different animal drawn from the separate household survey and after that survey registered a 260k loss in jobs and a smaller 38k decline in the labour force I figure the balance may pivot the other way this time.
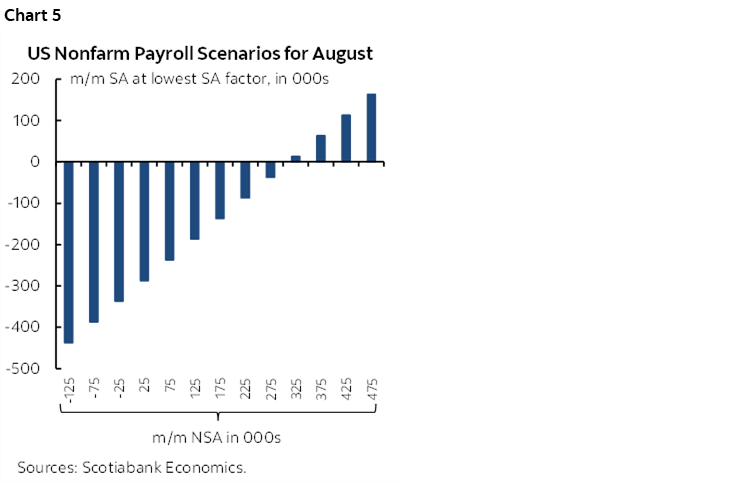
What’s the foundation for such a nonfarm payrolls estimate? It’s mostly in the seasonality. Anything less than about 310k m/m in seasonally unadjusted terms paired with last August’s nonfarm seasonal adjustment factor would reveal a drop in seasonally adjusted payrolls. Flat may be conservative.
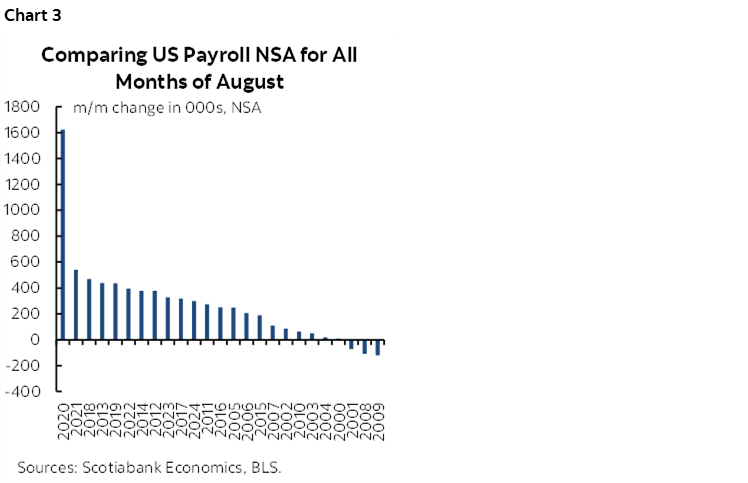
Why emphasize those numbers? Because for one thing, a 310k m/m NSA change is in line with historical norms for like months of August over time (chart 3); in fact, it’s relatively high because since 2000, the median NSA change has been 252k with a mean of 272k. It could easily be weaker, possibly stronger.
My judgement is that in the current context there are greater odds of the NSA change being on the softer side. Revised payrolls over recent months are clearly revealing some combination of greater unease toward hiring amid uncertainty, and data quality issues I’ll return to.
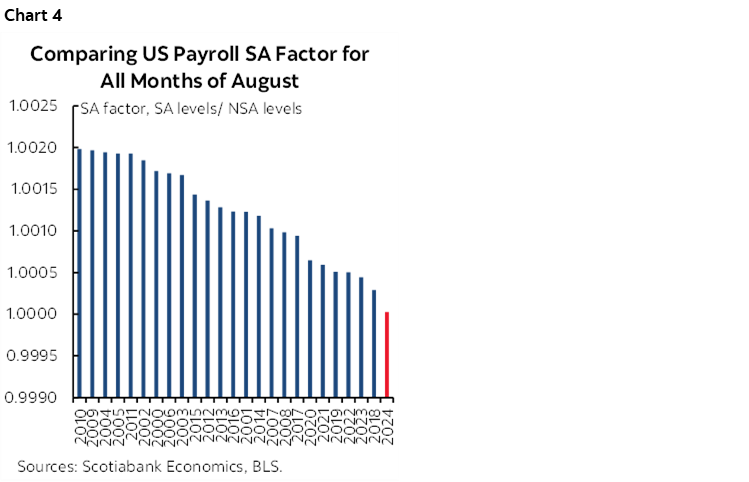
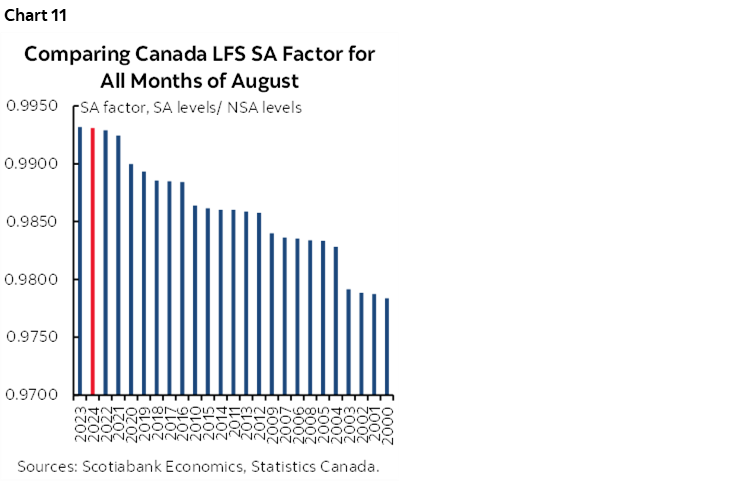
As for the seasonal adjustment factor, chart 4 shows that August’s SA factor has been steadily declining over the years. There is a recency bias skewed toward the freshest 3–4 years or so and that is the pandemic and post-pandemic period during which the timing of macro shocks and policy responses messed everything up. If the pattern continues, then August 2025 could face a similar to lower SA factor.
Except that a fly in the ointment is that the BLS is slightly adjusting the SA factors of late. They were revised a little lower for both May and June in the July payrolls report that included the largest two-month combined revision to seasonally adjusted payrolls since 2020. Still, these were revisions to SA factors after the initial estimates were provided.
In any event, chart 5 shows what would happen to seasonally adjusted payrolls using last August’s SA factor combined with various estimates for the m/m seasonally unadjusted change in payrolls. Most scenarios point toward a drop. Again, I only went flat.
Another argument for a weak payrolls report could be that the information that is contained within the recent numbers signals further softness ahead, although I don’t see much statistical evidence of this connection between current and lagging readings in the past possibly except for key turning points.
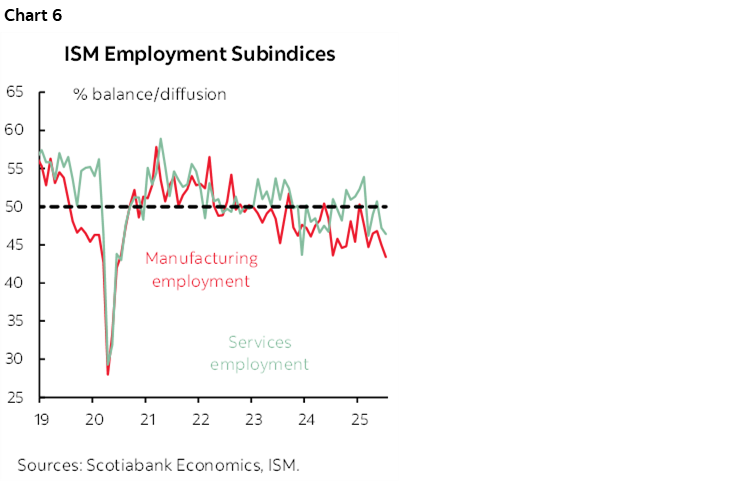
Purchasing managers’ indices are shedding mixed insights. The S&P PMIs that are more weighted toward international operations show hiring resilience, but the ISM gauges that the Fed has historically followed more closely indicate hiring weakness (chart 6).
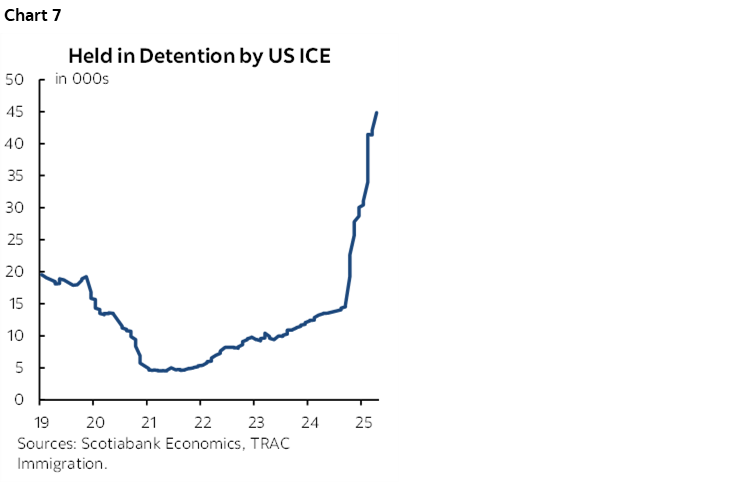
Soaring ICE detentions are also impairing the health of the labour force both directly (chart 7) and indirectly by driving fear in favour of avoiding outside activities across many millions of people residing in the US who are undocumented.
Along the way toward nonfarm we’ll also get refreshed readings for the Challenger mass layoffs report (Thursday) that has fallen back of late in seasonally unadjusted terms, ADP payrolls on Thursday, and both employment subindices to the ISM-manufacturing and ISM-services gauges.
It’s doubtful that those readings would motivate any change in the guesstimate. Other information we have to go by includes readings like a slight increase in initial jobless claims between reference periods and little change in the consumer confidence reading for jobs plentiful.
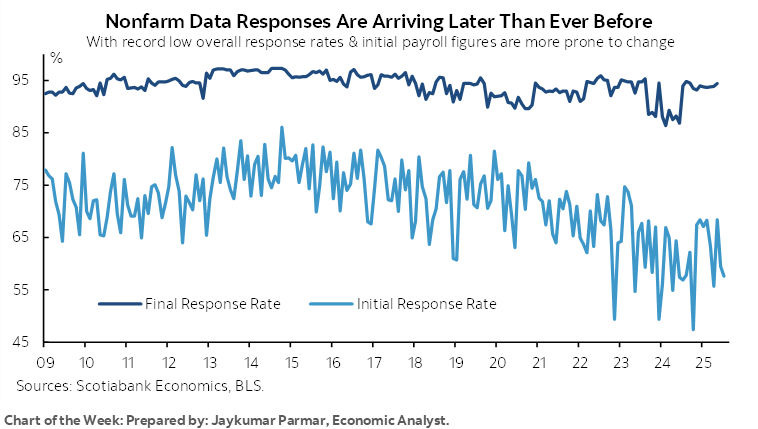
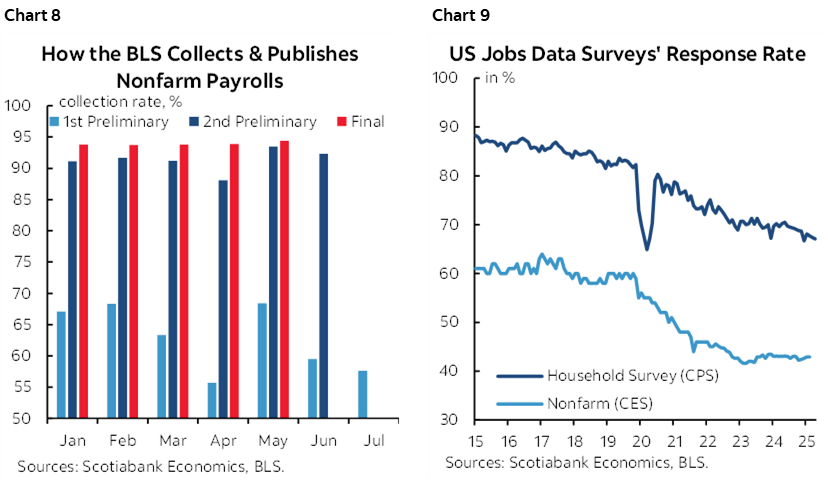
A further risk to the nonfarm call is what happens to revisions this time. The BLS is clearly having serious issues with response rates and has been for a long time now. The initial response rates are compared to subsequent response rates in later revisions in chart 8. As new information arrives through fuller responses the ultimate picture can be wildly different and especially at today’s historically low response rates (chart 9). Can the BLS do a better job? Are budget cuts exacting a toll? The latter is only a recent effect. Or does this generally reflect survey fatigue among households, like dodging pollsters in shopping centers, not picking up phones if the number isn’t recognized because it’s a telemarketer, or something else like better things to do with one’s time?
And take it all with a grain of salt because just days later on the following Tuesday we’ll get what may be more important figures from the BLS. They will be the annual benchmark revisions to nonfarm payrolls up to March of this year. They can be large but be careful toward overly confident estimates of their size. The estimates from the Current Employment Statistics are benchmarked to the Quarterly Census of Employment and Wages (QCEW) up to March of each year. Attempts to estimate how large the revisions may be draw upon state level data which in turn can be heavily revised and therefore unreliable. Let’s just see the numbers.
Next up will be when E.J. Antoni takes over as BLS Commissioner assuming the Senate doesn’t get in his way. His lack of qualifications for the role and heretical views may put us all into uncharted territory in terms of the reliability of data on US jobs and inflation.
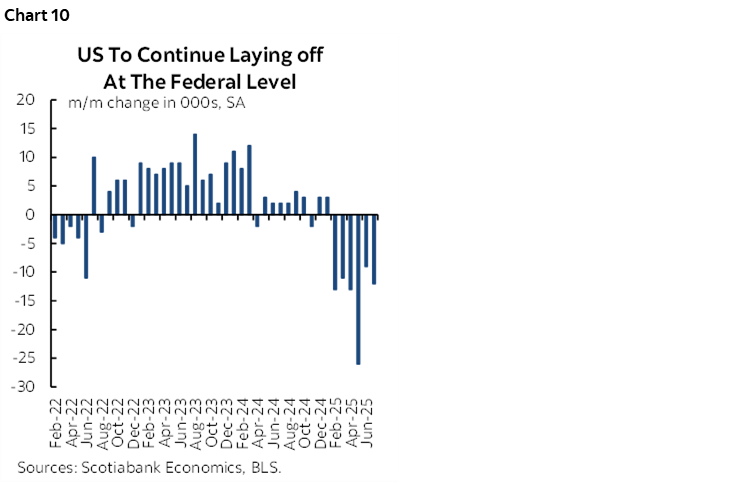
Looking ahead to future payroll reports involves bracing for October payrolls in November. An estimated 300,000 federal government workers are still on payroll but not working and face acceptance of resignation packages terminating their employment by the end of September. There are only about 84k fewer federal government employees on net so far this year (chart 10). Departures may pick up in August and September before most drop off afterward and may or may not be absorbed in other jobs.
CANADIAN JOBS—NARRATIVES AND NOISE
Canada refreshes jobs and related statistics for the month of August in the Labour Force Survey on Friday. It could significantly influence market pricing as the last jobs report before the September 17th Bank of Canada decision.
My estimate is for a gain of 35k and a stable unemployment rate of 6.9%. As always, it’s a guesstimate in light of the +/-57k 90% confidence band around the estimated monthly changes in employment. There are some nevertheless some supporting narratives.
June’s large 83k gain gave way to a 41k loss in July but 83% of that was in the 15–24 category heavily dominated by students. Their employment prospects have probably been tamped down in the summer jobs market of recent years by the flood of temporary residents through previously relaxed immigration policy. Excluding them reveals a net gain of 67k jobs for men and women aged 25+ over June and July. The underlying trend in the job market is not as weak as more dovish voices make out and this volatility could shake out in the coming report.
Further, seasonal adjustment factors are likely to overstate employment growth this August. Recent SA factors have been among the highest on record when comparing like months of August over time (chart 11). Pair that with even a modest seasonally unadjusted drop in jobs and a robust SA factor could spit out a solid employment gain.
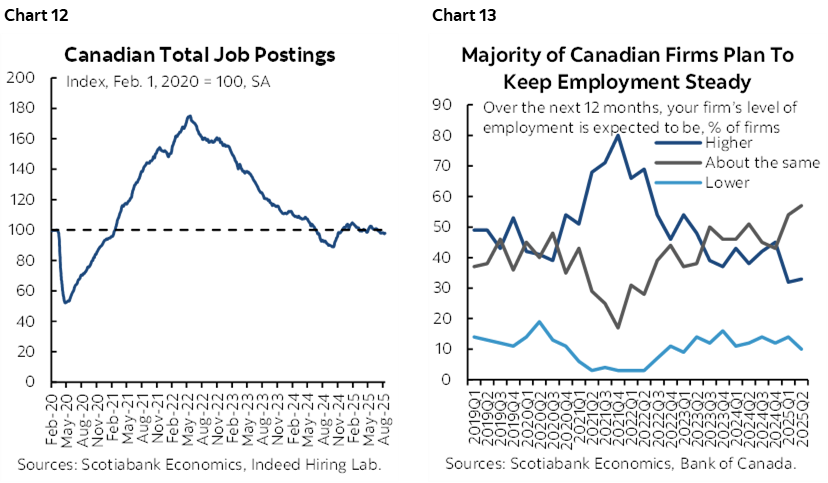
Aside from statistical quirks, job postings are well off the peak but still holding firm (chart 12). Small businesses are recently signalling higher hiring appetite in the CFIB’s measure, and most businesses are saying they don’t on downsizing (chart 13).
The Air Canada strike hit in the LFS reference week. Striking workers mainly have a direct effect through hours worked more so than employment if the workers respond that they have a reasonable expectation of returning to work. Indirect effects may have nevertheless been disruptive upon activity and hiring in sectors heavily reliant upon air travel but I doubt this will be a meaningful influence.
In any event, Canada’s job market is holding up. The unemployment rate of 6.9% is somewhat higher than the OECD guesstimated range for the equilibrium rate of unemployment in Canada.
Canada has gained 103,000 jobs year-to-date in 2025 through to July. Statcan raised a few eyebrows in its last LFS write-up by stating there was no job growth this year and then in the next sentence defined that to be since January. It’s unclear why they did so, especially since there may be changed hiring patterns and seasonality behind 115k jobs created in January 2023, 44k in January 2024, and then 76k in January 2025. Instead of cherry-picking by omitting outsized gains in recent months of January that may be distorted and pulled forward from subsequent employment gains, perhaps smooth the trend.
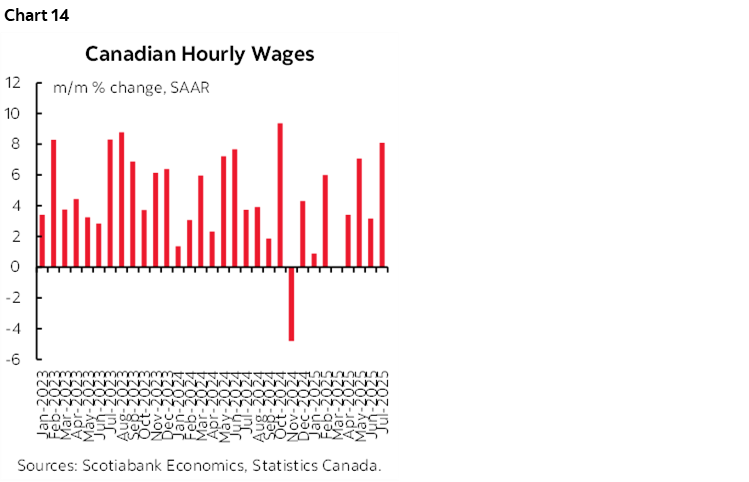
And yet what continues to matter to the Bank of Canada is the signal sent via strong wage growth in recent months (chart 14). Canada’s job market is a hybrid of the US and European markets; one-third of workers in Canada are subject to collective bargaining exercises versus about 10% in the US. That makes wage settlements in those agreements more important in Canada as we still wait for these folks to get around to updating data since January. Wage settlements are strong because they are continuing to reset wage agreements struck 3–4 years ago on average across the agreements. Slack or not, inflation-adjusted wage pressures in Canada continue to outpace moribund productivity. The combination of real wage gains—a direct expense to employers—and not getting as much in return by way of growth in output per hour worked—which is productivity—is a one-two punch to the gut in terms of wage pressures on inflation risk.
CENTRAL BANKS—ASIAN CENTRAL BANKS TURNING MORE GUARDED
Bank Negara Malaysia will be the only central bank we cover to deliver a policy decision this week on Thursday.
Negara is expected to keep its overnight policy rate unchanged at 2.75% following a "pre-emptive" rate cut in July that was aimed at supporting domestic economic growth. With inflation well-contained and 2Q economic growth signaling resilient domestic demand, the growth momentum is expected to continue in the second half of the year. As a result, the bank is expected to maintain its patient and vigilant stance toward ongoing developments, while assessing the balance of risks to the outlook for both growth and inflation.
A risk is how Negara views the effects of US tariffs and the appropriate policy response, but the earlier cut was partly driven by a desire to act pre-emptively and the US tariff of 19% on Malaysian exports was lower than the previously threatened 25%. Recall that other Asian central banks have recently become less dovish on the policy bias including Bank of Korea and Bangko Sentral ng Pilipinas this past week.
There will also be no shortage of central bank-speak over the week. ECB President Lagarde speaks on Wednesday. Several Federal Reserve officials speak throughout the week along with the release of Wednesday’s Beige Book of regional US economic conditions.
GLOBAL MACRO
The rest of the global macro line-up is highlighted in chart 15. US and Canadian markets will be shut for Labour Day on Monday.
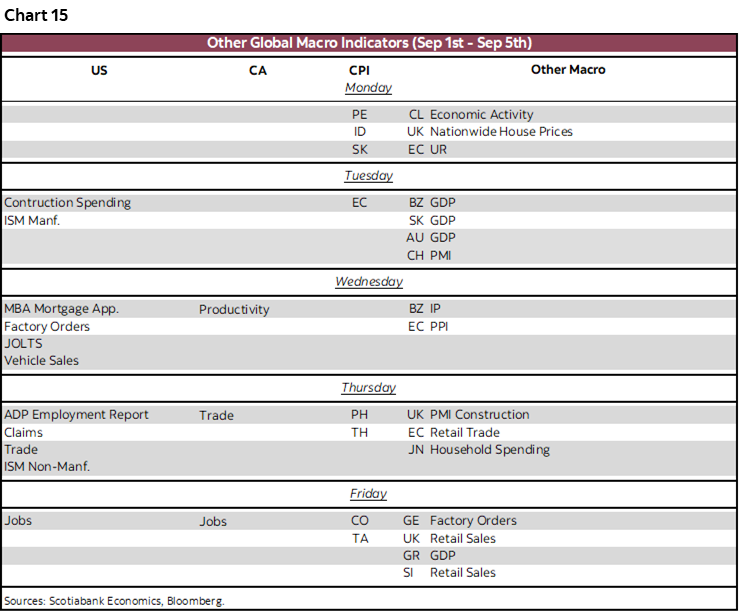
Key among the releases will be inflation readings from several countries and US ISM gauges.
Eurozone CPI (Tuesday) should carry modest market risk in the wake of Friday’s updates across France, Spain, Italy and Germany.
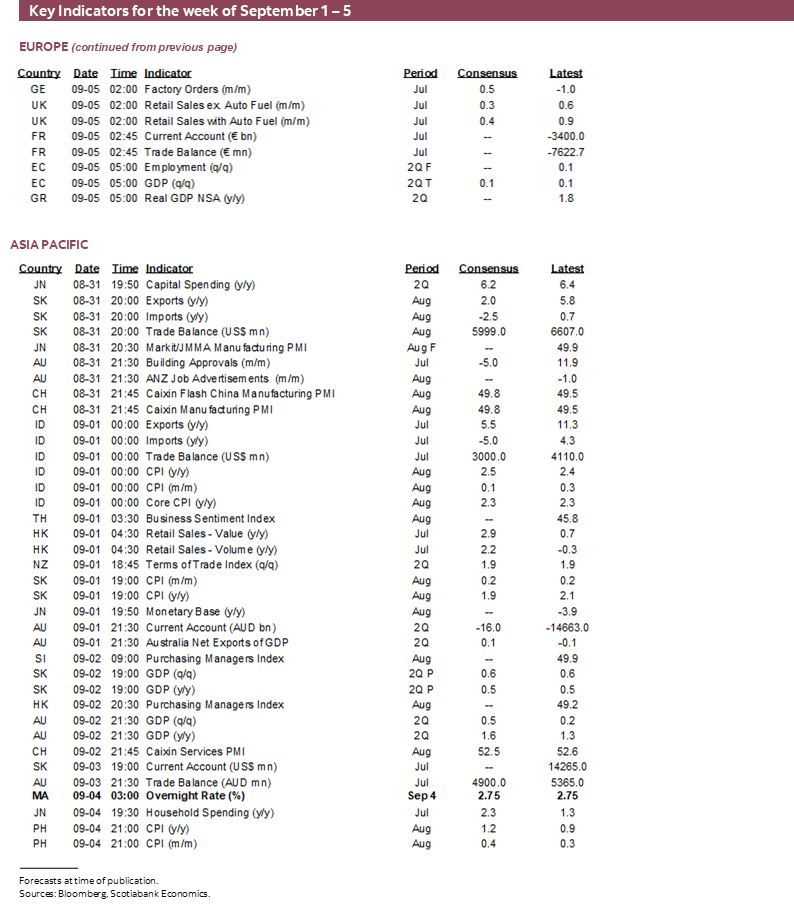
CPI figures across LatAm and Asia will be refreshed from Monday through Friday.
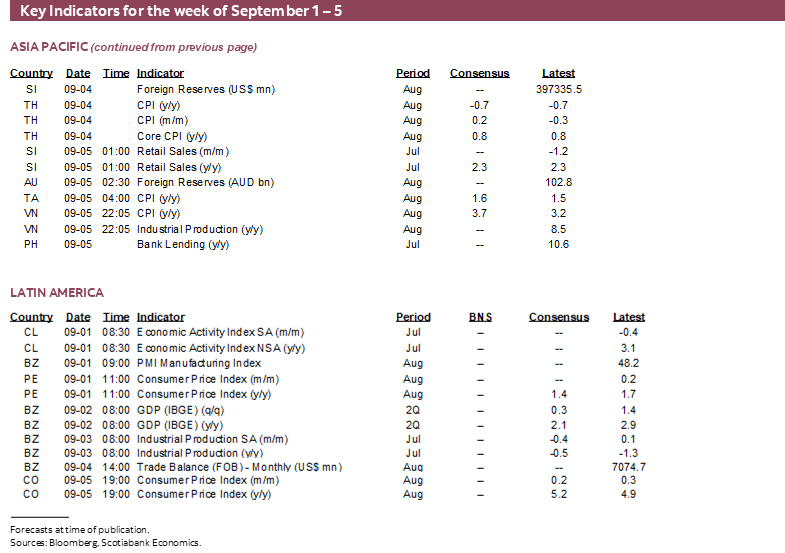
Monday brings out updates from Peru, Indonesia and South Korea. Then Sweden, Switzerland, Philippines, and Thailand report on Thursday with Colombia and Taiwan wrapping it up on Friday.
The balance of the US regional manufacturing surveys combined with developments in sectors—like aerospace—that are under-sampled in those surveys could drive a gain in ISM-manufacturing (Tuesday) but still at contractionary levels. ISM-services on Thursday matters more given that services outweigh manufacturing by a country mile in the US economy regardless of romanticized notions that speak otherwise.
DISCLAIMER
This report has been prepared by Scotiabank Economics as a resource for the clients of Scotiabank. Opinions, estimates and projections contained herein are our own as of the date hereof and are subject to change without notice. The information and opinions contained herein have been compiled or arrived at from sources believed reliable but no representation or warranty, express or implied, is made as to their accuracy or completeness. Neither Scotiabank nor any of its officers, directors, partners, employees or affiliates accepts any liability whatsoever for any direct or consequential loss arising from any use of this report or its contents.
These reports are provided to you for informational purposes only. This report is not, and is not constructed as, an offer to sell or solicitation of any offer to buy any financial instrument, nor shall this report be construed as an opinion as to whether you should enter into any swap or trading strategy involving a swap or any other transaction. The information contained in this report is not intended to be, and does not constitute, a recommendation of a swap or trading strategy involving a swap within the meaning of U.S. Commodity Futures Trading Commission Regulation 23.434 and Appendix A thereto. This material is not intended to be individually tailored to your needs or characteristics and should not be viewed as a “call to action” or suggestion that you enter into a swap or trading strategy involving a swap or any other transaction. Scotiabank may engage in transactions in a manner inconsistent with the views discussed this report and may have positions, or be in the process of acquiring or disposing of positions, referred to in this report.
Scotiabank, its affiliates and any of their respective officers, directors and employees may from time to time take positions in currencies, act as managers, co-managers or underwriters of a public offering or act as principals or agents, deal in, own or act as market makers or advisors, brokers or commercial and/or investment bankers in relation to securities or related derivatives. As a result of these actions, Scotiabank may receive remuneration. All Scotiabank products and services are subject to the terms of applicable agreements and local regulations. Officers, directors and employees of Scotiabank and its affiliates may serve as directors of corporations.
Any securities discussed in this report may not be suitable for all investors. Scotiabank recommends that investors independently evaluate any issuer and security discussed in this report, and consult with any advisors they deem necessary prior to making any investment.
This report and all information, opinions and conclusions contained in it are protected by copyright. This information may not be reproduced without the prior express written consent of Scotiabank.
™ Trademark of The Bank of Nova Scotia. Used under license, where applicable.
Scotiabank, together with “Global Banking and Markets”, is a marketing name for the global corporate and investment banking and capital markets businesses of The Bank of Nova Scotia and certain of its affiliates in the countries where they operate, including; Scotiabank Europe plc; Scotiabank (Ireland) Designated Activity Company; Scotiabank Inverlat S.A., Institución de Banca Múltiple, Grupo Financiero Scotiabank Inverlat, Scotia Inverlat Casa de Bolsa, S.A. de C.V., Grupo Financiero Scotiabank Inverlat, Scotia Inverlat Derivados S.A. de C.V. – all members of the Scotiabank group and authorized users of the Scotiabank mark. The Bank of Nova Scotia is incorporated in Canada with limited liability and is authorised and regulated by the Office of the Superintendent of Financial Institutions Canada. The Bank of Nova Scotia is authorized by the UK Prudential Regulation Authority and is subject to regulation by the UK Financial Conduct Authority and limited regulation by the UK Prudential Regulation Authority. Details about the extent of The Bank of Nova Scotia's regulation by the UK Prudential Regulation Authority are available from us on request. Scotiabank Europe plc is authorized by the UK Prudential Regulation Authority and regulated by the UK Financial Conduct Authority and the UK Prudential Regulation Authority.
Scotiabank Inverlat, S.A., Scotia Inverlat Casa de Bolsa, S.A. de C.V, Grupo Financiero Scotiabank Inverlat, and Scotia Inverlat Derivados, S.A. de C.V., are each authorized and regulated by the Mexican financial authorities.
Not all products and services are offered in all jurisdictions. Services described are available in jurisdictions where permitted by law.