- Core CPI was higher than consensus
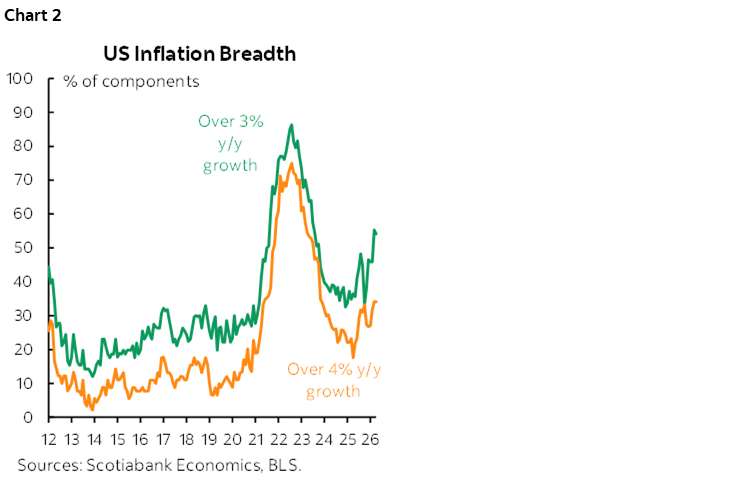
- Breadth of price increases remains high
- Gas and groceries were higher as expected
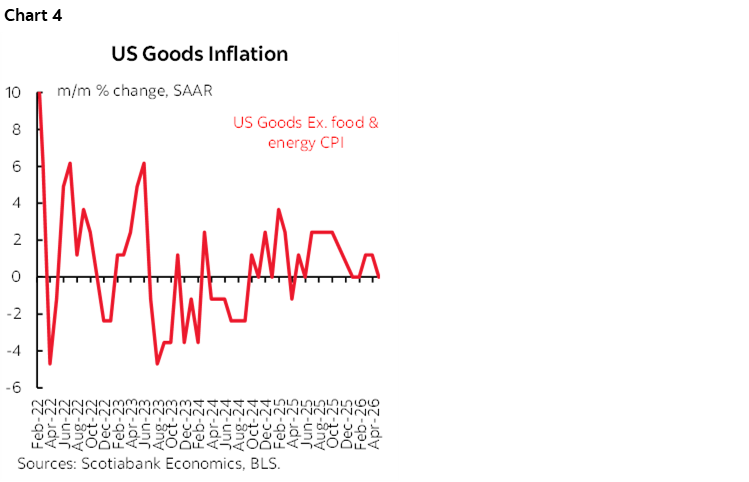
- Core goods prices were tame again but this may not last
- PCE effects also depend upon tomorrow’s PPI
- Watch for trimmed mean CPI estimate
- US CPI / core CPI, m/m %, SA, April:
- Actual: 0.6 / 0.4
- Scotia: 0.7 / 0.4
- Consensus: 0.6 / 0.3
- Prior: unrevised from 0.9 / 0.2
Core CPI inflation matched my estimate but it’s important to remove shelter this time. Upon doing so, core services inflation accelerated in ways that continue to defy linkages with wages, while the breadth of price increases continues to rise.
Markets reacted to the data and then hawkish comments by Chicago Fed President Goolsbee by pushing the US 2s yield higher and adding a slight amount to the roughly 10bps
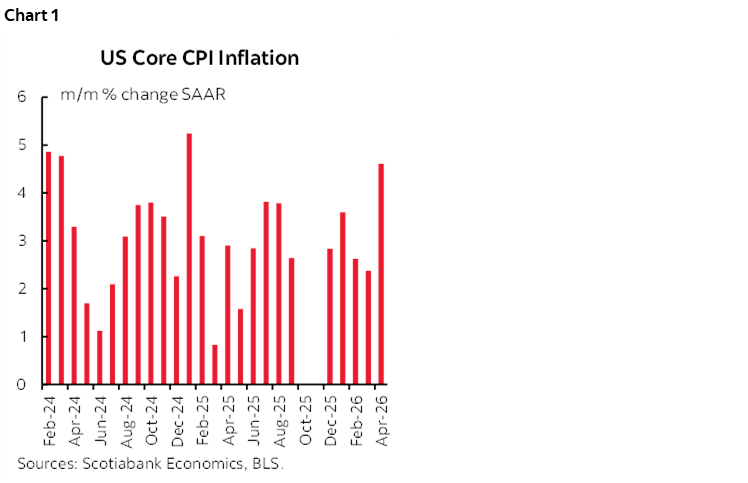
Chart 1 shows core CPI accelerated to 4.6% m/m at a seasonally adjusted and annualized rate (SAAR).
The breadth of price increases remains very high (chart 2).
The reading was not light even after removal of the statistical quirk represented by shelter’s treatment. Shelter surged by 0.6% m/m SA with rent up 0.6% and owners’ equivalent rent up 0.5%. A good part of these effects traced themselves to the BLS merely catching up to more properly capturing shelter given April CPI was the first chance for it to address last October’s omission of shelter prices due to the government shutdown. That omission carried lasting effects upon the shelter methodology. Look through this effect as a temporary statistical quirk as shelter is likely to be softer next time.
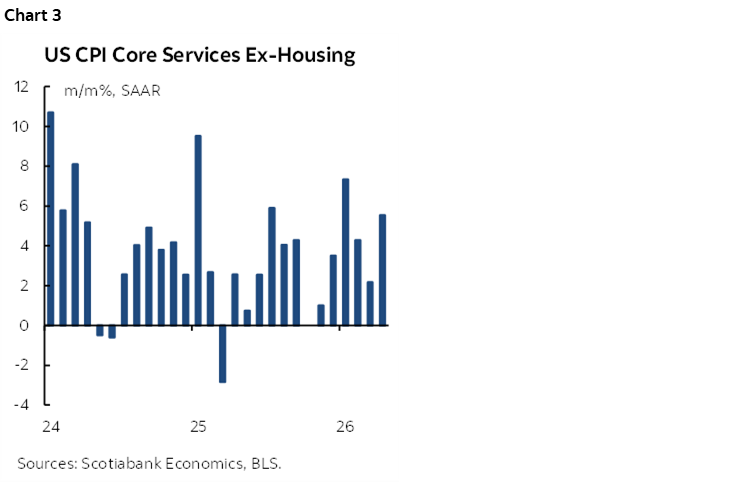
What is key, however, is that core services CPI ex-energy and ex-shelter was up by 0.45% m/m SA, or 5½% m/m SAAR. That’s explosive and maintains the multi-month pattern of generally warm trend readings (chart 3).
Core goods CPI ex-food and energy was tame again which served as a partial offset to hot core services. Core goods ex-food and energy CPI was flat after a trio of mild 0.1% m/m SA readings (chart 4 shows annualized figures). This may indicate that tariff pass through effects have waned, but a) that’s not the same as saying that broader and more complex supply chain effects are over, and b) tariff risk remains in play given the way Trump is talking. Furthermore, there could easily be future pass through effects of broadly higher commodities prices into core goods prices over coming months and quarters.
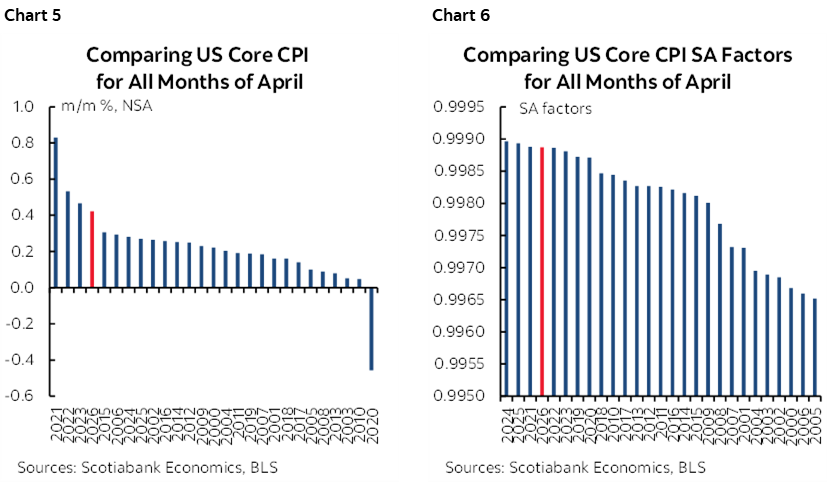
Seasonally unadjusted prices were warmer than typical for April (chart 5) and the seasonal adjustment factor was higher than normal which added to the heat (chart 6).
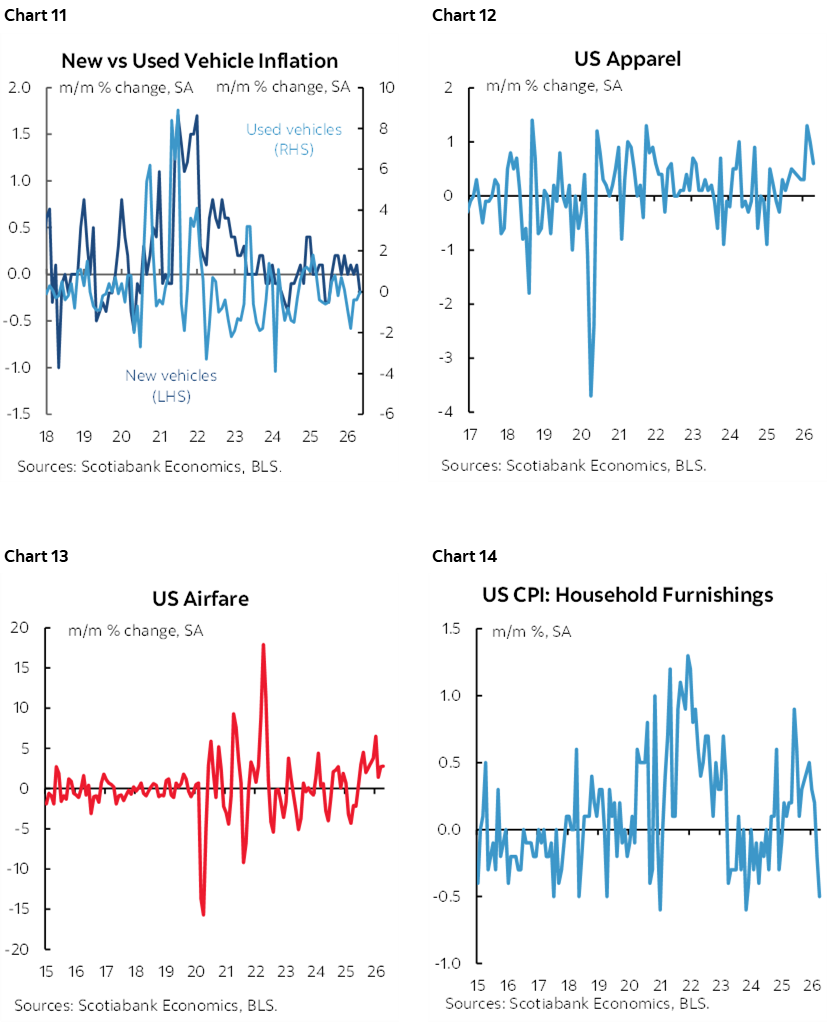
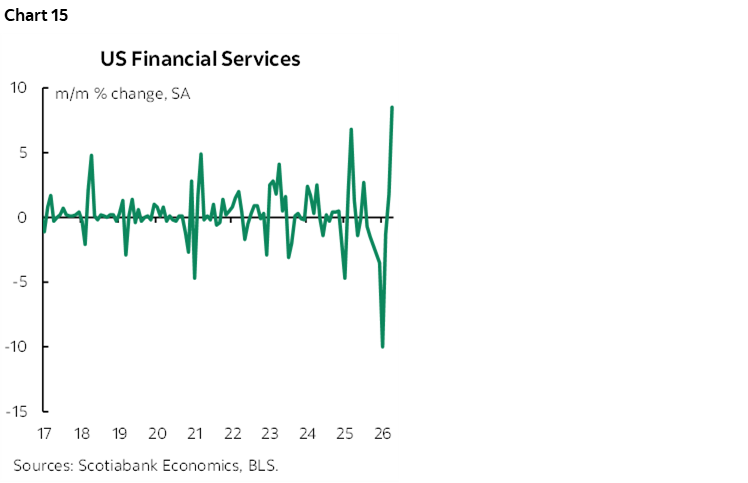
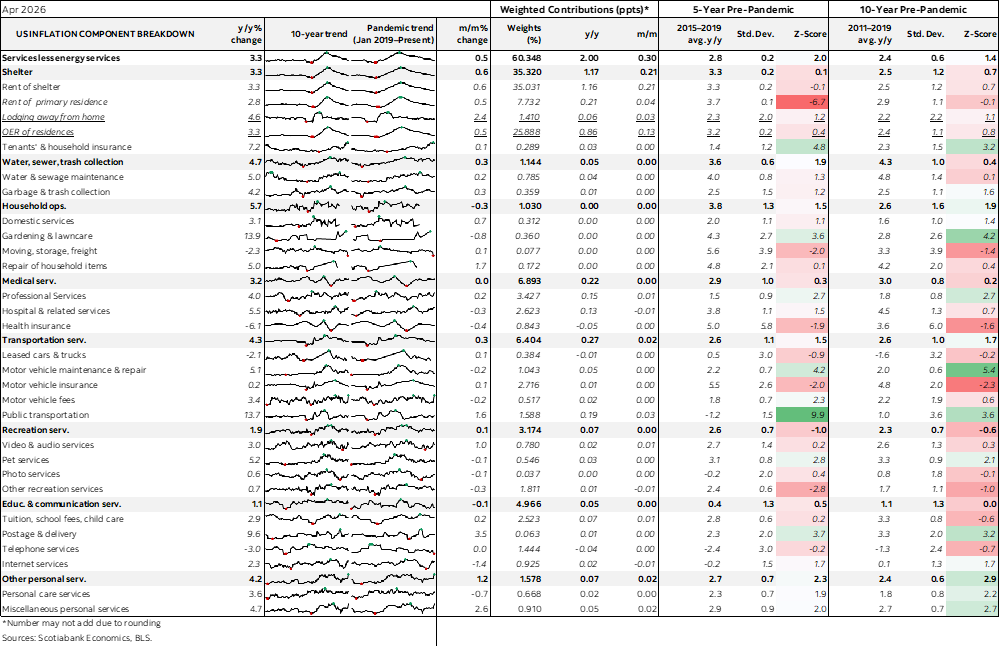
Charts 7–15 shows several components. Again, largely ignore shelter.
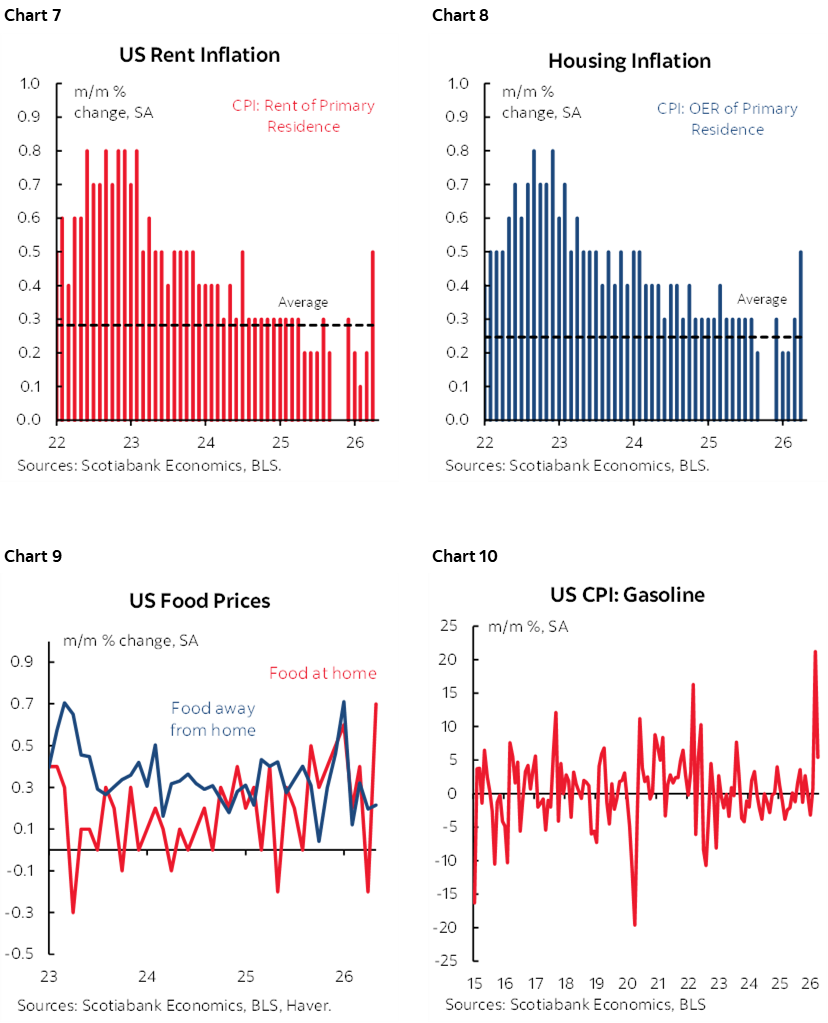
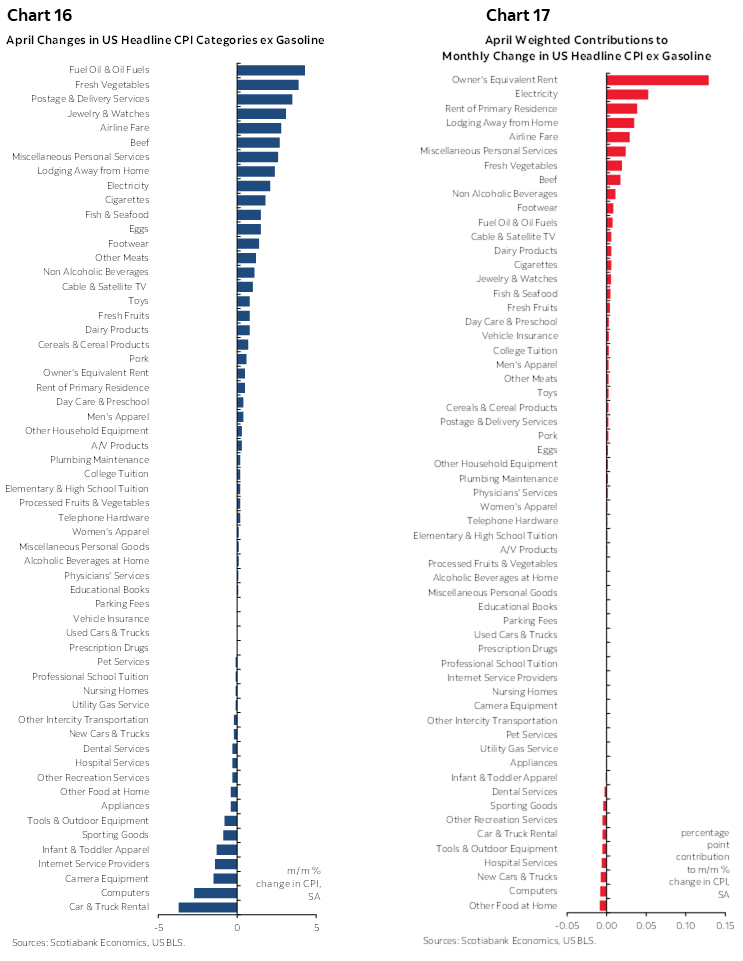
Grocery prices shot higher which didn’t take long! ‘Food at home’ (ie: groceries) was up by 0.7% m/m SA. That reflects a combination of factors but be careful about blaming it on the war. The war doesn’t directly impact meat prices, for example, and they were up by 1.8% m/m SA and 8.8% y/y with beef leading the way. Trump’s solution is to cut beef tariffs. Consumers have the option of substituting toward pork and poultry prices that are barely budging, or seafood that is up by less than beef.
Gasoline prices increased sharply again but by less than the initial shock effect in March.
Airfare and clothing were among the upsides but so was the low weight on financial services due to tax preparation services that some may have felt were more complex this time due to the Big Beautiful Bill’s effects.
Adjusting for weighting differences, today’s CPI gain of 0.6% m/m with core up 0.4% imply that PCE will be up by 0.4% with core PCE up 0.25%. We’ll update this calculation tomorrow when we get the producer price figures given that some of those prices are included in PCE.
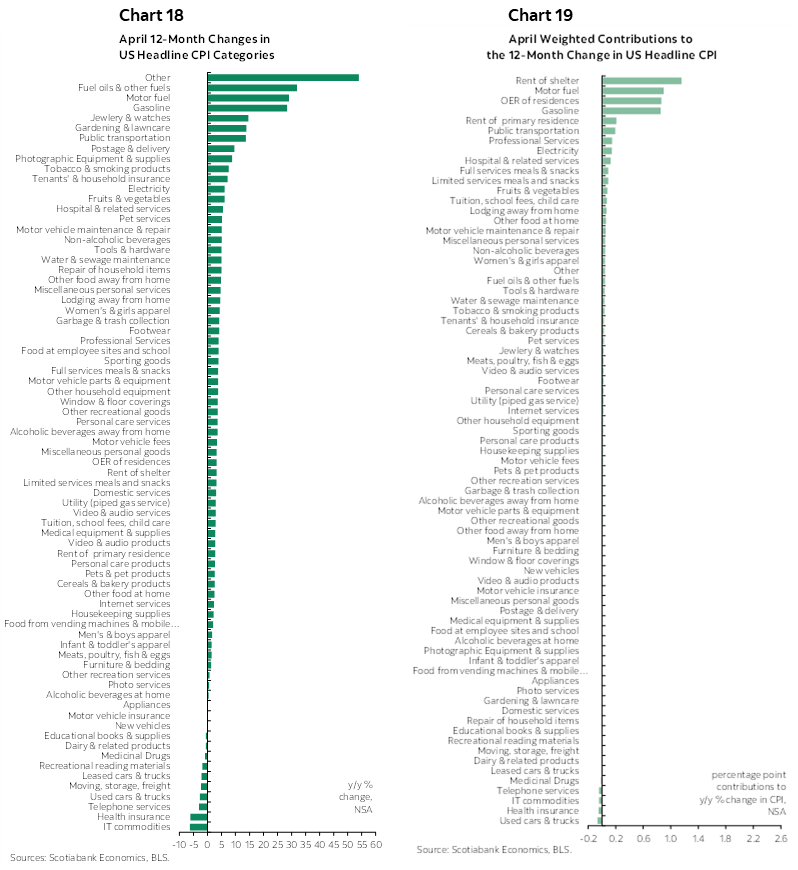
Charts 16–17 break down the basket in unweighted and weighted m/m changes. Charts 18–19 do likewise for y/y rates.
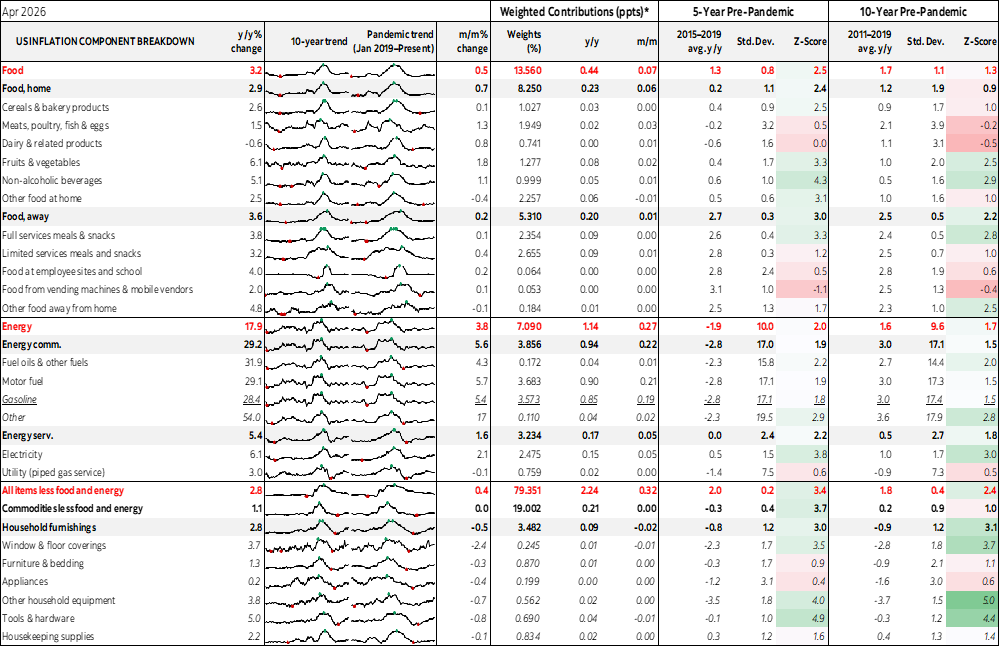
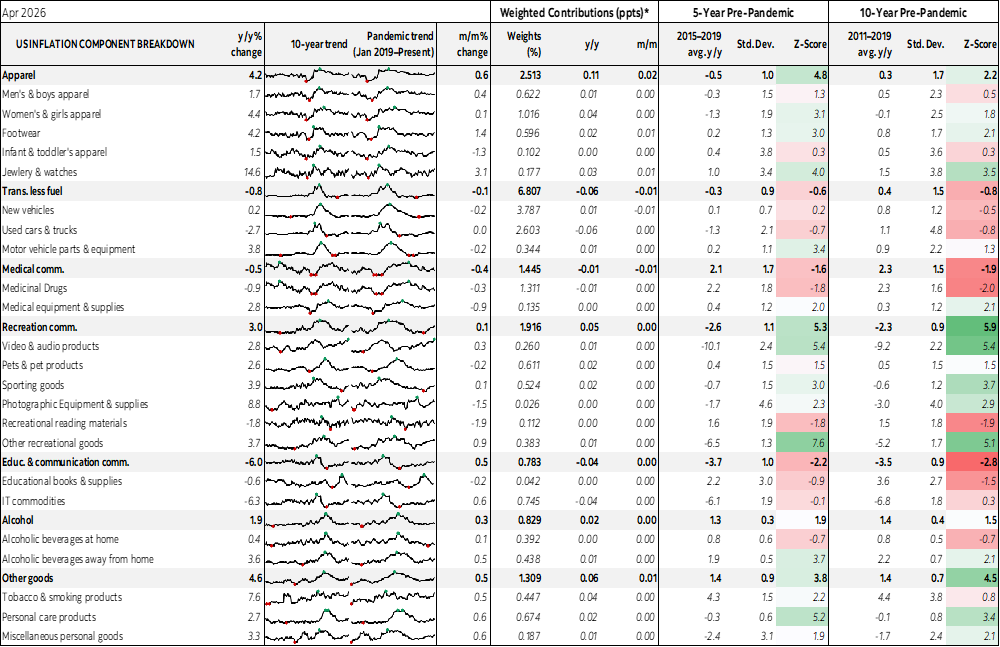
Also please see the accompanying table that provides further detail and micro charts.
Watch for the Cleveland Fed’s trimmed mean CPI measure given comments by incoming Chair Warsh about his preferences.
DISCLAIMER
This report has been prepared by Scotiabank Economics as a resource for the clients of Scotiabank. Opinions, estimates and projections contained herein are our own as of the date hereof and are subject to change without notice. The information and opinions contained herein have been compiled or arrived at from sources believed reliable but no representation or warranty, express or implied, is made as to their accuracy or completeness. Neither Scotiabank nor any of its officers, directors, partners, employees or affiliates accepts any liability whatsoever for any direct or consequential loss arising from any use of this report or its contents.
These reports are provided to you for informational purposes only. This report is not, and is not constructed as, an offer to sell or solicitation of any offer to buy any financial instrument, nor shall this report be construed as an opinion as to whether you should enter into any swap or trading strategy involving a swap or any other transaction. The information contained in this report is not intended to be, and does not constitute, a recommendation of a swap or trading strategy involving a swap within the meaning of U.S. Commodity Futures Trading Commission Regulation 23.434 and Appendix A thereto. This material is not intended to be individually tailored to your needs or characteristics and should not be viewed as a “call to action” or suggestion that you enter into a swap or trading strategy involving a swap or any other transaction. Scotiabank may engage in transactions in a manner inconsistent with the views discussed this report and may have positions, or be in the process of acquiring or disposing of positions, referred to in this report.
Scotiabank, its affiliates and any of their respective officers, directors and employees may from time to time take positions in currencies, act as managers, co-managers or underwriters of a public offering or act as principals or agents, deal in, own or act as market makers or advisors, brokers or commercial and/or investment bankers in relation to securities or related derivatives. As a result of these actions, Scotiabank may receive remuneration. All Scotiabank products and services are subject to the terms of applicable agreements and local regulations. Officers, directors and employees of Scotiabank and its affiliates may serve as directors of corporations.
Any securities discussed in this report may not be suitable for all investors. Scotiabank recommends that investors independently evaluate any issuer and security discussed in this report, and consult with any advisors they deem necessary prior to making any investment.
This report and all information, opinions and conclusions contained in it are protected by copyright. This information may not be reproduced without the prior express written consent of Scotiabank.
™ Trademark of The Bank of Nova Scotia. Used under license, where applicable.
Scotiabank, together with “Global Banking and Markets”, is a marketing name for the global corporate and investment banking and capital markets businesses of The Bank of Nova Scotia and certain of its affiliates in the countries where they operate, including; Scotiabank Europe plc; Scotiabank (Ireland) Designated Activity Company; Scotiabank Inverlat S.A., Institución de Banca Múltiple, Grupo Financiero Scotiabank Inverlat, Scotia Inverlat Casa de Bolsa, S.A. de C.V., Grupo Financiero Scotiabank Inverlat, Scotia Inverlat Derivados S.A. de C.V. – all members of the Scotiabank group and authorized users of the Scotiabank mark. The Bank of Nova Scotia is incorporated in Canada with limited liability and is authorised and regulated by the Office of the Superintendent of Financial Institutions Canada. The Bank of Nova Scotia is authorized by the UK Prudential Regulation Authority and is subject to regulation by the UK Financial Conduct Authority and limited regulation by the UK Prudential Regulation Authority. Details about the extent of The Bank of Nova Scotia's regulation by the UK Prudential Regulation Authority are available from us on request. Scotiabank Europe plc is authorized by the UK Prudential Regulation Authority and regulated by the UK Financial Conduct Authority and the UK Prudential Regulation Authority.
Scotiabank Inverlat, S.A., Scotia Inverlat Casa de Bolsa, S.A. de C.V, Grupo Financiero Scotiabank Inverlat, and Scotia Inverlat Derivados, S.A. de C.V., are each authorized and regulated by the Mexican financial authorities.
Not all products and services are offered in all jurisdictions. Services described are available in jurisdictions where permitted by law.