- Canada’s economy rebounded in Q1
- Ignore Canadian SEPH payrolls, pay more attention to wages
- US GDP growth disappointed…
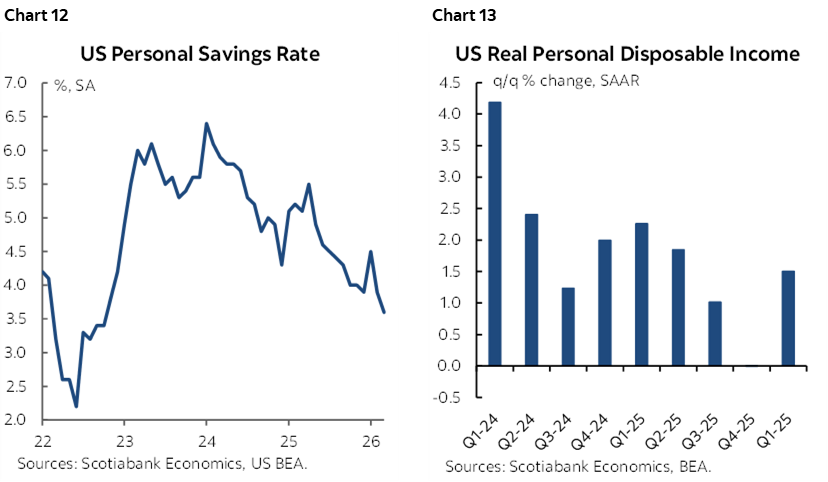
- ...as consumers save less to maintain a slowing consumption profile
- Core PCE inflation remains too hot…
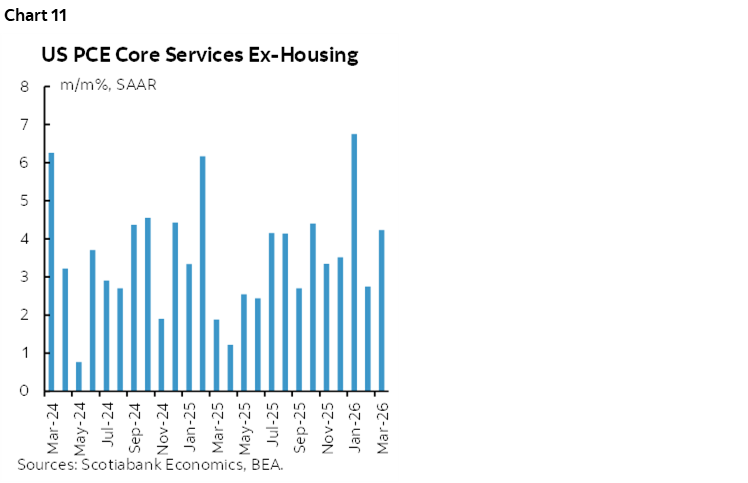
- ...especially including core services inflation that Powell neglected to mention
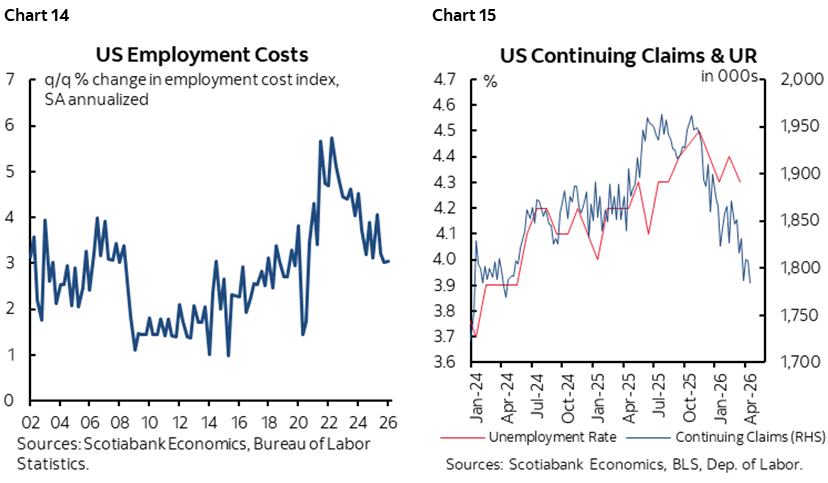
- US ECI, claims and the unemployment rate
Canada’s economy rebounded in Q1 and might be performing a smidge better than the Bank of Canada’s published forecast yesterday. Still, it’s backward data that settles nothing much other than to reject gloomier consensus views on the underlying performance of the economy coming into the start of the year.
The economy grew by 0.17% m/m SA rounded up to 0.2% on screens. Statcan’s preliminary guidance for March was that GDP was unchanged, absent any details.
What this translates into is Q1 GDP tracking growth of 1.7% q/q SAAR (chart 1). This is a rebound from the 0.3% q/q SAAR contraction in Q4 with an asterisk beside both readings.
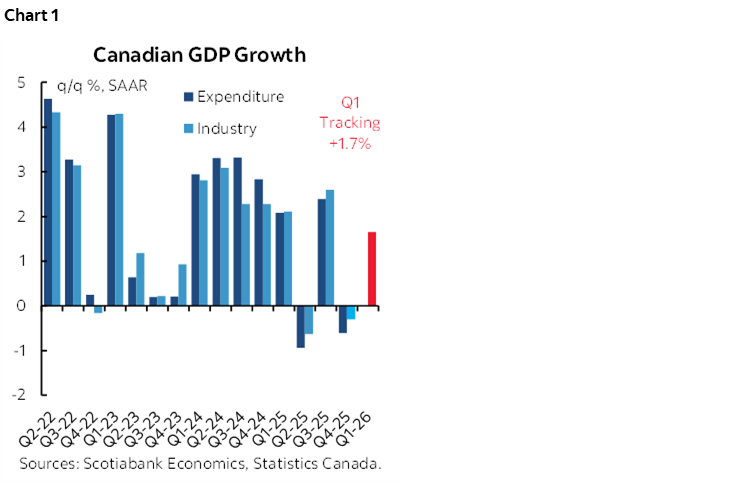
That asterisk speaks to the fact that we’re using monthly, production-side GDP accounts. The BoC and the street focuses upon more complete quarterly GDP accounts that also consider how activity was generated, such as by considering swings in inventory investment.
The difference may be material. Q4 GDP in expenditure-based terms shrank by –0.6% q/q SAAR because inventory depletion drove a 4.2 percentage point weighted drag against GDP economy (chart 1 again). Final domestic demand excludes inventory effects and it grew by 2.3% q/q SAAR in Q4. We don’t have the complete inventory and trade picture for Q1 yet and so there continues to be some tracking risk.
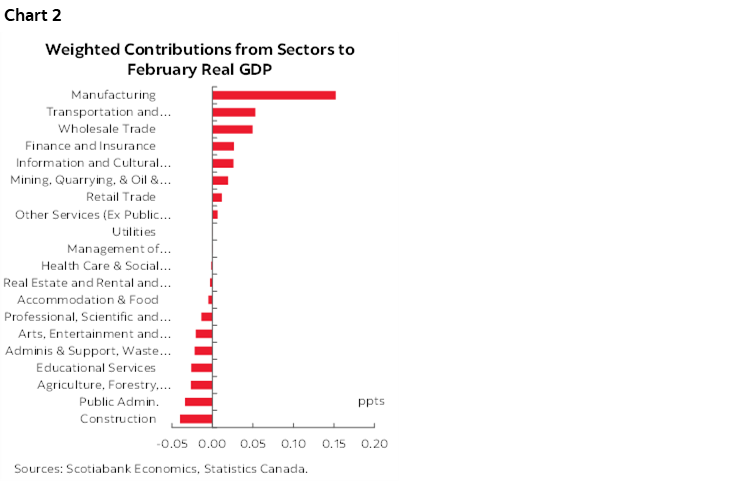
Chart 2 shows what drove February GDP. Manufacturing punched above its weight class while the rest was an evenly distributed mixture of small growth additions and drags. Some of the drags were weather oriented in my view, like construction, and maybe some of the leisure categories.
So, while GDP rebounded, it likely outpaced the supply side of the economy which will probably translate into a narrower output gap when we get the full set of Q1 GDP accounts.
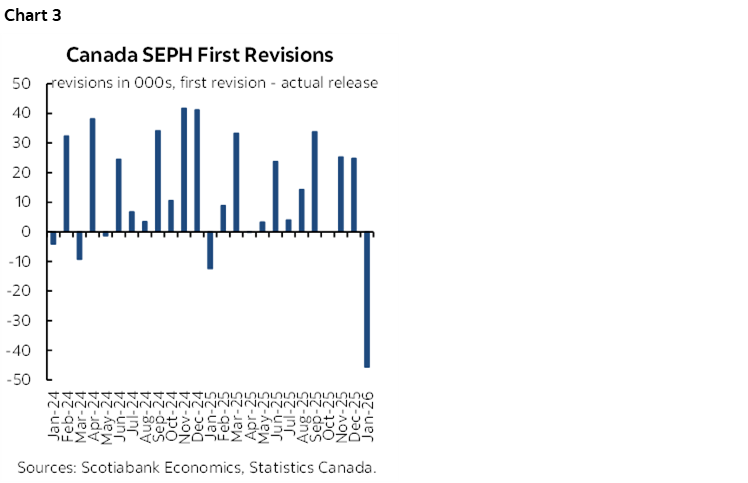
And ignore Canada’s SEPH payrolls report and its reported decline of 60k m/m in February. First, it’s lagging, when we’ll get the April Labour Force Survey next Friday. Second, it excludes off-payroll employers by definition, like many small businesses that are important in Canada. Third, it gets revised by tens of thousands of jobs each and every month (chart 3).
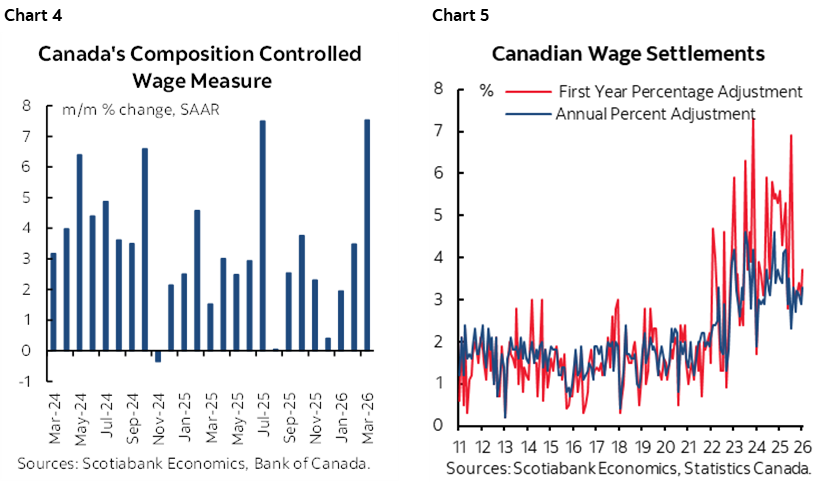
What’s more interesting in Canada is that the Bank of Canada’s figures for wage growth that control for compositional shifts surged last month according to their fresh estimates (chart 4). Canada is still very much in an upward wage spiral including the effects of expiring collective bargaining agreements struck 3–4 years ago that are cementing years of wage gains above the BoC’s 2% inflation target going forward (chart 5). Canada is not the US in so many ways, one of which being the extended wage resets with triple the 10% unionization rate that exists stateside.
US
US releases were a little more interesting than Canada’s. And my, what a list it is.
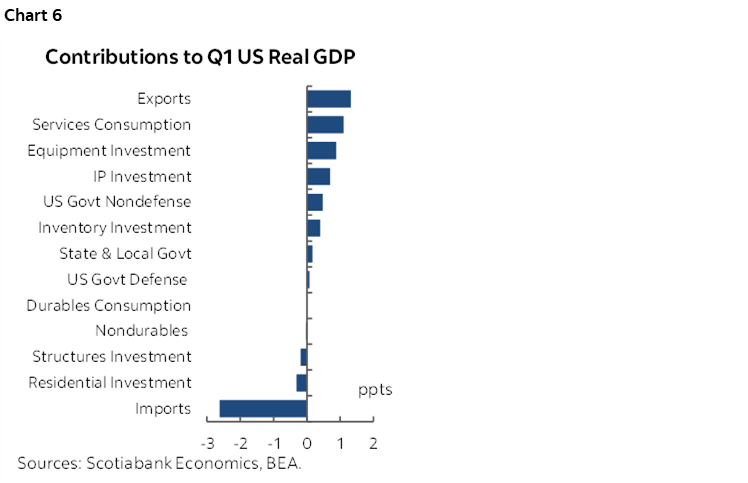
GDP growth disappointed. Q1 GDP was up by just 2.0% q/q SAAR (2.3% consensus, 3% Scotia). An import surge based on yesterday’s advance merchandise import figures knocked over 2½ percentage points off of Q1 GDP growth as a higher leakage effect in the GDP accounting (chart 6). Housing and business investment in structures were roughly flat contributors. The government rebound was smaller than we were tracking using third party sources.
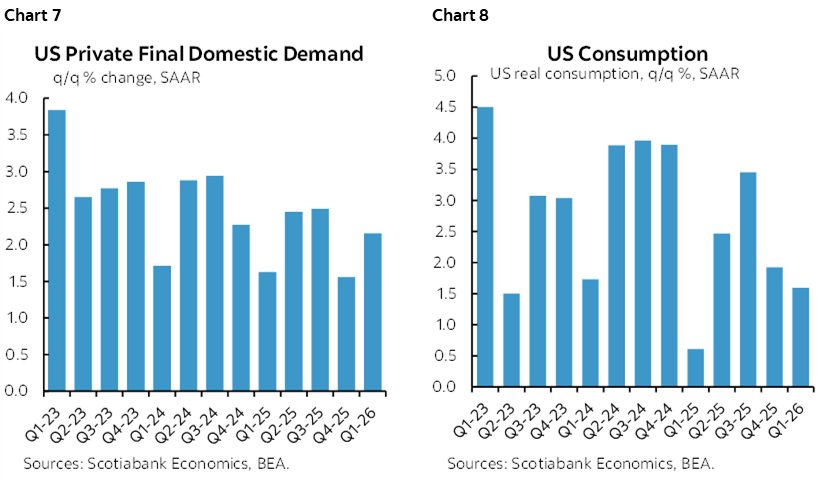
Still, final private domestic demand is key and it was solid (chart 7). Consumption didn’t help much as the slowest pace of growth in a year was underwhelming and continued the slowing pattern (chart 8).
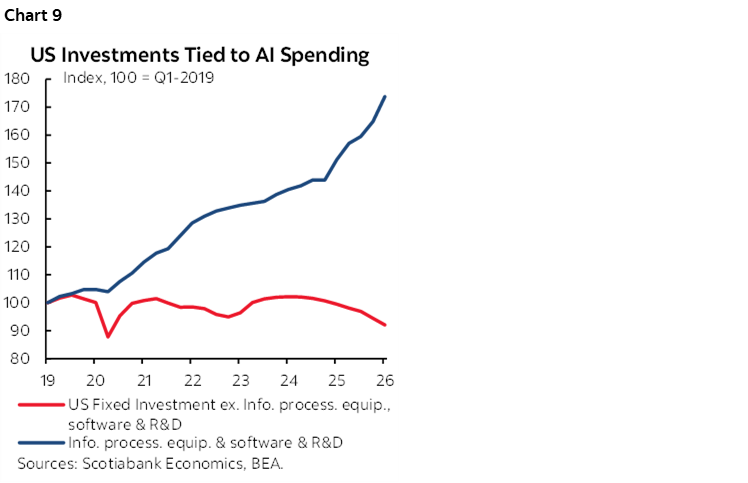
Investment ex-AI continues to decline in the US economy (chart 9). That could be because AI is soaking up cap-ex budgets with little else left, but the relatively narrow breadth of that spending might suggest otherwise. I still lean toward weak ex-AI investment as being driven by high uncertainty hanging over cap-ex budgets.
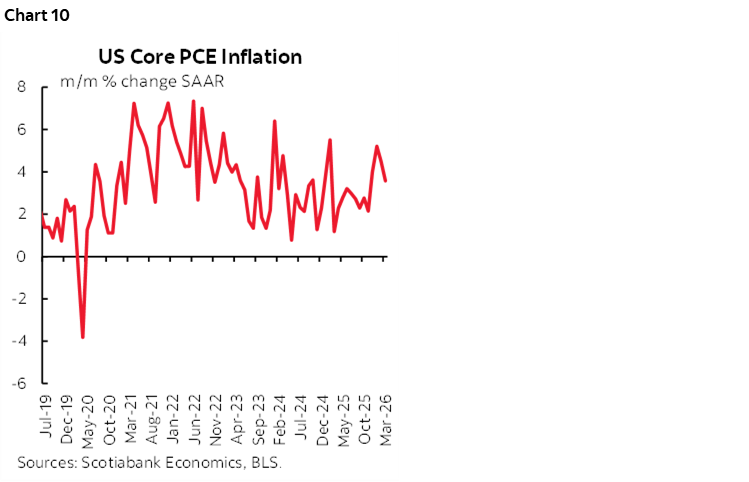
Alongside growth we have fresh figures on underlying inflation. Take a look at chart 10 and tell me Kevin Warsh won’t get attacked on day one for not easing in June. He can’t cut. He’s faced with a rebellious Committee before he’s even entered the room.
What Chair Powell neglected to mention yesterday was how hot the one-fifth of the inflation basket remains (chart 11). Core services price inflation remains far too warm to contemplate easing. Powell only referenced views on how tariffs and energy pass through risk would be temporary with some hopeful bias alongside this view. In the past he has also referenced core services inflation and this time did not.
So how are American consumers responding to higher inflation? By saving less. And less and less (chart 12). Disposable income growth in inflation-adjusted terms ha weakened sharply over recent quarters (chart 13) and so to prop up cooling consumption growth they are saving less and with a negative wealth effect concentrated on falling real house prices added to the mixture.
Quick additional points include referencing the Q1 Employment Cost Index that grew faster than expected (0.9% q/q SA nonannualized, 0.8% consensus)—see chart 14)—and a dip in initial jobless claims to 189k in the latest week while the drop in continuing claims into the nonfarm reference period suggests that the unemployment rate may fall again next Friday (chart 15).
DISCLAIMER
This report has been prepared by Scotiabank Economics as a resource for the clients of Scotiabank. Opinions, estimates and projections contained herein are our own as of the date hereof and are subject to change without notice. The information and opinions contained herein have been compiled or arrived at from sources believed reliable but no representation or warranty, express or implied, is made as to their accuracy or completeness. Neither Scotiabank nor any of its officers, directors, partners, employees or affiliates accepts any liability whatsoever for any direct or consequential loss arising from any use of this report or its contents.
These reports are provided to you for informational purposes only. This report is not, and is not constructed as, an offer to sell or solicitation of any offer to buy any financial instrument, nor shall this report be construed as an opinion as to whether you should enter into any swap or trading strategy involving a swap or any other transaction. The information contained in this report is not intended to be, and does not constitute, a recommendation of a swap or trading strategy involving a swap within the meaning of U.S. Commodity Futures Trading Commission Regulation 23.434 and Appendix A thereto. This material is not intended to be individually tailored to your needs or characteristics and should not be viewed as a “call to action” or suggestion that you enter into a swap or trading strategy involving a swap or any other transaction. Scotiabank may engage in transactions in a manner inconsistent with the views discussed this report and may have positions, or be in the process of acquiring or disposing of positions, referred to in this report.
Scotiabank, its affiliates and any of their respective officers, directors and employees may from time to time take positions in currencies, act as managers, co-managers or underwriters of a public offering or act as principals or agents, deal in, own or act as market makers or advisors, brokers or commercial and/or investment bankers in relation to securities or related derivatives. As a result of these actions, Scotiabank may receive remuneration. All Scotiabank products and services are subject to the terms of applicable agreements and local regulations. Officers, directors and employees of Scotiabank and its affiliates may serve as directors of corporations.
Any securities discussed in this report may not be suitable for all investors. Scotiabank recommends that investors independently evaluate any issuer and security discussed in this report, and consult with any advisors they deem necessary prior to making any investment.
This report and all information, opinions and conclusions contained in it are protected by copyright. This information may not be reproduced without the prior express written consent of Scotiabank.
™ Trademark of The Bank of Nova Scotia. Used under license, where applicable.
Scotiabank, together with “Global Banking and Markets”, is a marketing name for the global corporate and investment banking and capital markets businesses of The Bank of Nova Scotia and certain of its affiliates in the countries where they operate, including; Scotiabank Europe plc; Scotiabank (Ireland) Designated Activity Company; Scotiabank Inverlat S.A., Institución de Banca Múltiple, Grupo Financiero Scotiabank Inverlat, Scotia Inverlat Casa de Bolsa, S.A. de C.V., Grupo Financiero Scotiabank Inverlat, Scotia Inverlat Derivados S.A. de C.V. – all members of the Scotiabank group and authorized users of the Scotiabank mark. The Bank of Nova Scotia is incorporated in Canada with limited liability and is authorised and regulated by the Office of the Superintendent of Financial Institutions Canada. The Bank of Nova Scotia is authorized by the UK Prudential Regulation Authority and is subject to regulation by the UK Financial Conduct Authority and limited regulation by the UK Prudential Regulation Authority. Details about the extent of The Bank of Nova Scotia's regulation by the UK Prudential Regulation Authority are available from us on request. Scotiabank Europe plc is authorized by the UK Prudential Regulation Authority and regulated by the UK Financial Conduct Authority and the UK Prudential Regulation Authority.
Scotiabank Inverlat, S.A., Scotia Inverlat Casa de Bolsa, S.A. de C.V, Grupo Financiero Scotiabank Inverlat, and Scotia Inverlat Derivados, S.A. de C.V., are each authorized and regulated by the Mexican financial authorities.
Not all products and services are offered in all jurisdictions. Services described are available in jurisdictions where permitted by law.