- Total CPI jumped less than consensus, matching Scotia’s estimate
- That was good enough for markets…
- ...but they failed to look beneath the headline
- The BoC’s traditional core measures accelerated in higher frequency terms...
- ...but traditional core CPI did not and solely because of one single category
- Breadth of price pressures remains high
- Shelter, vehicles and several other categories accelerated
- The BoC won’t flinch as the focus is on the broader path forward…
- ...but it’s a warning that Canada may be emerging from a temporary soft patch…
- ...even before pass through from commodities into core may begin to emerge
- Canadian CPI m/m % / y/y %, NSA, March:
- Actual: 0.9 / 2.4
- Scotia: 0.9 / 2.4
- Consensus: 1.1 / 2.6
- Prior: Unrevised 0.5 / 1.8
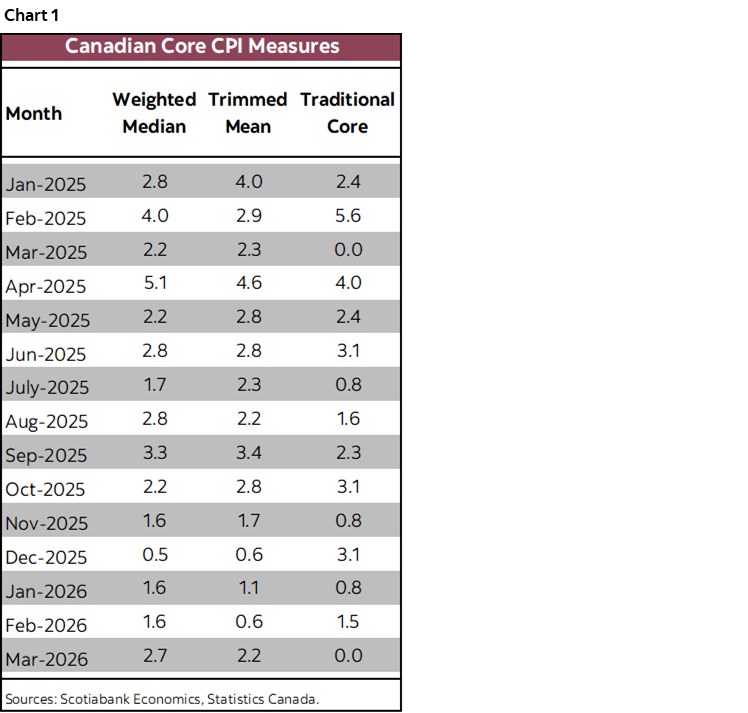
- Trimmed mean CPI m/m % SAAR: 2.2 (prior unrevised from 0.6%)
- Weighted median CPI m/m % SAAR: 2.7 (prior unrevised from 1.6%)
- Traditional core ex-food & energy % SAAR: 0.0 (prior 1.5 revised from 2.3%)
I think markets misread this one by only trading the headline while ignoring evidence on core inflation, a key distortion, and breadth. There is tentative evidence in favour of the view that Canada is emerging from a temporary soft patch on underlying core inflation. Still, nothing hangs in the balance on this one report which is a placeholder to be informed by the path forward.
Markets reacted by initially pushing the 2-year yield 1–2bps lower post-release after rallying into the report but are now flat on Iran headlines. Canadian 2s are very slightly outperforming US 2s on the day. CAD largely shook it off. BoC OIS meeting pricing was not materially affected.
BoC’s Preferred Gauges Accelerated
Total CPI matched my below-consensus expectations at 0.9% m/m NSA, 0.5% m/m SA and 2.4% y/y.
But the BoC’s higher frequency core measures of inflation accelerated in March. Key is that Trimmed Mean CPI accelerated to 2.2% m/m SAAR for the warmest reading since October while weighted median CPI accelerated to 2.7% m/m SAAR for the warmest reading since September. Charts 1 and 2 show the outcomes.
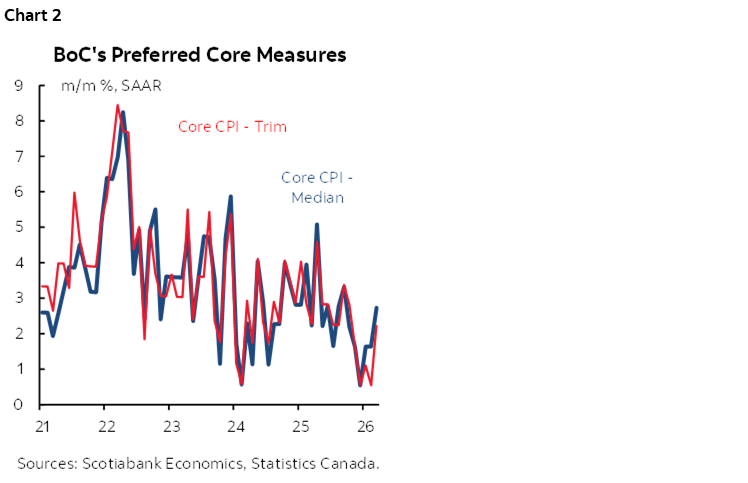
It’s worth a reminder to ignore the y/y trimmed mean and weighted median measures. They are not spot y/y calculations but rather slow-moving 12-month weighted compounded and summed up m/m measures that drop out the first month and add the latest batch of readings each month. Glaciers move faster than the y/y readings, which is why you need to look at these measures in m/m seasonally adjusted and annualized terms for evidence of price pressures at the margin.
Traditional Core CPI Decelerated Because of this One Thing
Traditional core CPI ex-food and energy decelerated to 0% m/m SAAR and its reading for the prior month was the only thing that was revised, down to 1.5% m/m SAAR from 2.3% (chart 3). The y/y calculation for this one is a spot calculation and it sits at 1.9%.
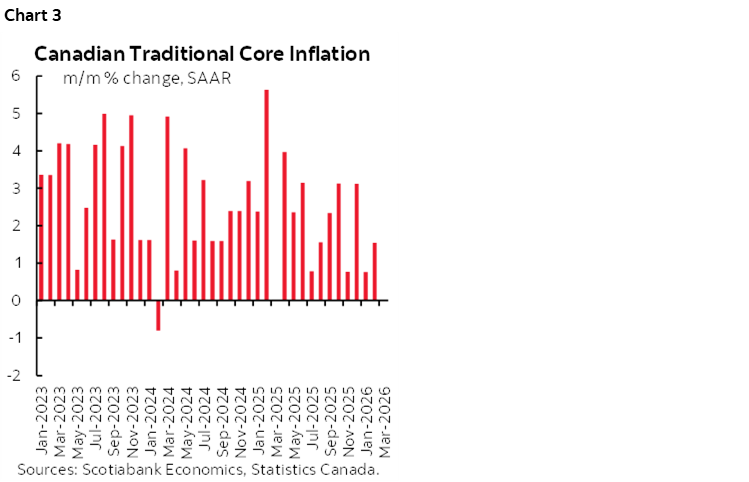
But be careful with traditional core ex-f&e. It was heavily distorted to the downside by one single category: clothing and footwear. Clothing and footwear fell –8.6% m/m SAAR in March which at a 4.4% weight in the total basket knocked 0.4 percentage points m/m SAAR off of total CPI and –0.5% m/m SAAR in weighted terms from traditional core CPI.
Monetary policy cannot target relative prices and so there is a strong case for removing clothing and footwear.
The trimmed mean and weighted median CPI measures weed out outliers which in this case included weeding out the big and distorting drop in clothing and footwear. The traditional core CPI measure does not, by definition, weed out distorting outliers and so it offered a misleading impression of broader price pressures.
Other Details
The BoC will continue to be concerned about the breadth of price increases (chart 4).
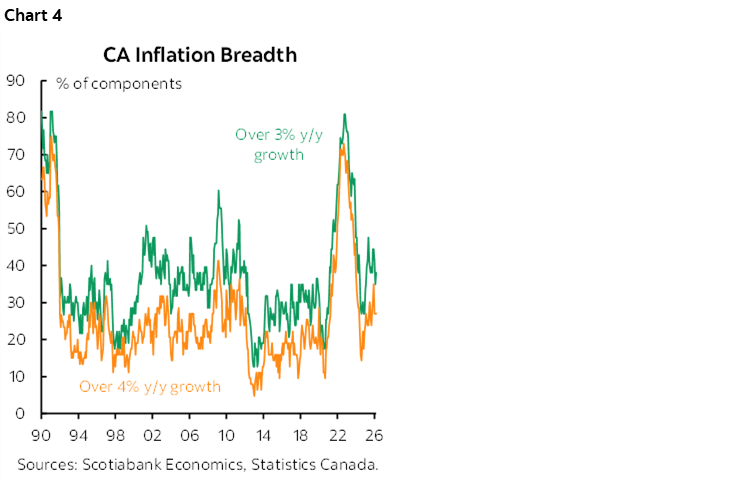
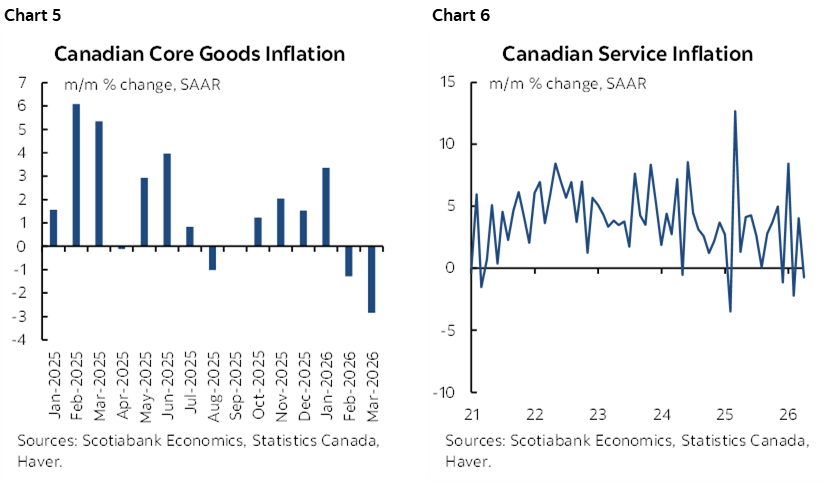
Chart 5 shows muted core goods inflation in m/m SAAR terms with chart 6 showing muted m/m services inflation. This is why traditional core CPI was soft. The BoC’s preferred measures weed out the most volatile items in the tails that were responsible for keeping core goods and core services CPI down. Core goods CPI was weighed down by clothing and footwear; remove that, and core goods would have been 1% higher. Core services CPI was weighed down by auto insurance and tenant insurance (for a change…), communications, public transit and travel services.
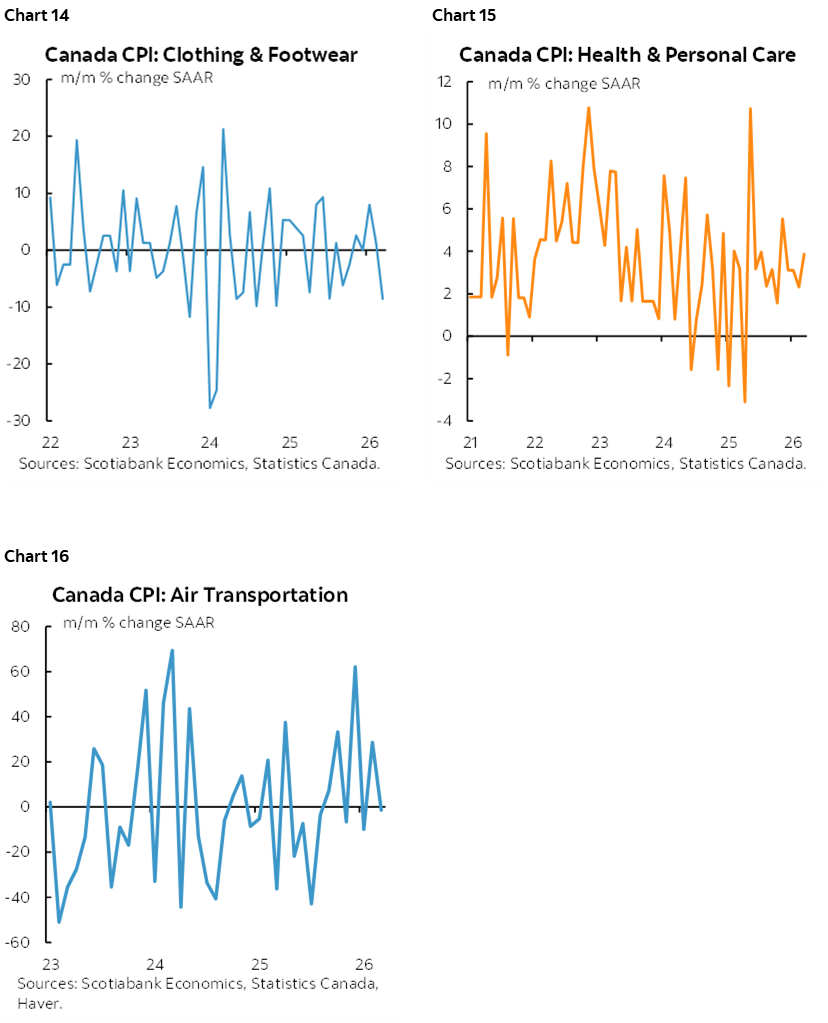
Charts 7–16 break down components of the basket. Recreation/reading/education carries a 10.1% basket weight and its 0.2% m/m SA nonannualized rise was driven by a handful of categories and held back by two: travel tours and books; fewer travel outside of Canada and fewer folks read anything longer than a cheesy social media post these days.
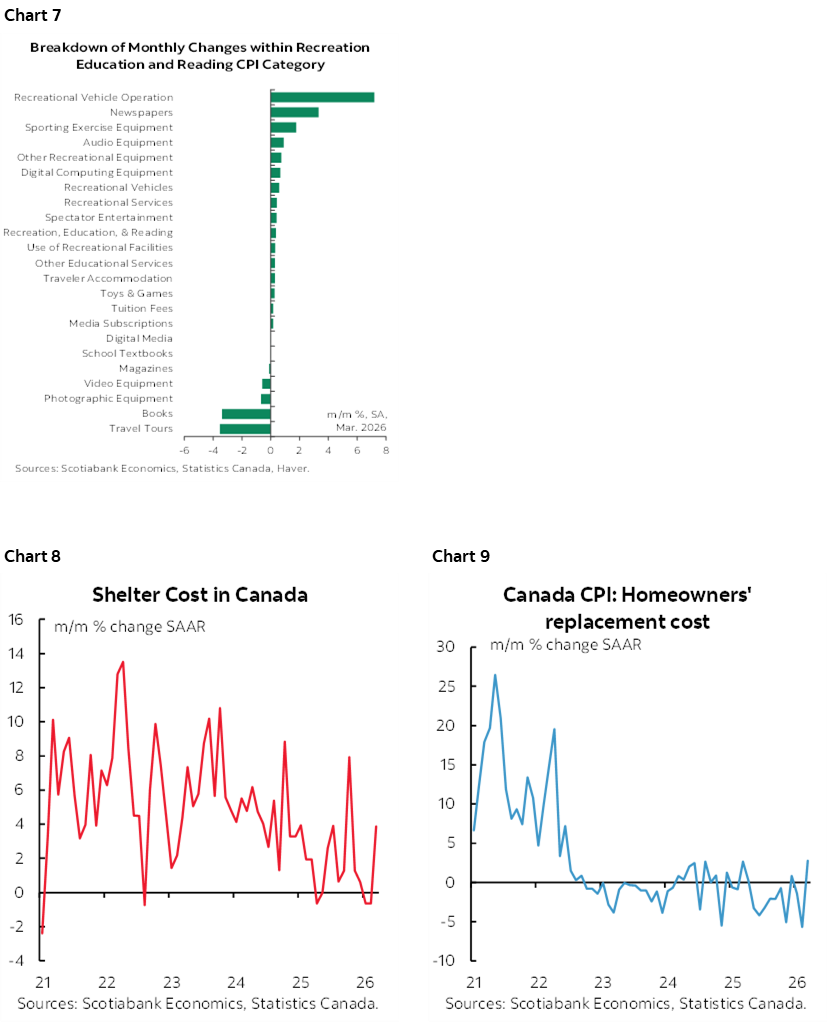
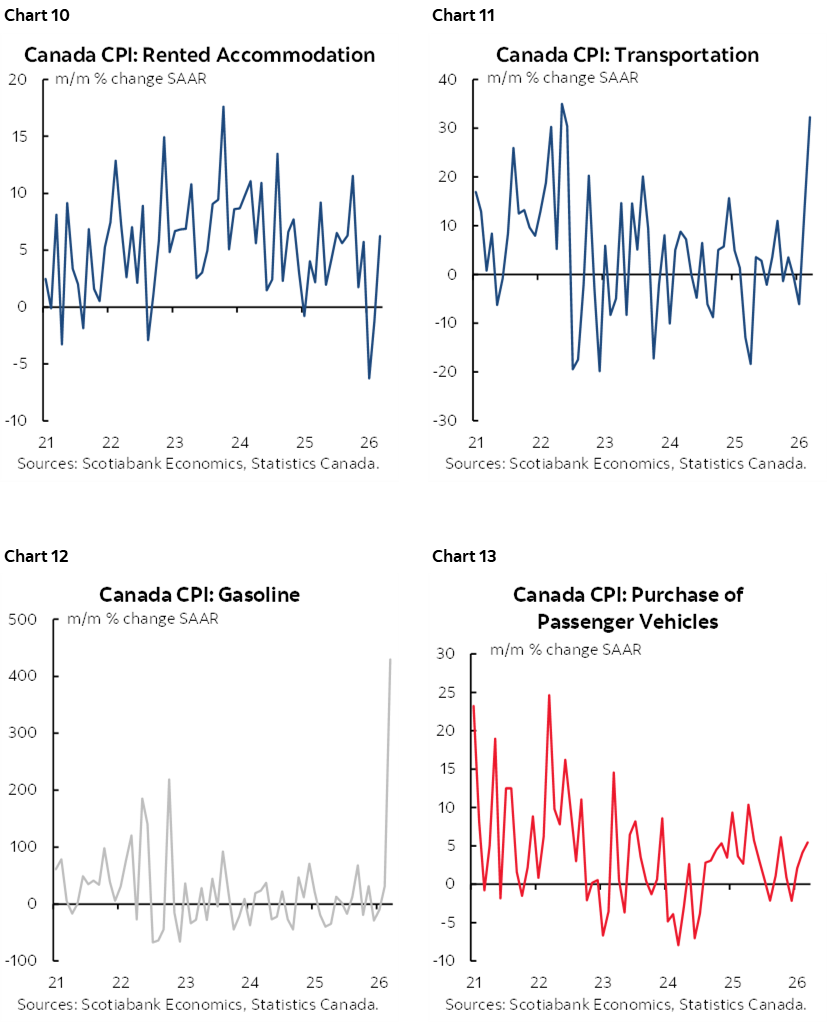
Shelter accelerated on builder prices and rent. Vehicle price inflation accelerated.
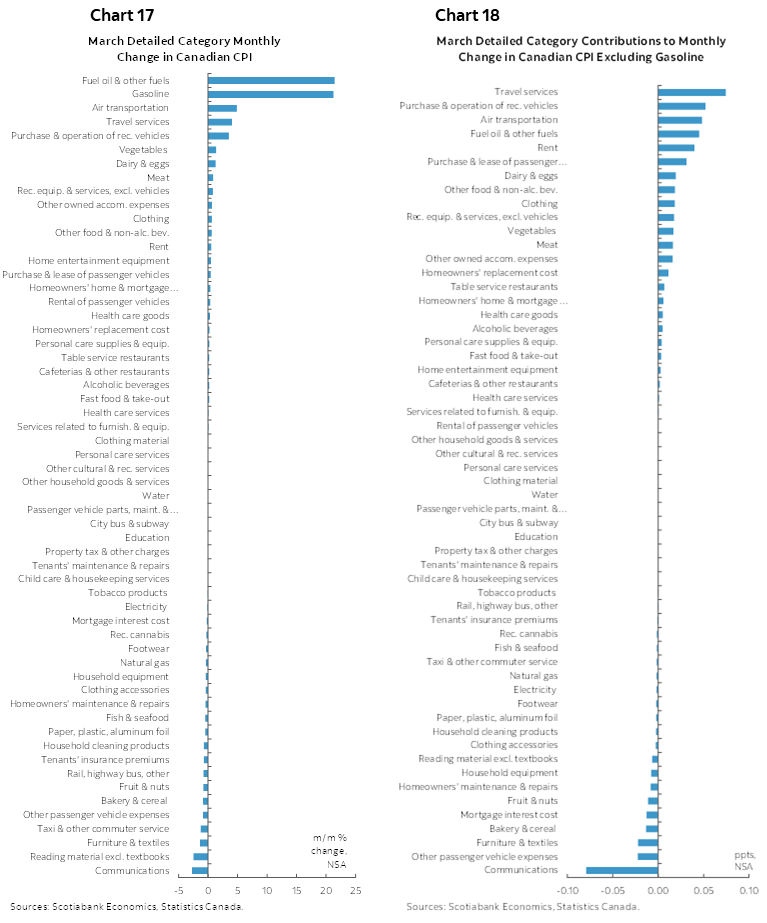
Charts 17–18 break down the basket in terms of m/m terms and weighted m/m contributions.
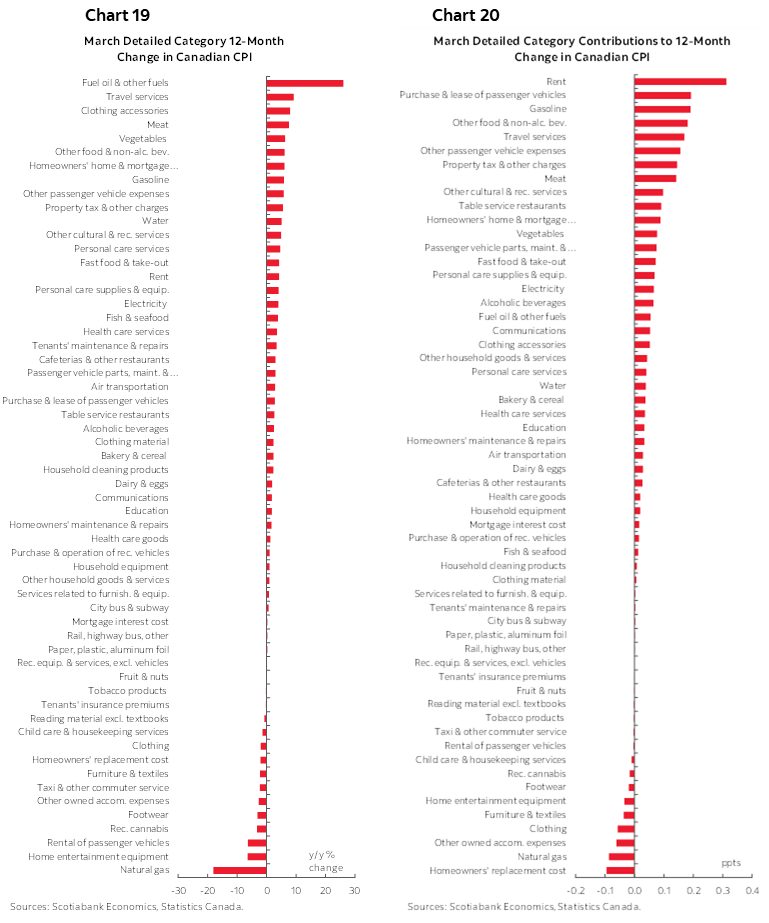
Charts 19–20 do likewise in y/y terms.
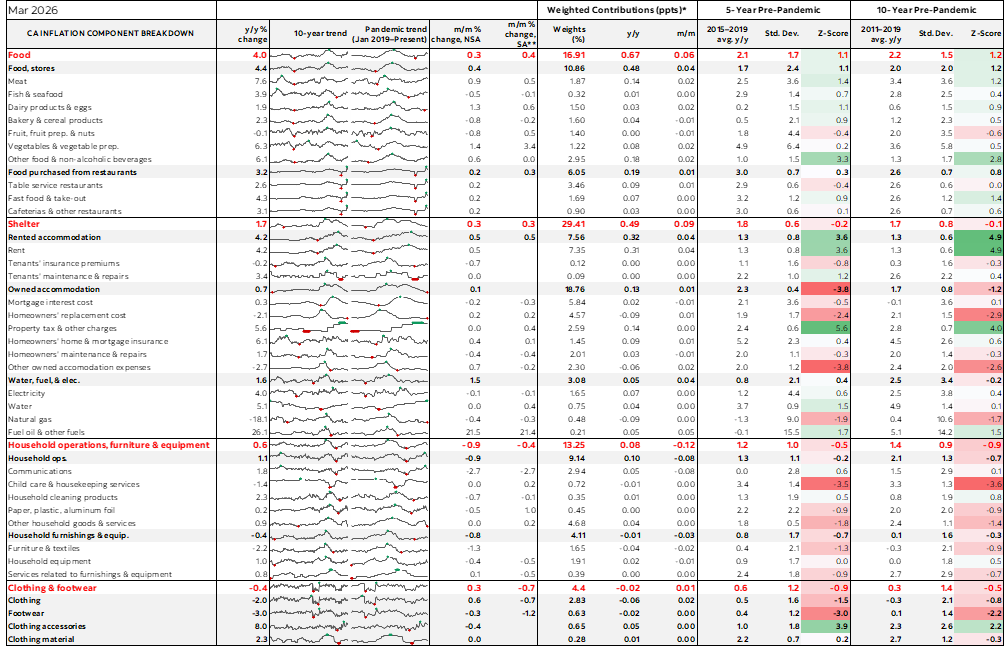
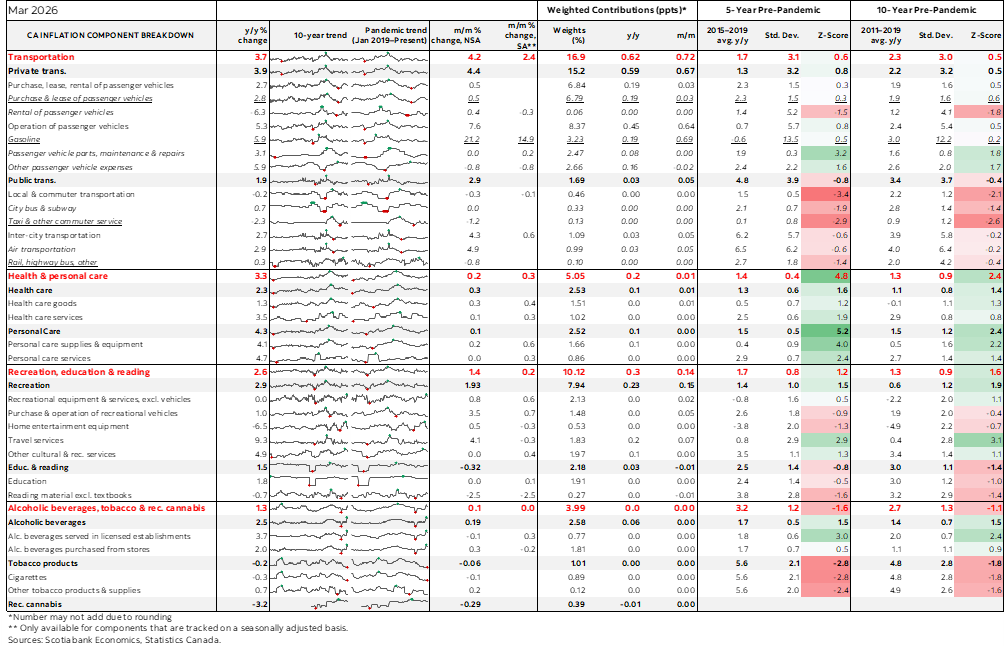
Also see the accompanying table that provides greater detail and micro charts.
DISCLAIMER
This report has been prepared by Scotiabank Economics as a resource for the clients of Scotiabank. Opinions, estimates and projections contained herein are our own as of the date hereof and are subject to change without notice. The information and opinions contained herein have been compiled or arrived at from sources believed reliable but no representation or warranty, express or implied, is made as to their accuracy or completeness. Neither Scotiabank nor any of its officers, directors, partners, employees or affiliates accepts any liability whatsoever for any direct or consequential loss arising from any use of this report or its contents.
These reports are provided to you for informational purposes only. This report is not, and is not constructed as, an offer to sell or solicitation of any offer to buy any financial instrument, nor shall this report be construed as an opinion as to whether you should enter into any swap or trading strategy involving a swap or any other transaction. The information contained in this report is not intended to be, and does not constitute, a recommendation of a swap or trading strategy involving a swap within the meaning of U.S. Commodity Futures Trading Commission Regulation 23.434 and Appendix A thereto. This material is not intended to be individually tailored to your needs or characteristics and should not be viewed as a “call to action” or suggestion that you enter into a swap or trading strategy involving a swap or any other transaction. Scotiabank may engage in transactions in a manner inconsistent with the views discussed this report and may have positions, or be in the process of acquiring or disposing of positions, referred to in this report.
Scotiabank, its affiliates and any of their respective officers, directors and employees may from time to time take positions in currencies, act as managers, co-managers or underwriters of a public offering or act as principals or agents, deal in, own or act as market makers or advisors, brokers or commercial and/or investment bankers in relation to securities or related derivatives. As a result of these actions, Scotiabank may receive remuneration. All Scotiabank products and services are subject to the terms of applicable agreements and local regulations. Officers, directors and employees of Scotiabank and its affiliates may serve as directors of corporations.
Any securities discussed in this report may not be suitable for all investors. Scotiabank recommends that investors independently evaluate any issuer and security discussed in this report, and consult with any advisors they deem necessary prior to making any investment.
This report and all information, opinions and conclusions contained in it are protected by copyright. This information may not be reproduced without the prior express written consent of Scotiabank.
™ Trademark of The Bank of Nova Scotia. Used under license, where applicable.
Scotiabank, together with “Global Banking and Markets”, is a marketing name for the global corporate and investment banking and capital markets businesses of The Bank of Nova Scotia and certain of its affiliates in the countries where they operate, including; Scotiabank Europe plc; Scotiabank (Ireland) Designated Activity Company; Scotiabank Inverlat S.A., Institución de Banca Múltiple, Grupo Financiero Scotiabank Inverlat, Scotia Inverlat Casa de Bolsa, S.A. de C.V., Grupo Financiero Scotiabank Inverlat, Scotia Inverlat Derivados S.A. de C.V. – all members of the Scotiabank group and authorized users of the Scotiabank mark. The Bank of Nova Scotia is incorporated in Canada with limited liability and is authorised and regulated by the Office of the Superintendent of Financial Institutions Canada. The Bank of Nova Scotia is authorized by the UK Prudential Regulation Authority and is subject to regulation by the UK Financial Conduct Authority and limited regulation by the UK Prudential Regulation Authority. Details about the extent of The Bank of Nova Scotia's regulation by the UK Prudential Regulation Authority are available from us on request. Scotiabank Europe plc is authorized by the UK Prudential Regulation Authority and regulated by the UK Financial Conduct Authority and the UK Prudential Regulation Authority.
Scotiabank Inverlat, S.A., Scotia Inverlat Casa de Bolsa, S.A. de C.V, Grupo Financiero Scotiabank Inverlat, and Scotia Inverlat Derivados, S.A. de C.V., are each authorized and regulated by the Mexican financial authorities.
Not all products and services are offered in all jurisdictions. Services described are available in jurisdictions where permitted by law.