- Core CPI landed at 0.2 again with mixed details
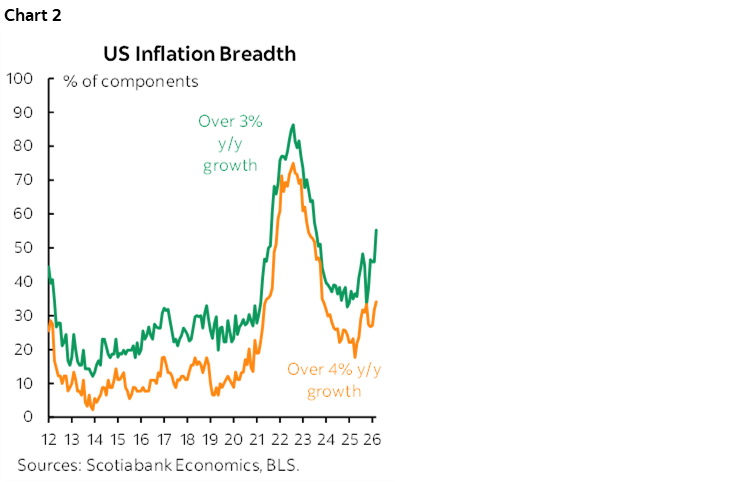
- Breadth of price pressures is nevertheless still rising
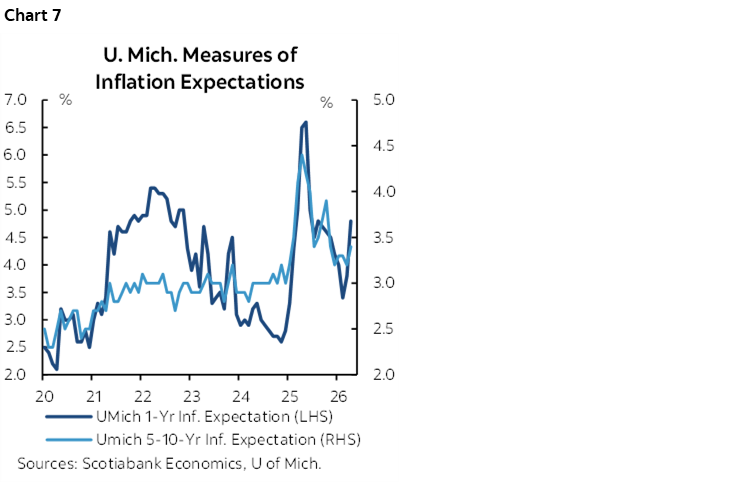
- UofM sentiment plunged, inflation expectations moved up…
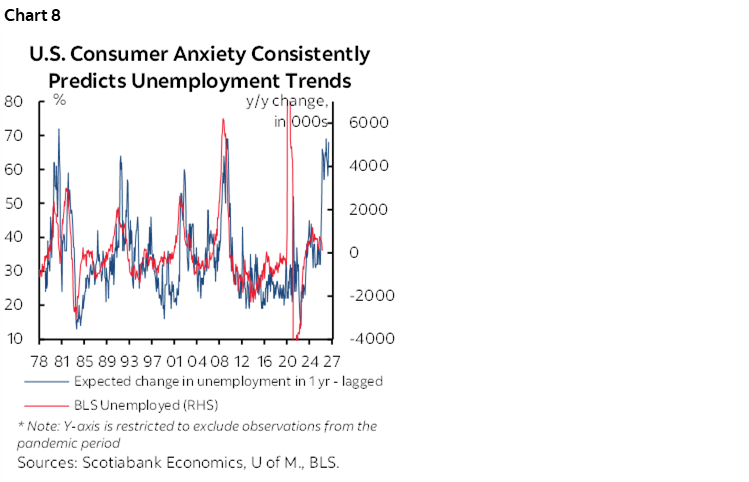
- ...but unemployment expectations soared…
- …and they have an uncanny knack at forecasting this
- US CPI / core CPI, m/m %, SA, March:
- Actual: 0.9 / 0.2
- Scotia: 1.0 / 0.3
- Consensus: 0.9 / 0.3
- Prior: 0.3 / 0.2
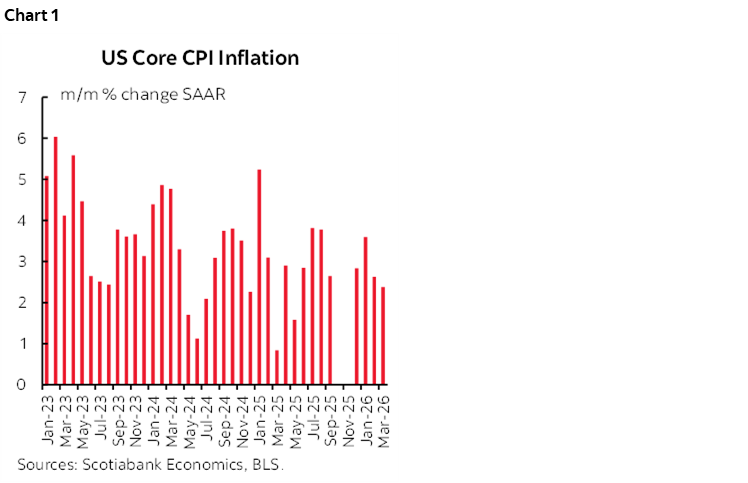
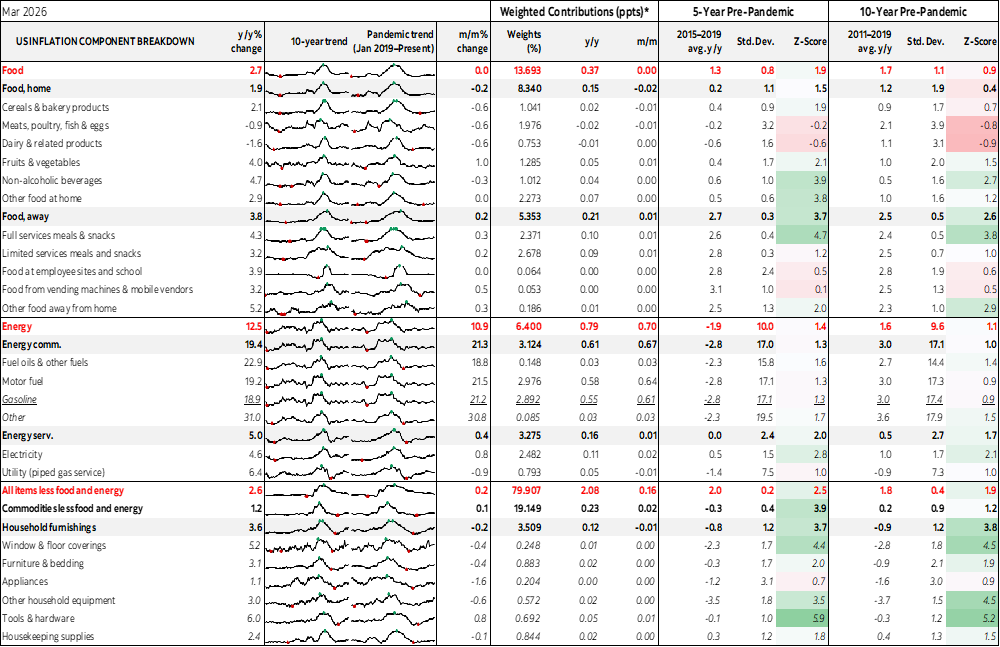
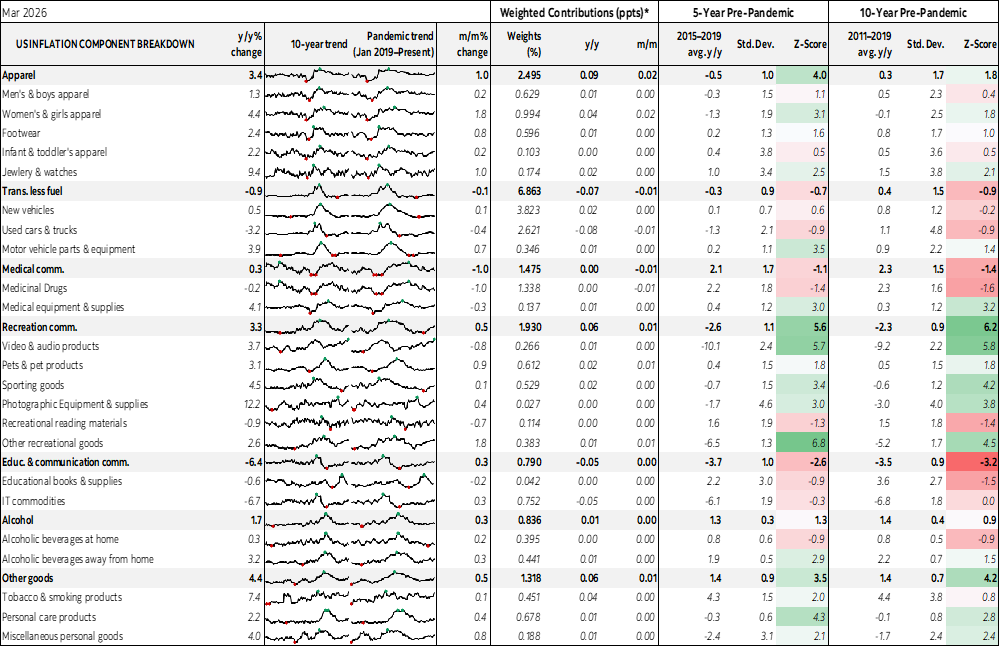
US core cpi was up by 0.2% m/m SA without rounding and hence a tick beneath most expectations while matching the prior month’s reading. US headline CPI was up by 0.9% and on the screws. It’s too early to get any transmission into core so personally I would fade that reading from a policy standpoint.
Annualized m/m core CPI inflation is tracking close to 2% (chart 1).
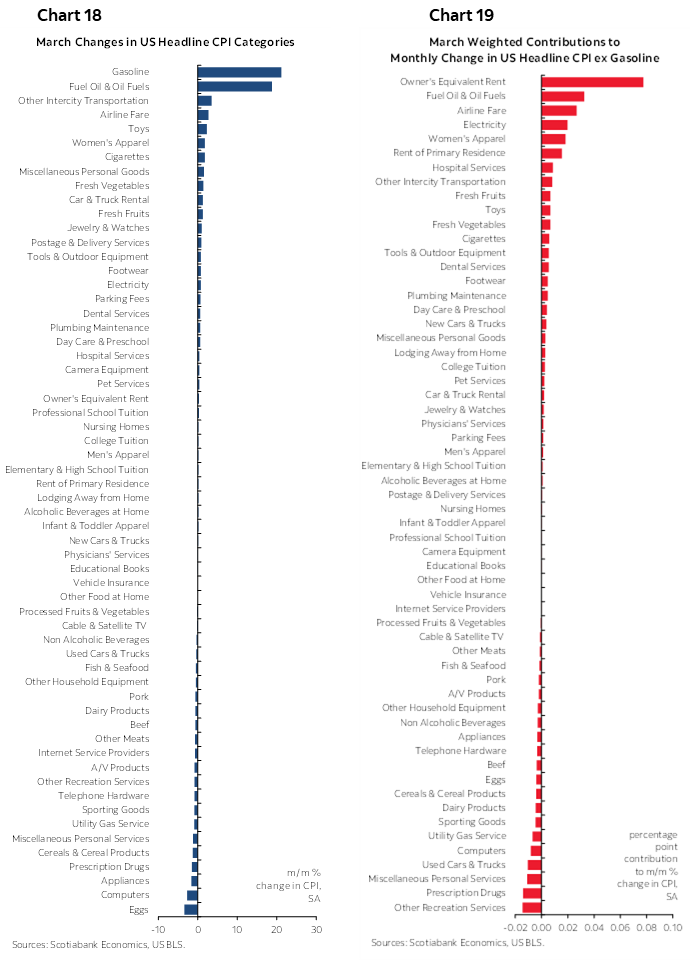
Rising breadth will concern the hawks on the FOMC (chart 2).
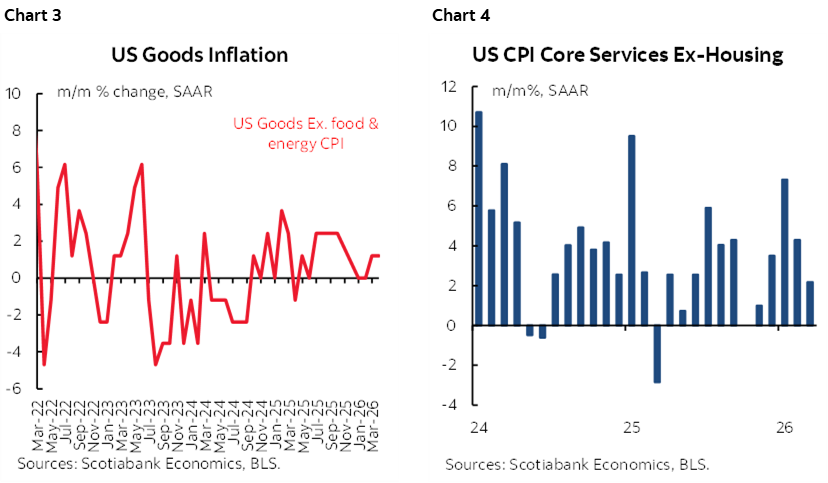
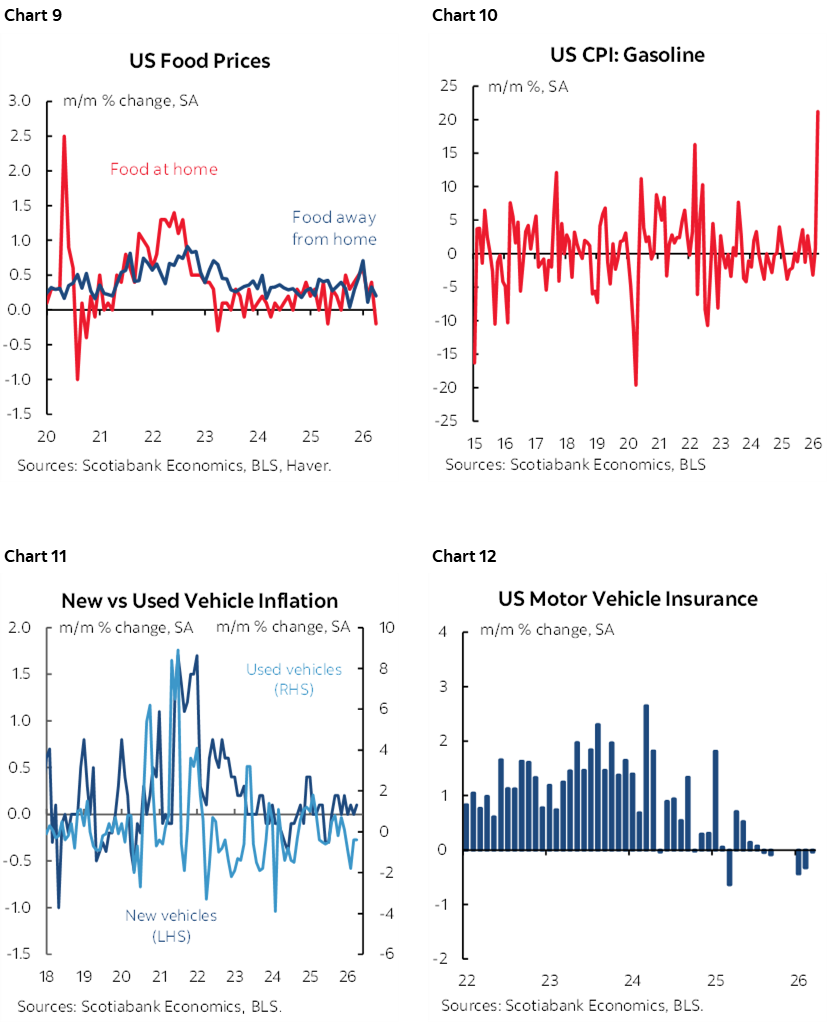
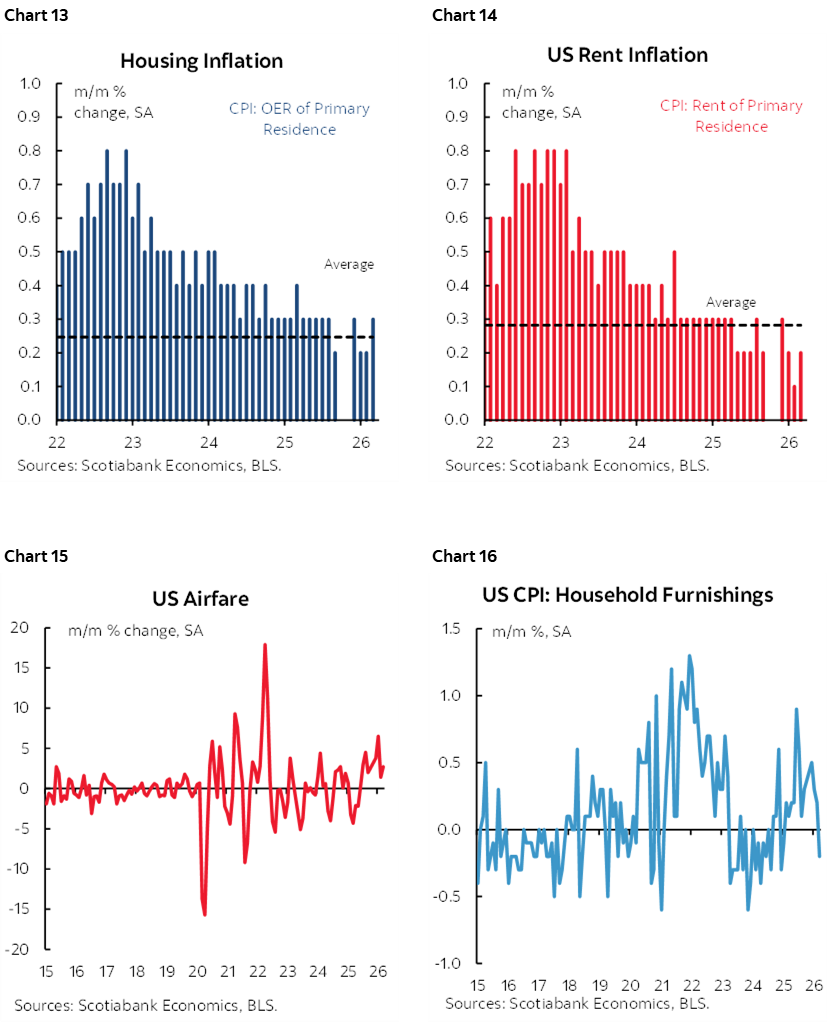
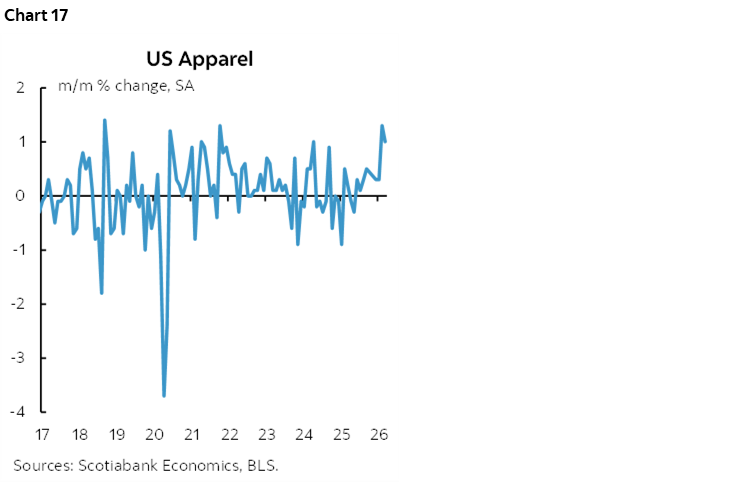
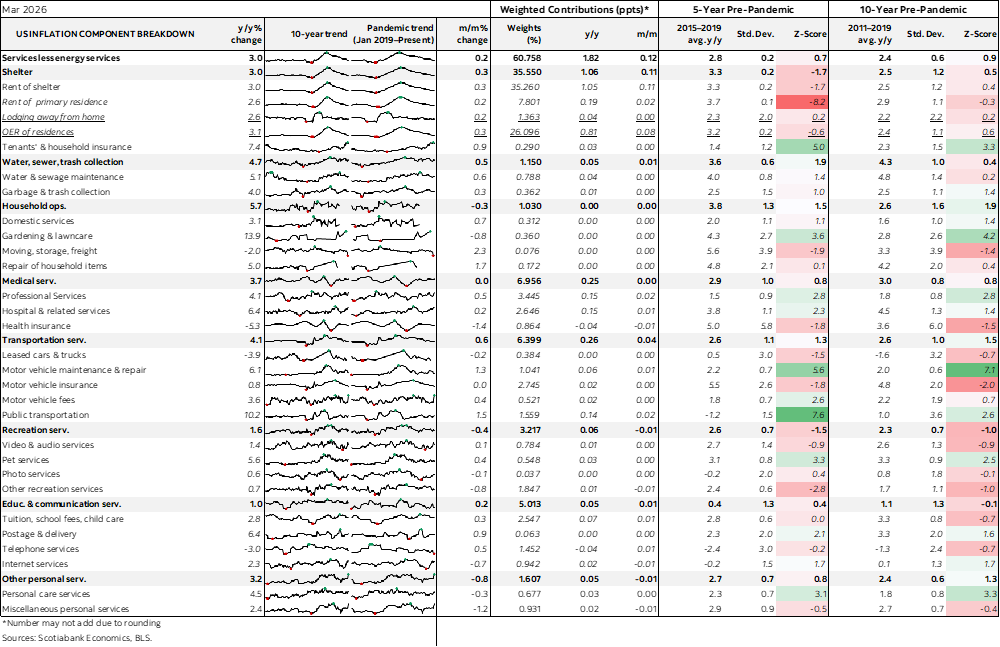
Core goods inflation picked up a bit over the past two months while core services inflation has been ebbing (charts 3, 4).
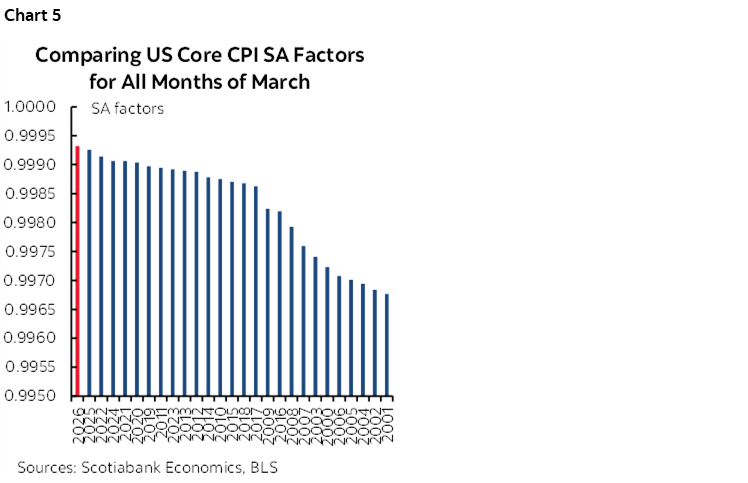
The SA factor for core CPI was unusually high—in fact, a historic high comparing like months of March over time (chart 5). Because it’s driven by a recency bias skewed to the pandemic-onward period, this means it probably overstated core inflation.
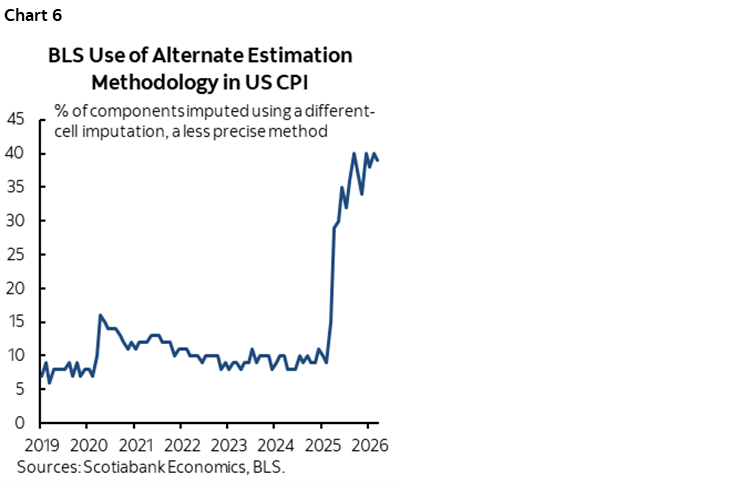
All that said, the BLS is continuing to use a very high proportion of proxy methods for gathering prices by drawing upon substitute products and substitute markets where their resources and sampling methodologies are unable to get data (chart 6). At 39%, a large portion of the CPI basket is suffering from low data quality.
The next few pages offer plenty of charts to consider but we’ll keep this one brief. March CPI won’t influence a thing at the Fed and barely drew any market reaction. It’s a first stab at the war’s effects, it’s too early for core transmission to occur, and there remains uncertainty around duration and magnitudes of the shock and how it impacts inflation and jobs.
Consumer Sentiment Plunges
University of Michigan consumer sentiment fell sharply to 47.6 in March from 53.5 on a combination of current and expected conditions. That’s worse than expected by consensus.
Consumers’ inflation expectations moved higher (chart 7).
What consumers expect to happen to unemployment in future remains concerning (chart 8). It’s soft data, but has never sent a false signal. Consumers are closer to their employers’ plans, the water cooler and Teams talk etc relative to markets and forecasters. I hope they’re wrong this time. Otherwise, what they are signalling is one of the few recession signals that points to massive job losses in which case nuts to inflation, the Fed may pivot more aggressively than our –50bps forecast spread over Q4/Q1. Consumers may be one part antsy about the cycle, the composition of policy and market risks, and AI’s coming effects.
DISCLAIMER
This report has been prepared by Scotiabank Economics as a resource for the clients of Scotiabank. Opinions, estimates and projections contained herein are our own as of the date hereof and are subject to change without notice. The information and opinions contained herein have been compiled or arrived at from sources believed reliable but no representation or warranty, express or implied, is made as to their accuracy or completeness. Neither Scotiabank nor any of its officers, directors, partners, employees or affiliates accepts any liability whatsoever for any direct or consequential loss arising from any use of this report or its contents.
These reports are provided to you for informational purposes only. This report is not, and is not constructed as, an offer to sell or solicitation of any offer to buy any financial instrument, nor shall this report be construed as an opinion as to whether you should enter into any swap or trading strategy involving a swap or any other transaction. The information contained in this report is not intended to be, and does not constitute, a recommendation of a swap or trading strategy involving a swap within the meaning of U.S. Commodity Futures Trading Commission Regulation 23.434 and Appendix A thereto. This material is not intended to be individually tailored to your needs or characteristics and should not be viewed as a “call to action” or suggestion that you enter into a swap or trading strategy involving a swap or any other transaction. Scotiabank may engage in transactions in a manner inconsistent with the views discussed this report and may have positions, or be in the process of acquiring or disposing of positions, referred to in this report.
Scotiabank, its affiliates and any of their respective officers, directors and employees may from time to time take positions in currencies, act as managers, co-managers or underwriters of a public offering or act as principals or agents, deal in, own or act as market makers or advisors, brokers or commercial and/or investment bankers in relation to securities or related derivatives. As a result of these actions, Scotiabank may receive remuneration. All Scotiabank products and services are subject to the terms of applicable agreements and local regulations. Officers, directors and employees of Scotiabank and its affiliates may serve as directors of corporations.
Any securities discussed in this report may not be suitable for all investors. Scotiabank recommends that investors independently evaluate any issuer and security discussed in this report, and consult with any advisors they deem necessary prior to making any investment.
This report and all information, opinions and conclusions contained in it are protected by copyright. This information may not be reproduced without the prior express written consent of Scotiabank.
™ Trademark of The Bank of Nova Scotia. Used under license, where applicable.
Scotiabank, together with “Global Banking and Markets”, is a marketing name for the global corporate and investment banking and capital markets businesses of The Bank of Nova Scotia and certain of its affiliates in the countries where they operate, including; Scotiabank Europe plc; Scotiabank (Ireland) Designated Activity Company; Scotiabank Inverlat S.A., Institución de Banca Múltiple, Grupo Financiero Scotiabank Inverlat, Scotia Inverlat Casa de Bolsa, S.A. de C.V., Grupo Financiero Scotiabank Inverlat, Scotia Inverlat Derivados S.A. de C.V. – all members of the Scotiabank group and authorized users of the Scotiabank mark. The Bank of Nova Scotia is incorporated in Canada with limited liability and is authorised and regulated by the Office of the Superintendent of Financial Institutions Canada. The Bank of Nova Scotia is authorized by the UK Prudential Regulation Authority and is subject to regulation by the UK Financial Conduct Authority and limited regulation by the UK Prudential Regulation Authority. Details about the extent of The Bank of Nova Scotia's regulation by the UK Prudential Regulation Authority are available from us on request. Scotiabank Europe plc is authorized by the UK Prudential Regulation Authority and regulated by the UK Financial Conduct Authority and the UK Prudential Regulation Authority.
Scotiabank Inverlat, S.A., Scotia Inverlat Casa de Bolsa, S.A. de C.V, Grupo Financiero Scotiabank Inverlat, and Scotia Inverlat Derivados, S.A. de C.V., are each authorized and regulated by the Mexican financial authorities.
Not all products and services are offered in all jurisdictions. Services described are available in jurisdictions where permitted by law.