- Total CPI undershot all estimates, BoC’s preferred core measures are off the lows
- Core goods inflation shot higher, services inflation tanked with a suspect driver
- One report changes nothing in the early days of inflation risk
- Canadian CPI, m/m % NSA, April:
- Actual: 0.35 / 2.8
- Scotia: 1.0 / 3.5
- Consensus: 0.7 / 3.1
- Prior: 0.9 / 2.4
Canadian inflation came in under everyone’s expectations and particularly mine in the spirt of accountability. That’s good news for the inflation watch so far but only at a highly nascent stage for evaluating inflation risk stemming from pass through of pre-war producer prices and pass through from the surge in commodities due to the war.
One category looked fishy to me and played a significant role and I’ll explain why.
Nevertheless, Canada is emerging from a prior soft patch on high frequency core inflation measures, but hardly at a screaming pace thus far. A lot of data still lies ahead and nothing is settled by one report.
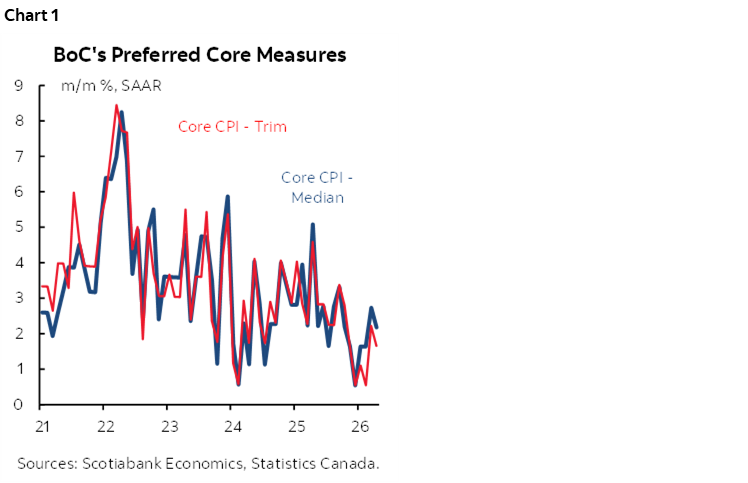
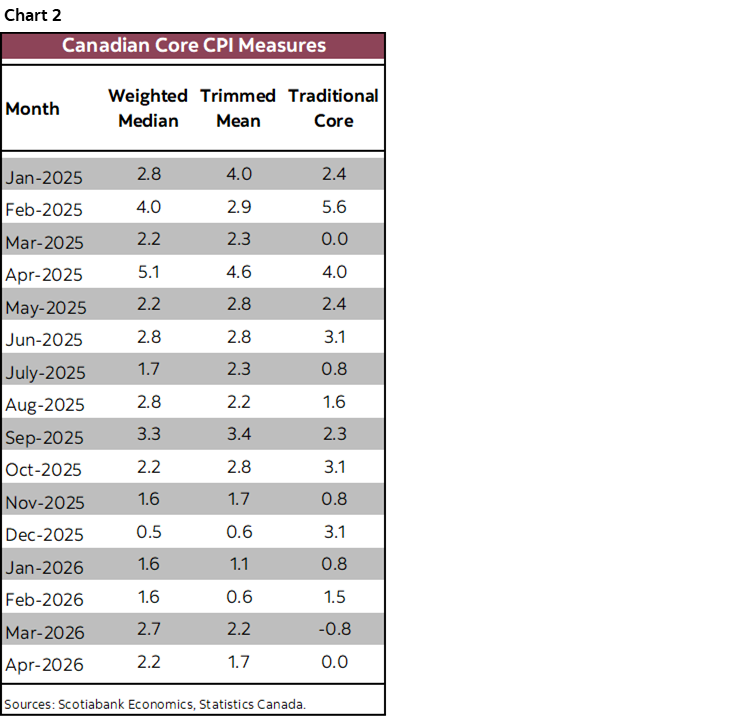
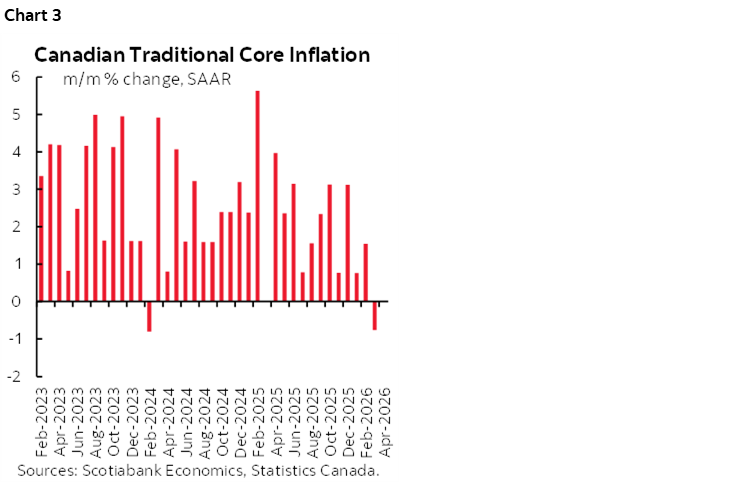
Charts 1, 2 and 3 show the m/m seasonally adjusted at annualized rate readings for core measures of inflation. Trimmed mean landed at 1.7% m/m SAAR with weighted median at 2.2% m/m SAAR with no revisions and have both exited the softest readings over prior months. Traditional core CPI (ex-food and energy) was 0% m/m SAAR and was revised down from 0% m/m SAAR in March to –0.75%.
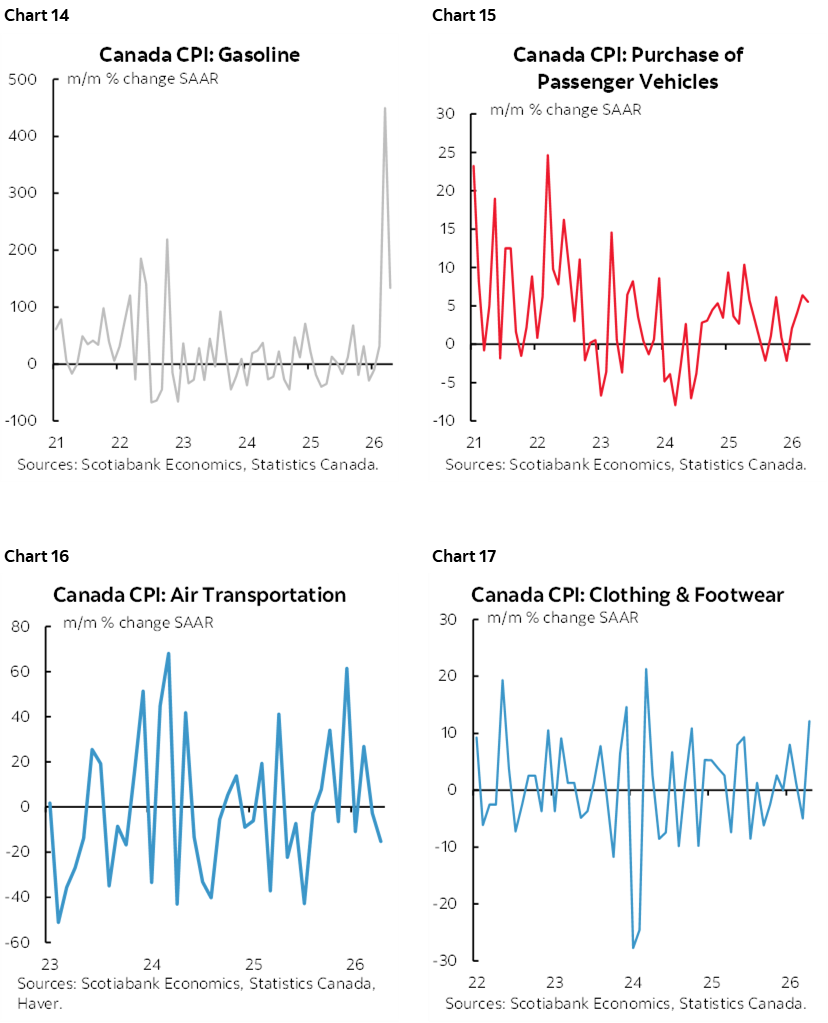
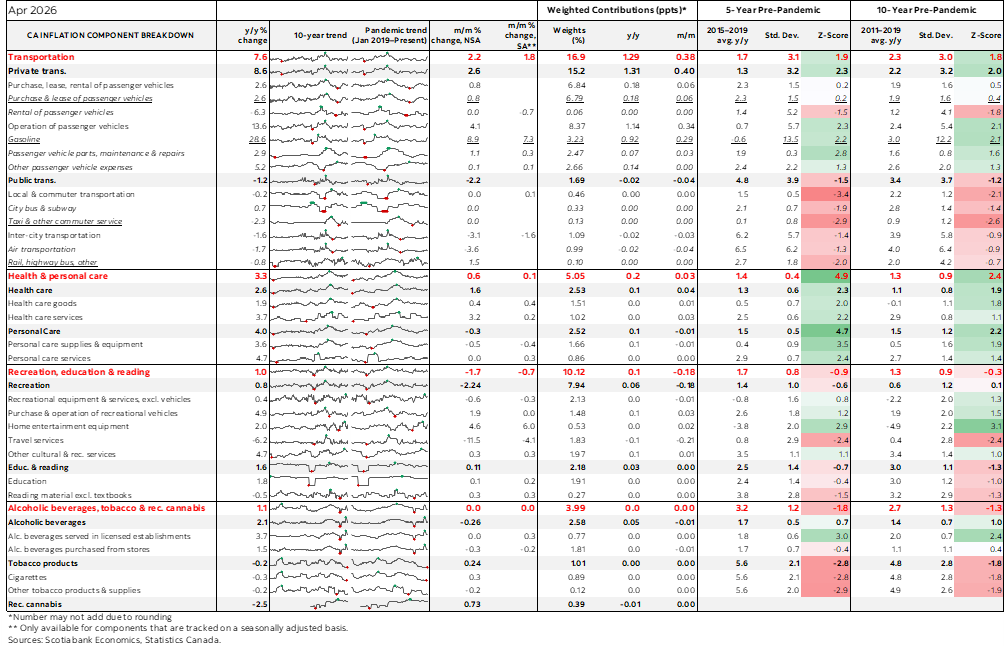
Core goods inflation (ex-food and energy) sharply accelerated last month (chart 4) to post the hottest reading since May 2022. Some of the categories driving core goods inflation included passenger vehicles, clothing and footwear. Services inflation offset that with the biggest drop since July 2020 (chart 5).
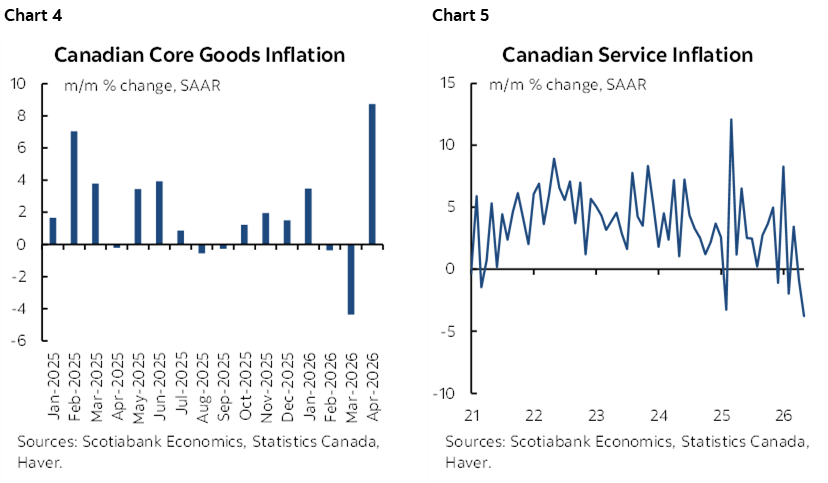
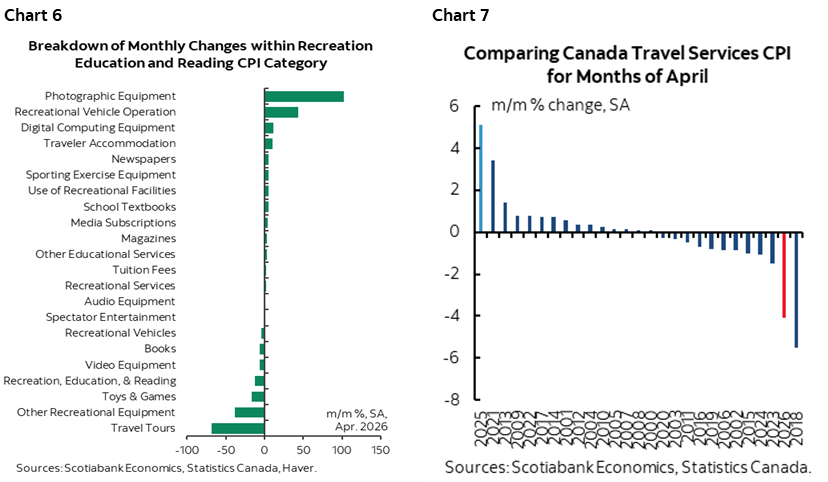
What drove services inflation to be so weak as an offset that trashed my call? Well, did anyone notice that travel tour prices are rapidly becoming free? Statcan says so. The drop in the recreation/education/reading category that carries a 10.1% basket weight in CPI shaved about 0.22% off of the headline m/m change that would have been 0.6% if this category were excluded. I thought soaring airfare and passed on behaviour would have driven it upward.
The case for excluding rec/reading/education is centered upon suspect data on one component: travel tour prices (chart 6). Statcan says they plummeted by 69% m/m annualized and seasonally unadjusted. That, in turn, drove the second biggest plunge in m/m seasonally adjusted total travel services prices for like months of April on record (chart 7). This is a tough category to estimate with hard data and I think it’s worth flagging a significant data quality issue.
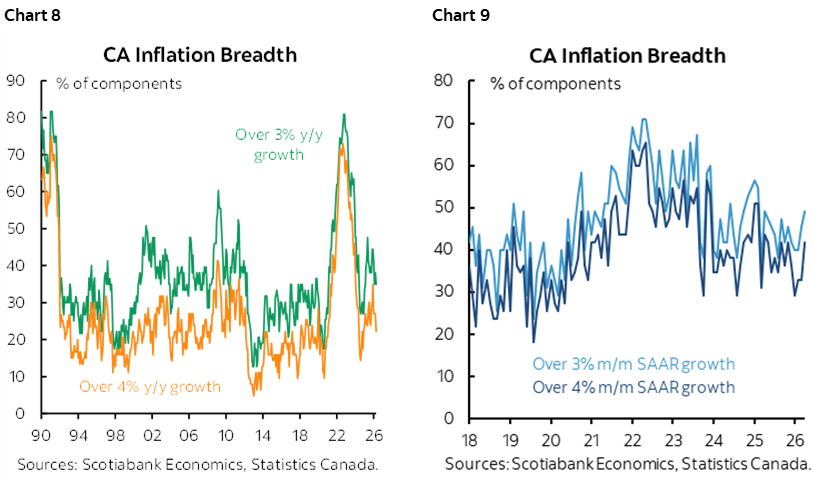
On breadth, take your pick between charts 8 and 9. It either slipped in y/y terms, or increased in m/m SAAR terms.
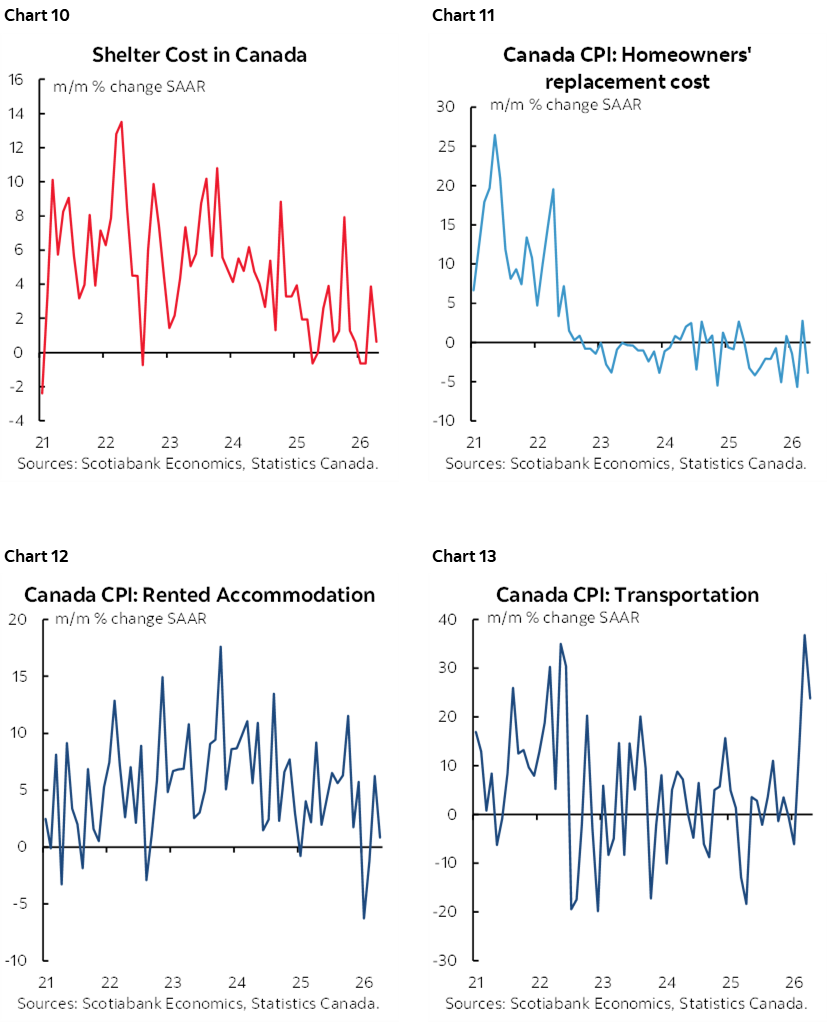
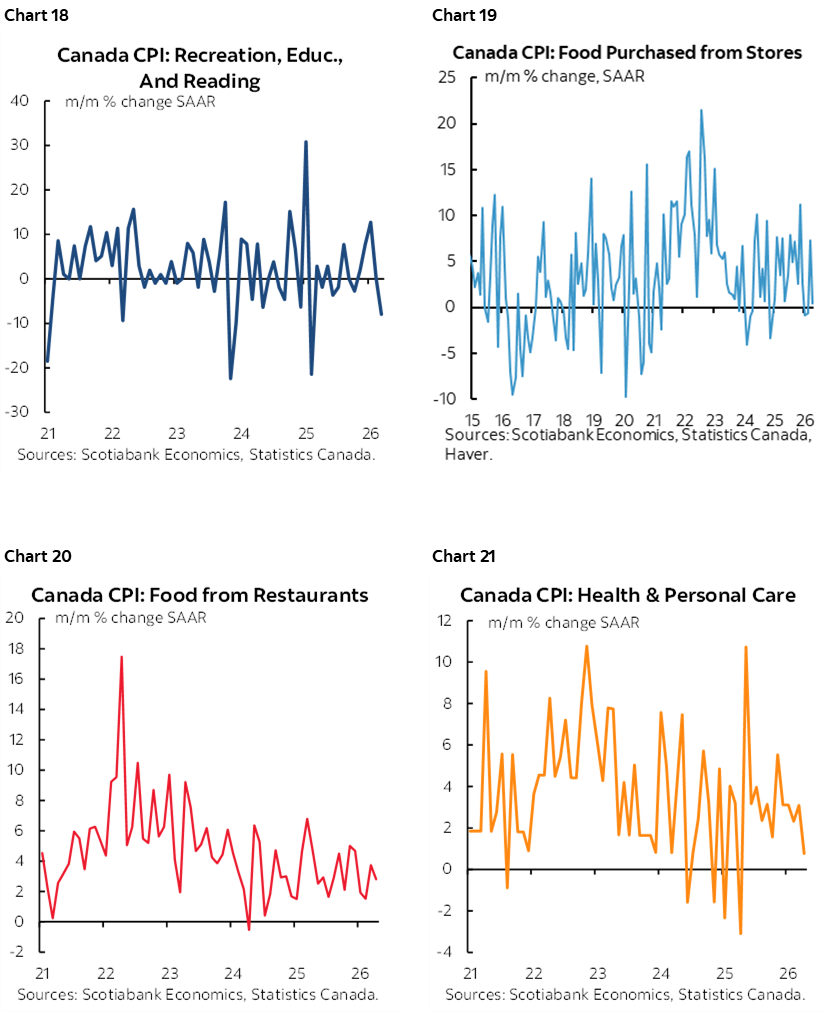
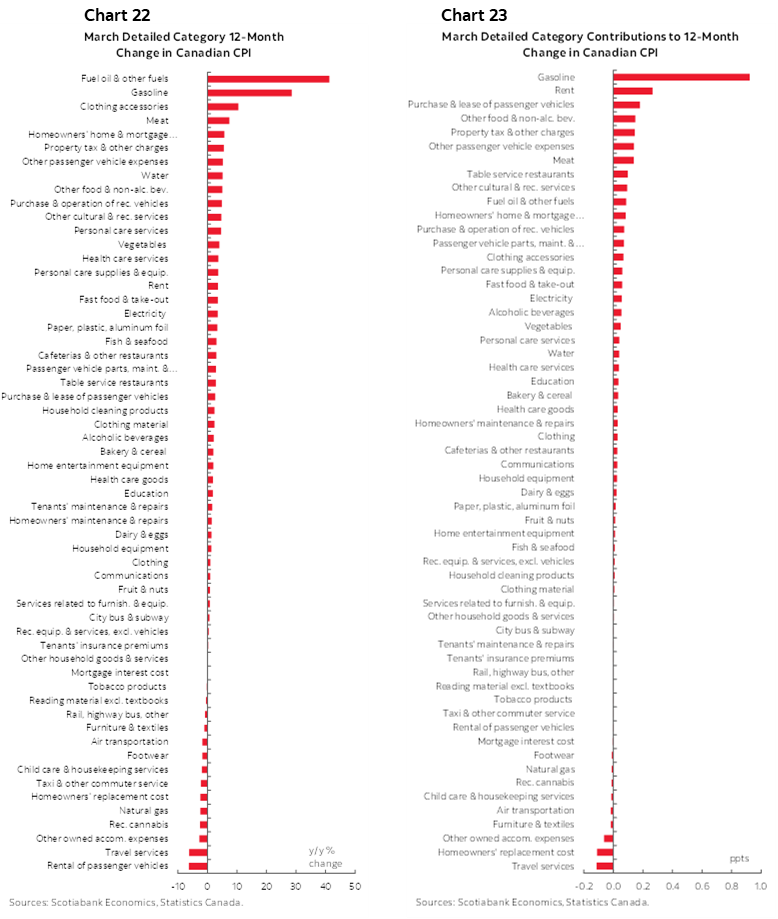
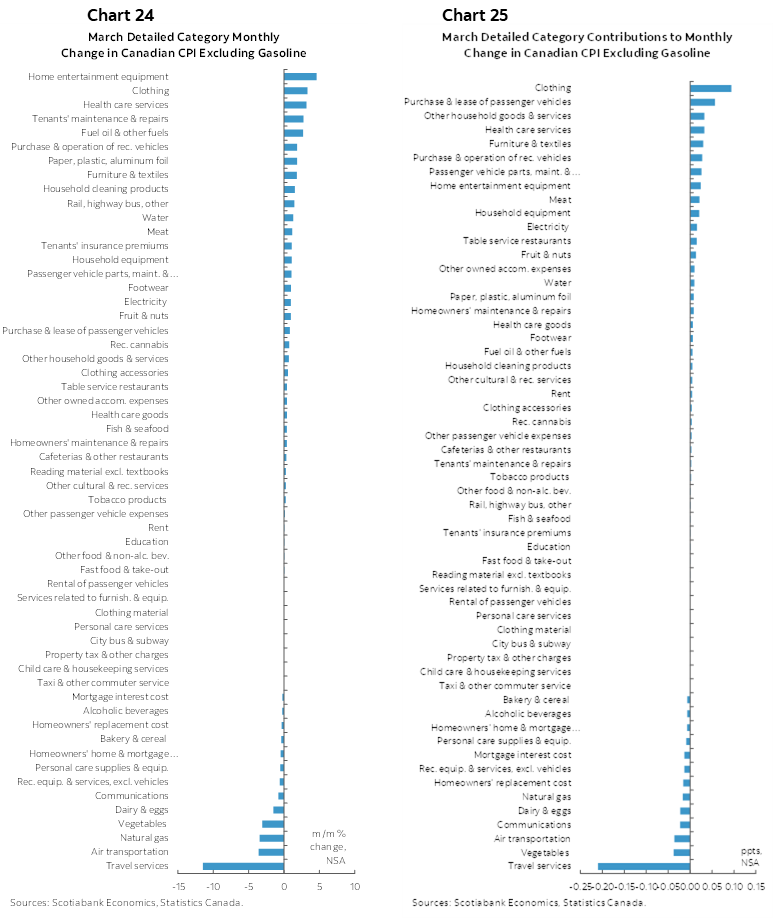
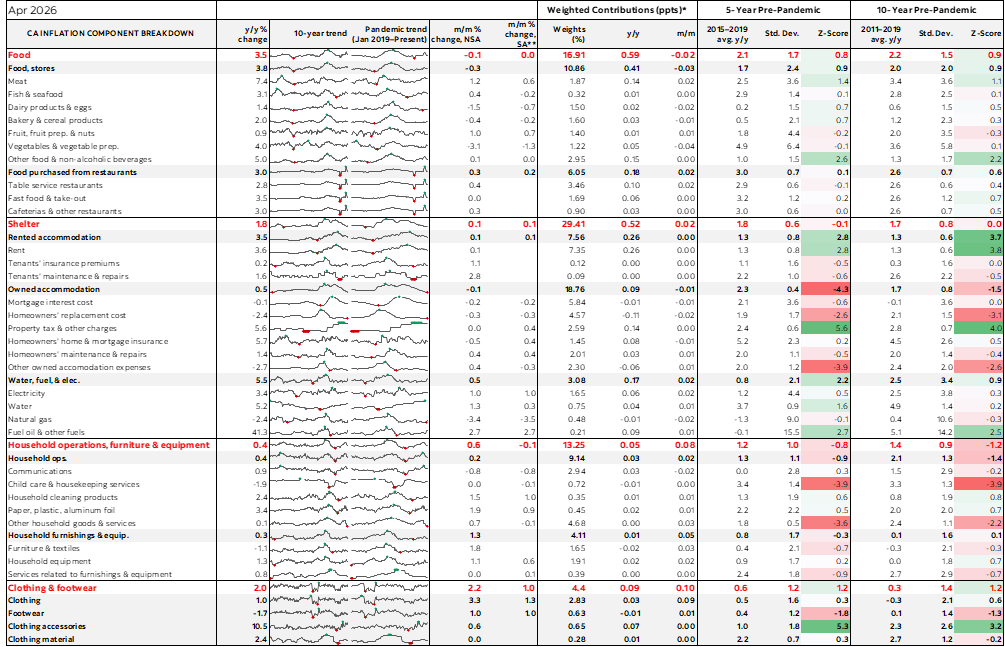
Charts 10–21 provide further breakdowns of the basket. Charts 22–25 break down y/y and m/m changes in unweighted and weighted terms. Please also see the accompanying table.
DISCLAIMER
This report has been prepared by Scotiabank Economics as a resource for the clients of Scotiabank. Opinions, estimates and projections contained herein are our own as of the date hereof and are subject to change without notice. The information and opinions contained herein have been compiled or arrived at from sources believed reliable but no representation or warranty, express or implied, is made as to their accuracy or completeness. Neither Scotiabank nor any of its officers, directors, partners, employees or affiliates accepts any liability whatsoever for any direct or consequential loss arising from any use of this report or its contents.
These reports are provided to you for informational purposes only. This report is not, and is not constructed as, an offer to sell or solicitation of any offer to buy any financial instrument, nor shall this report be construed as an opinion as to whether you should enter into any swap or trading strategy involving a swap or any other transaction. The information contained in this report is not intended to be, and does not constitute, a recommendation of a swap or trading strategy involving a swap within the meaning of U.S. Commodity Futures Trading Commission Regulation 23.434 and Appendix A thereto. This material is not intended to be individually tailored to your needs or characteristics and should not be viewed as a “call to action” or suggestion that you enter into a swap or trading strategy involving a swap or any other transaction. Scotiabank may engage in transactions in a manner inconsistent with the views discussed this report and may have positions, or be in the process of acquiring or disposing of positions, referred to in this report.
Scotiabank, its affiliates and any of their respective officers, directors and employees may from time to time take positions in currencies, act as managers, co-managers or underwriters of a public offering or act as principals or agents, deal in, own or act as market makers or advisors, brokers or commercial and/or investment bankers in relation to securities or related derivatives. As a result of these actions, Scotiabank may receive remuneration. All Scotiabank products and services are subject to the terms of applicable agreements and local regulations. Officers, directors and employees of Scotiabank and its affiliates may serve as directors of corporations.
Any securities discussed in this report may not be suitable for all investors. Scotiabank recommends that investors independently evaluate any issuer and security discussed in this report, and consult with any advisors they deem necessary prior to making any investment.
This report and all information, opinions and conclusions contained in it are protected by copyright. This information may not be reproduced without the prior express written consent of Scotiabank.
™ Trademark of The Bank of Nova Scotia. Used under license, where applicable.
Scotiabank, together with “Global Banking and Markets”, is a marketing name for the global corporate and investment banking and capital markets businesses of The Bank of Nova Scotia and certain of its affiliates in the countries where they operate, including; Scotiabank Europe plc; Scotiabank (Ireland) Designated Activity Company; Scotiabank Inverlat S.A., Institución de Banca Múltiple, Grupo Financiero Scotiabank Inverlat, Scotia Inverlat Casa de Bolsa, S.A. de C.V., Grupo Financiero Scotiabank Inverlat, Scotia Inverlat Derivados S.A. de C.V. – all members of the Scotiabank group and authorized users of the Scotiabank mark. The Bank of Nova Scotia is incorporated in Canada with limited liability and is authorised and regulated by the Office of the Superintendent of Financial Institutions Canada. The Bank of Nova Scotia is authorized by the UK Prudential Regulation Authority and is subject to regulation by the UK Financial Conduct Authority and limited regulation by the UK Prudential Regulation Authority. Details about the extent of The Bank of Nova Scotia's regulation by the UK Prudential Regulation Authority are available from us on request. Scotiabank Europe plc is authorized by the UK Prudential Regulation Authority and regulated by the UK Financial Conduct Authority and the UK Prudential Regulation Authority.
Scotiabank Inverlat, S.A., Scotia Inverlat Casa de Bolsa, S.A. de C.V, Grupo Financiero Scotiabank Inverlat, and Scotia Inverlat Derivados, S.A. de C.V., are each authorized and regulated by the Mexican financial authorities.
Not all products and services are offered in all jurisdictions. Services described are available in jurisdictions where permitted by law.