- Canada lost 18k jobs and the unemployment rate edged higher
- Quebec and probably weather drove it
- Canadian immigration policy is driving parallel declines in jobs and the labour force
- Why the BoC is unlikely to bat an eye at the figures
- Canadian jobs m/m 000s / UR %, SA, April:
- Actual: -17.7 / 6.9
- Scotia: 0.0 / 6.7
- Consensus: 10 / 6.7
- Prior: 14.1 / 6.7
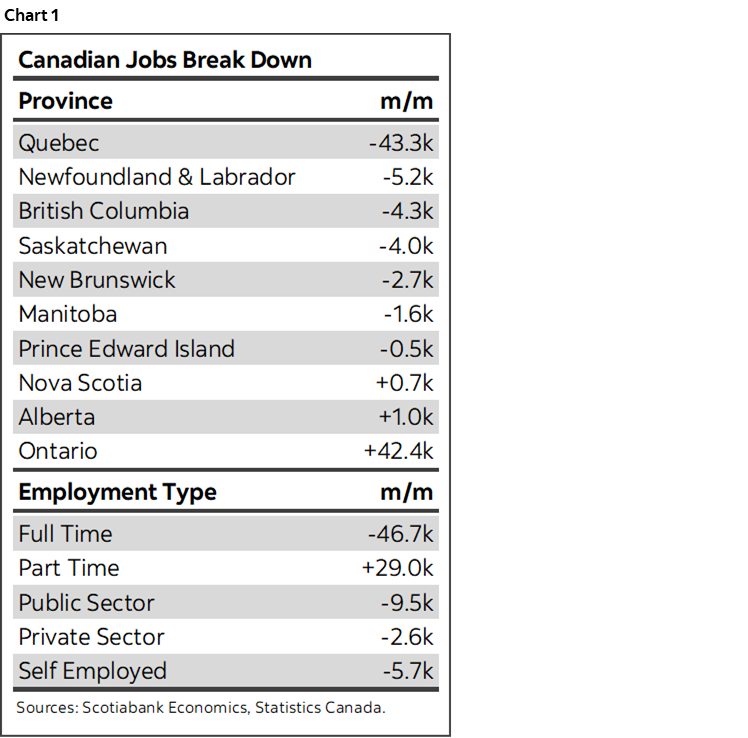
Last month was a cage match between Canada’s two largest job markets. In one corner, Quebec’s job market is clearly challenged. It was the culprit behind Canada losing about 18k jobs last month. Take Quebec out and the rest of the country gained jobs on net and was strongly led by Ontario. My estimate was the closest in the street’s consensus.
Quebec Vs Ontario
Chart 1 offers a few summary stats. Ontario’s 42,400 job gain was almost exactly neutralized by Quebec’s 43,300 job loss. The rest of the provinces largely treaded water.
Sectors and Weather
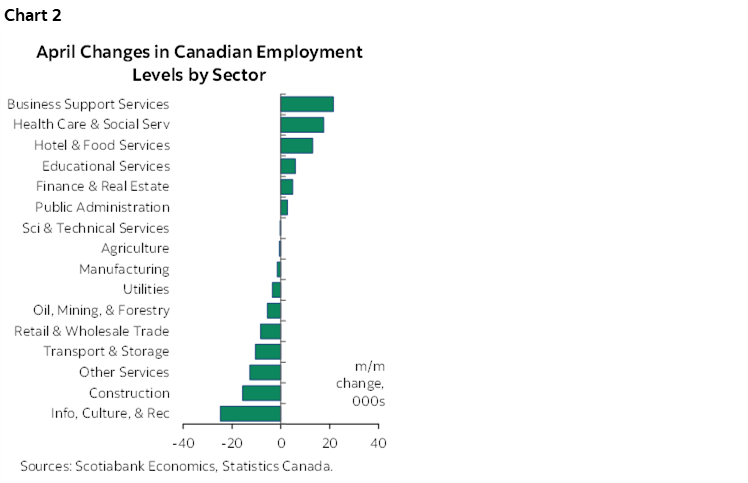
On a sector basis, chart 2 shows a mixed variety of gainers and losers. I’m a bit suspicious toward the concentrated outlier losses in the leisure (info/culture/rec) and construction sectors as they are most likely to be affected by weather.
Speaking of which, weather and sickies wrought havoc upon the numbers again. Charts 3 and 4 show that yet again, there was an abnormal number of hours worked that were lost to both weather and illness in April. That might help to explain softness in hours worked that I’ll come back to, but the ties to jobs are harder to make. Most folks don’t lose employment because of temporary weather or sickness factors, but it’s conceivable that both factors interfered with the job search, offer and acceptance process and resulted in layoffs for flexible employment in the most affected sectors.
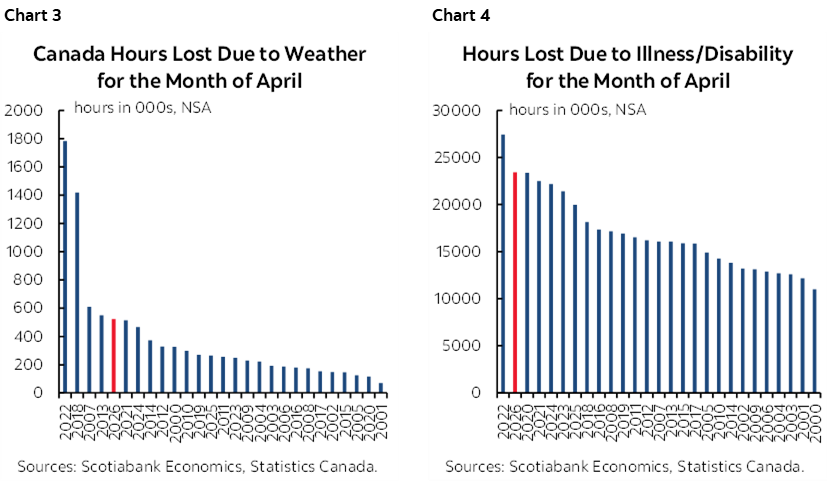
One illustration of weather’s effect is that Quebec recorded double the normal (94mm) of precipitation in April with about 182mm.
Fade the UR’s Rise
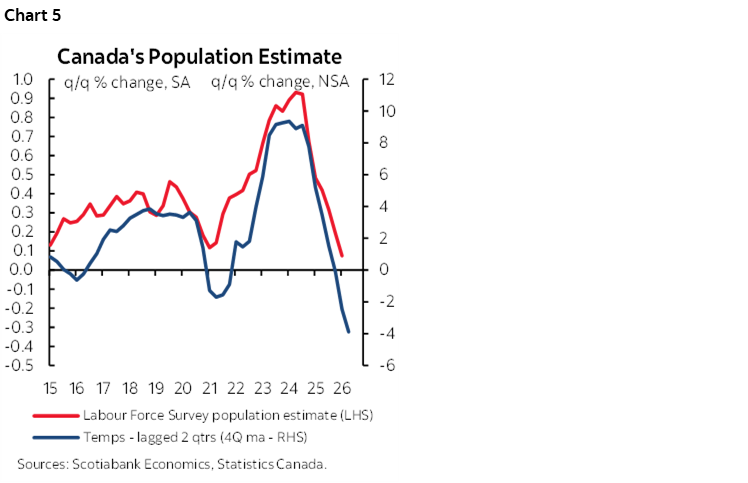
Fade the two-tenths jump in the unemployment rate because it’s a statistical artefact owing itself toe the peculiarities of the Labour Force Survey. The survey recorded a 33.5k jump in the size of the labour force and a 9k rise in total population aged 15+. I don’t trust those figures because the LFS lags official population statistics that have been showing contraction. The LFS applies a smoothed 12-month moving average to the temporary resident category of immigrants which has been the biggest source of population declines due to tighter immigration policy. LFS will turn south on population and probably the labour force in lagging fashion over coming months. When this may happen isn’t clear, but chart 5 shows a roughly two-quarter lag between when the 12-month moving average of the temps population category begins to drive shrinkage in the LFS definition of population. This is why we have the Canadian unemployment rate falling to around 6% later this year as the labour force shrinks alongside population.
Immigration Policy’s Effects
Losing 112k jobs year-to-date—half of which is youths—isn’t great. Yet the labour force has contracted by almost as much over this period (-98k). This is why the unemployment rate has been little changed; it ended 2025 at 6.8% and is currently 6.9%. The prior argument about a negative employment breakeven rate and lagging LFS reactions to immigration changes suggest future downward pressure on the unemployment rate. Shame on newswires flashing just the jobs component of the story!
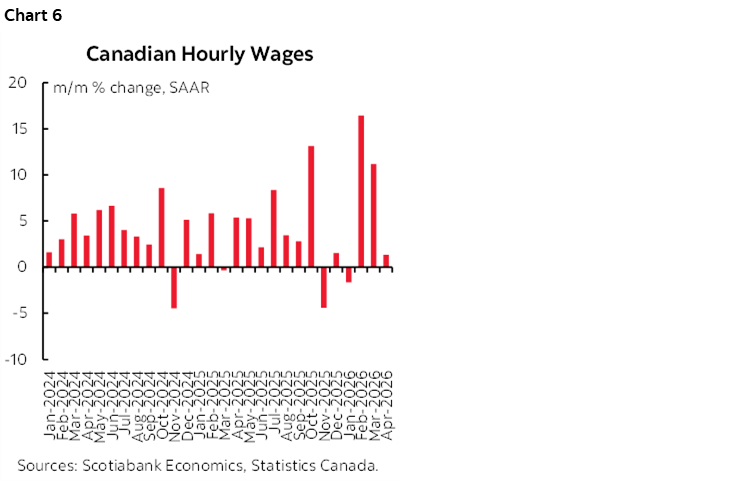
Wage Growth Ebbed After Two Explosive Months
Wage growth ebbed but after two explosive months (chart 6). Wages of permanent employees—typically the BoC’s preferred measure in this report—were up 1.3% m/m SAAR in April after 11.2% in March and 16.4% in February.
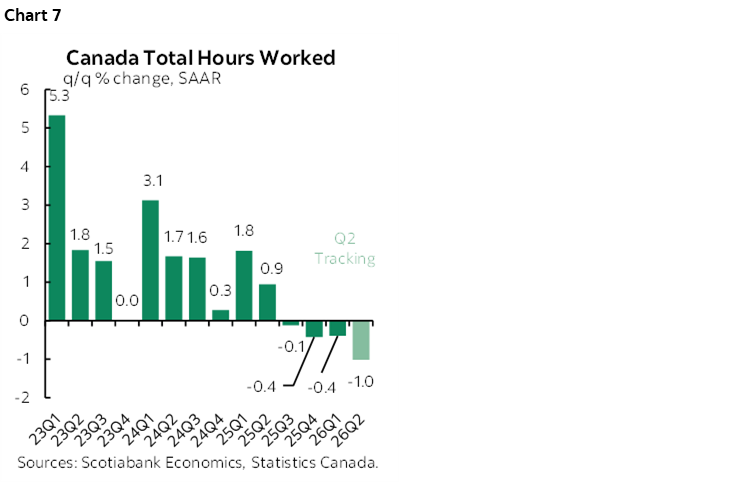
Hours Worked Not Great for GDP
Hours worked were flat (-0.05% m/m SA). After -0.4% q/q SAAR, hours are tracking -1% q/q SAAR in Q2 but very tentatively based on just Q1 and April with a lot of data still ahead of us (chart 7). The Q2 tracking may mean that GDP would need a productivity lift to stay in the black in that quarter.
What Does it Mean for the BoC?
Nothing. Or at least it shouldn’t. The Canadian jobs breakeven is zero to negative. That is the estimated monthly change in employment needed to keep the unemployment rate reasonably stable over time. It’s unclear whether –18k jobs and +34k for the size of the labour force is a trend departure from this argument especially given the aforementioned quirks to the LFS survey.
For instance, if the LFS catches up to shrinking population and tightens the labour force only for the unemployment rate to decline toward our year-end 6% mark, then it would be foolish for the BoC to have reacted.
Then layer on umpteen other arguments I won’t repeat here but that include the dominant inflation mandate.
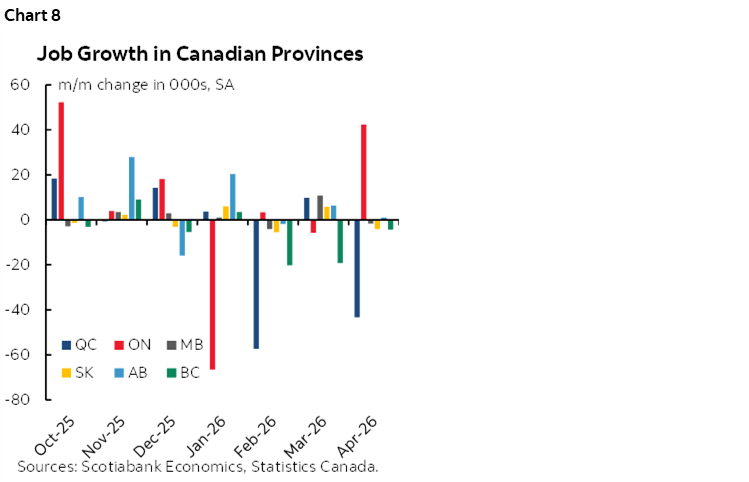
Lastly, chart 8 comes back to the point about the provincial distribution of changes in employment. Central Canada—particularly Quebec—has been the source of the dominant swing factors from month to month this year.
DISCLAIMER
This report has been prepared by Scotiabank Economics as a resource for the clients of Scotiabank. Opinions, estimates and projections contained herein are our own as of the date hereof and are subject to change without notice. The information and opinions contained herein have been compiled or arrived at from sources believed reliable but no representation or warranty, express or implied, is made as to their accuracy or completeness. Neither Scotiabank nor any of its officers, directors, partners, employees or affiliates accepts any liability whatsoever for any direct or consequential loss arising from any use of this report or its contents.
These reports are provided to you for informational purposes only. This report is not, and is not constructed as, an offer to sell or solicitation of any offer to buy any financial instrument, nor shall this report be construed as an opinion as to whether you should enter into any swap or trading strategy involving a swap or any other transaction. The information contained in this report is not intended to be, and does not constitute, a recommendation of a swap or trading strategy involving a swap within the meaning of U.S. Commodity Futures Trading Commission Regulation 23.434 and Appendix A thereto. This material is not intended to be individually tailored to your needs or characteristics and should not be viewed as a “call to action” or suggestion that you enter into a swap or trading strategy involving a swap or any other transaction. Scotiabank may engage in transactions in a manner inconsistent with the views discussed this report and may have positions, or be in the process of acquiring or disposing of positions, referred to in this report.
Scotiabank, its affiliates and any of their respective officers, directors and employees may from time to time take positions in currencies, act as managers, co-managers or underwriters of a public offering or act as principals or agents, deal in, own or act as market makers or advisors, brokers or commercial and/or investment bankers in relation to securities or related derivatives. As a result of these actions, Scotiabank may receive remuneration. All Scotiabank products and services are subject to the terms of applicable agreements and local regulations. Officers, directors and employees of Scotiabank and its affiliates may serve as directors of corporations.
Any securities discussed in this report may not be suitable for all investors. Scotiabank recommends that investors independently evaluate any issuer and security discussed in this report, and consult with any advisors they deem necessary prior to making any investment.
This report and all information, opinions and conclusions contained in it are protected by copyright. This information may not be reproduced without the prior express written consent of Scotiabank.
™ Trademark of The Bank of Nova Scotia. Used under license, where applicable.
Scotiabank, together with “Global Banking and Markets”, is a marketing name for the global corporate and investment banking and capital markets businesses of The Bank of Nova Scotia and certain of its affiliates in the countries where they operate, including; Scotiabank Europe plc; Scotiabank (Ireland) Designated Activity Company; Scotiabank Inverlat S.A., Institución de Banca Múltiple, Grupo Financiero Scotiabank Inverlat, Scotia Inverlat Casa de Bolsa, S.A. de C.V., Grupo Financiero Scotiabank Inverlat, Scotia Inverlat Derivados S.A. de C.V. – all members of the Scotiabank group and authorized users of the Scotiabank mark. The Bank of Nova Scotia is incorporated in Canada with limited liability and is authorised and regulated by the Office of the Superintendent of Financial Institutions Canada. The Bank of Nova Scotia is authorized by the UK Prudential Regulation Authority and is subject to regulation by the UK Financial Conduct Authority and limited regulation by the UK Prudential Regulation Authority. Details about the extent of The Bank of Nova Scotia's regulation by the UK Prudential Regulation Authority are available from us on request. Scotiabank Europe plc is authorized by the UK Prudential Regulation Authority and regulated by the UK Financial Conduct Authority and the UK Prudential Regulation Authority.
Scotiabank Inverlat, S.A., Scotia Inverlat Casa de Bolsa, S.A. de C.V, Grupo Financiero Scotiabank Inverlat, and Scotia Inverlat Derivados, S.A. de C.V., are each authorized and regulated by the Mexican financial authorities.
Not all products and services are offered in all jurisdictions. Services described are available in jurisdictions where permitted by law.