- Canada added 14k jobs with mixed details
- Sickies and weather remained as drag factors which may point to later gains
- Wages exploded but with two-sided interpretations
- BoC watchers should continue to fade backward data
- Canadian jobs m/m 00s / UR %, SA, March:
- Actual: 14.1 / 6.7
- Scotia: 30 / 6.6
- Consensus: 15.0 / 6.7
- Prior: -83.9 / 6.7
Markets largely ignored Canadian jobs numbers as they should. They’re backward looking and peering into the abyss where surging commodity prices in a commodity producing country dominate attention alongside the outlook for the US economy and trade policy.
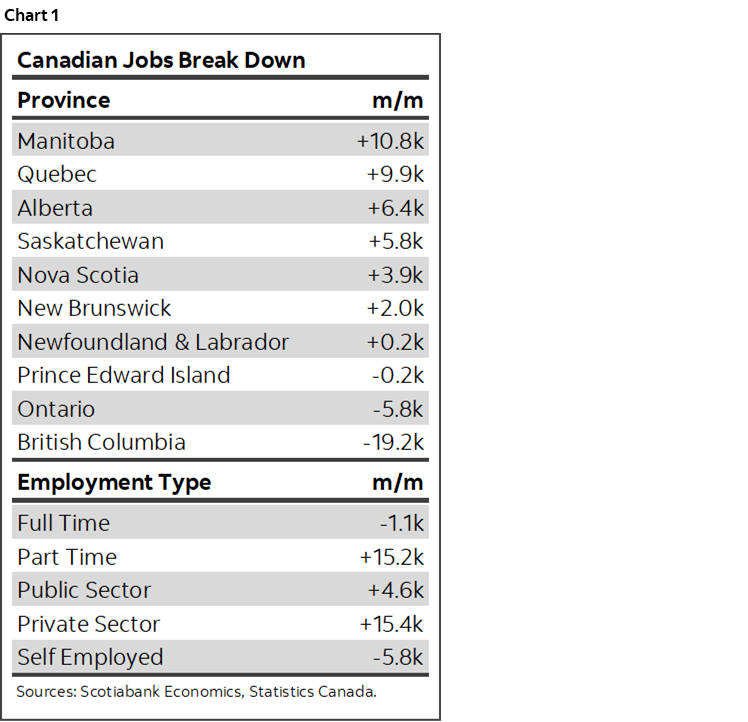
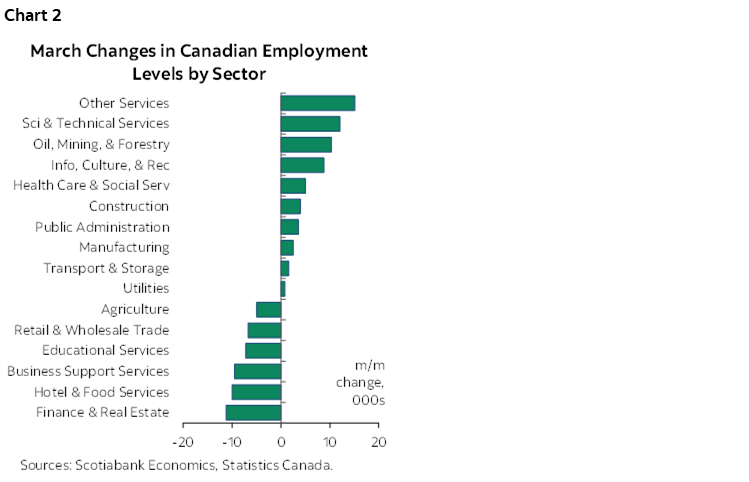
Jobs were up by 14.1k. Details were mixed as I’ll explain but for now check out charts 1 and 2 for summary measures. Canada’s 2-year bond yield fell by 1–2 bps post data while the US 2-year yield rose by 1–2bps post US CPI. CAD strengthened by under a quarter cent to the dollar.
Details
After losing 84k jobs, a gain of 14k isn’t great. Details were mixed to boot. Before turning to that, however, I think that among the factors that kept job growth back in February were some that repeated in March.
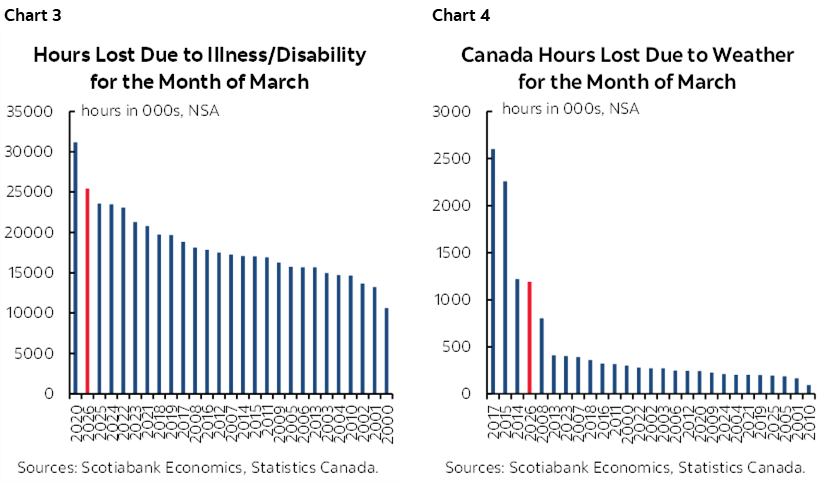
How so? You don’t generally lose a job if you’re sick or it’s bad weather, but both can prevent the interviewing and hiring process. Charts 3 and 4 continue to show unusually high numbers of hours lost due to sickness and weather. This was an awful flu season in the US and Canada and there is no need to tell Canadians about the worse than usual winter (US eastern seaboard too).
If that’s a contributing factor to a soft pattern for jobs of late then maybe chirpin’ birds and blossoming buds will bring something better. We’ll see.
The gain was driven by part-time jobs (+15.2k) as full-time jobs were flat (-1.1k).
The gain was mostly in private payrolls (+15.4k) as public payrolls were little changed (+4.6k) and so was the number of self-employed (-5.8k).
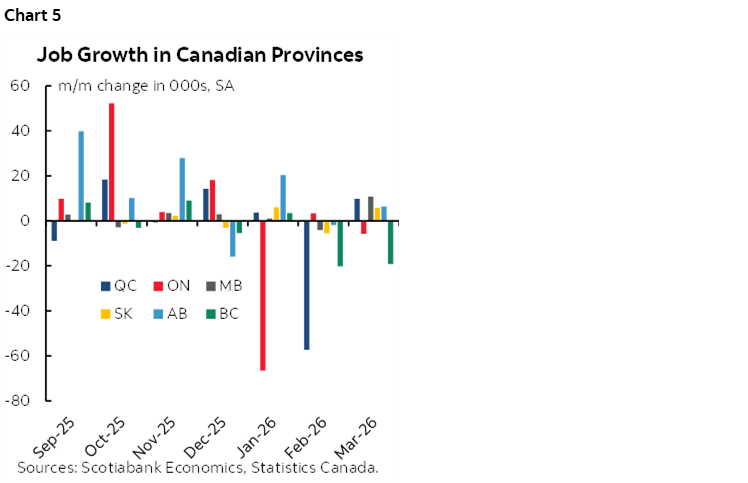
BC’s drop of 19k was the biggest drag among provinces (chart 5).
By sector, goods added 12.5k, services were flat at 1.7k. Within goods, resources were up 10.3k with little change elsewhere. Within services, it was mixed with ups and downs across several subsectors (chart 2 again).
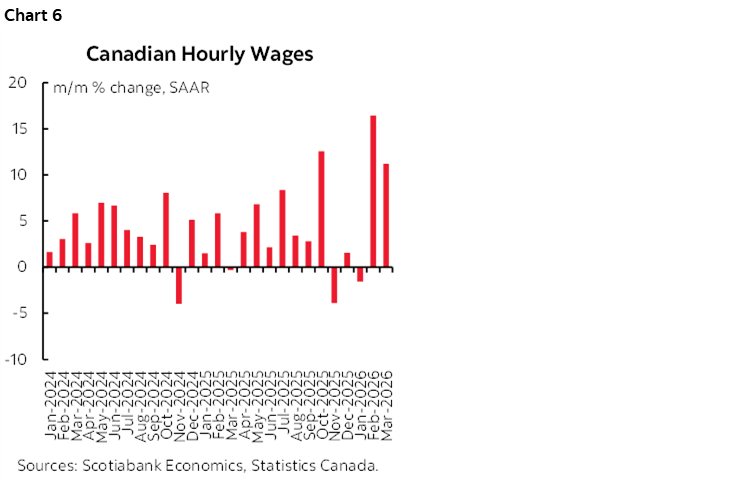
Wages are exploding with a caveat. Wages were up by 11.2% m/m SAAR in March. I expected a drop after the 16.4% m/m SAAR gain in February (chart 6). Statcan does note that wages were distorted by compositional shifts. Wages were up by 4.7% y/y but controlling the compositional shift yields wages up 3.6% y/y which has been stable over the past three months. Does this matter? Yes and no. Yes in that you want to control for shifts in terms of wage pressures at the margin. No in that whether people are getting paid more because of accelerating wages or because they're changing jobs/sectors doesn't much matter in a pay is pay and macro sense.
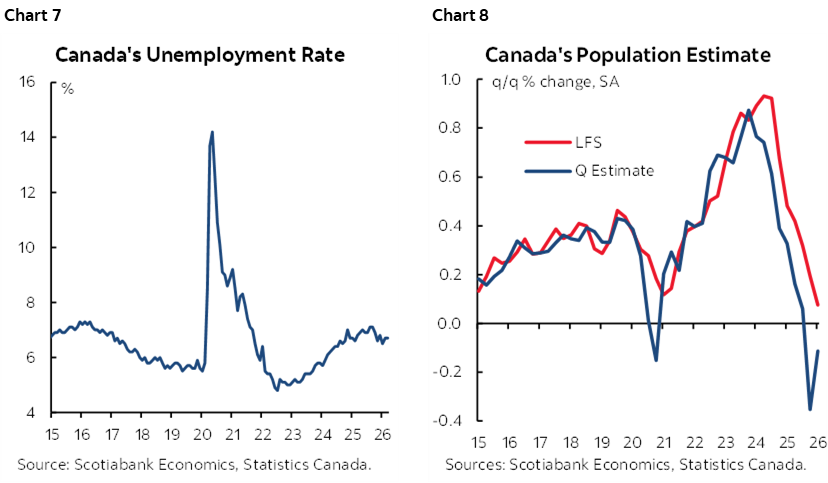
Ignore Canada's unemployment rate. It's fiction. It held at 6.7% in March which is marginally higher than the OECD’s estimate for the NAIRU equilibrium rate. Chart 7. The Labour Force Survey lags the decline in population in Statcan's quarterly numbers because it applies a 12-month smoothed moving average to the temps category of immigration and is therefore slow to turn lower as that's the category being curtailed by immigration policy. Chart 8. The point here being that the UR may fall/tighten when LFS catches up to falling population and LF counts.
Hours worked were up 0.25% m/m SA which is good for monthly GDP, not so good for quarterly (chart 9).
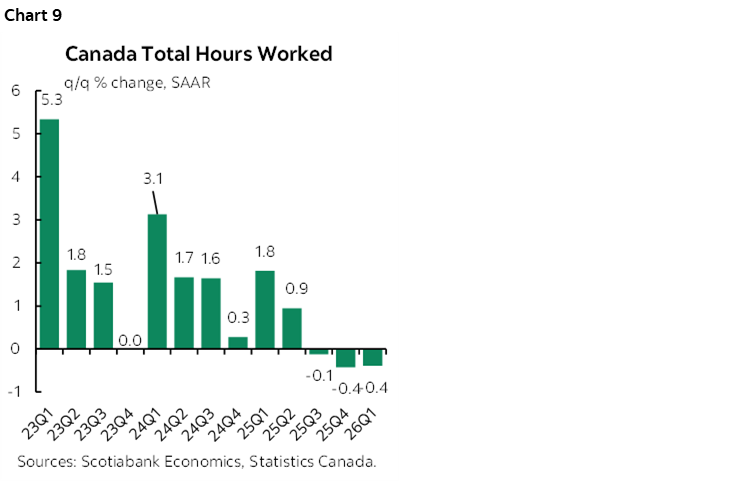
The gain in hours worked feeds into February GDP tracking 0.3% m/m SA versus Statcan's earlier 0.2 guidance. March is too early (we only have 0.2% m/m for hours, no other data) but this may indicate 0.1–0.2 for March GDP. That would give 3/4% q/q SAAR Q1 GDP using monthly figures, onto which we may add the reversal of the large 4%+ inventory drag on Q4 GDP. That could still leave within reach a 1–2% q/q SAAR GDP expansion, but a) final domestic demand may be tracking decently again like it did in Q4, so it's a textbook case of how GDP isn't always the bees knees especially given violent trade/inventory swings caused by Trump, and b) the BoC is focused on everything that the commodity surge changed, not backward data.
DISCLAIMER
This report has been prepared by Scotiabank Economics as a resource for the clients of Scotiabank. Opinions, estimates and projections contained herein are our own as of the date hereof and are subject to change without notice. The information and opinions contained herein have been compiled or arrived at from sources believed reliable but no representation or warranty, express or implied, is made as to their accuracy or completeness. Neither Scotiabank nor any of its officers, directors, partners, employees or affiliates accepts any liability whatsoever for any direct or consequential loss arising from any use of this report or its contents.
These reports are provided to you for informational purposes only. This report is not, and is not constructed as, an offer to sell or solicitation of any offer to buy any financial instrument, nor shall this report be construed as an opinion as to whether you should enter into any swap or trading strategy involving a swap or any other transaction. The information contained in this report is not intended to be, and does not constitute, a recommendation of a swap or trading strategy involving a swap within the meaning of U.S. Commodity Futures Trading Commission Regulation 23.434 and Appendix A thereto. This material is not intended to be individually tailored to your needs or characteristics and should not be viewed as a “call to action” or suggestion that you enter into a swap or trading strategy involving a swap or any other transaction. Scotiabank may engage in transactions in a manner inconsistent with the views discussed this report and may have positions, or be in the process of acquiring or disposing of positions, referred to in this report.
Scotiabank, its affiliates and any of their respective officers, directors and employees may from time to time take positions in currencies, act as managers, co-managers or underwriters of a public offering or act as principals or agents, deal in, own or act as market makers or advisors, brokers or commercial and/or investment bankers in relation to securities or related derivatives. As a result of these actions, Scotiabank may receive remuneration. All Scotiabank products and services are subject to the terms of applicable agreements and local regulations. Officers, directors and employees of Scotiabank and its affiliates may serve as directors of corporations.
Any securities discussed in this report may not be suitable for all investors. Scotiabank recommends that investors independently evaluate any issuer and security discussed in this report, and consult with any advisors they deem necessary prior to making any investment.
This report and all information, opinions and conclusions contained in it are protected by copyright. This information may not be reproduced without the prior express written consent of Scotiabank.
™ Trademark of The Bank of Nova Scotia. Used under license, where applicable.
Scotiabank, together with “Global Banking and Markets”, is a marketing name for the global corporate and investment banking and capital markets businesses of The Bank of Nova Scotia and certain of its affiliates in the countries where they operate, including; Scotiabank Europe plc; Scotiabank (Ireland) Designated Activity Company; Scotiabank Inverlat S.A., Institución de Banca Múltiple, Grupo Financiero Scotiabank Inverlat, Scotia Inverlat Casa de Bolsa, S.A. de C.V., Grupo Financiero Scotiabank Inverlat, Scotia Inverlat Derivados S.A. de C.V. – all members of the Scotiabank group and authorized users of the Scotiabank mark. The Bank of Nova Scotia is incorporated in Canada with limited liability and is authorised and regulated by the Office of the Superintendent of Financial Institutions Canada. The Bank of Nova Scotia is authorized by the UK Prudential Regulation Authority and is subject to regulation by the UK Financial Conduct Authority and limited regulation by the UK Prudential Regulation Authority. Details about the extent of The Bank of Nova Scotia's regulation by the UK Prudential Regulation Authority are available from us on request. Scotiabank Europe plc is authorized by the UK Prudential Regulation Authority and regulated by the UK Financial Conduct Authority and the UK Prudential Regulation Authority.
Scotiabank Inverlat, S.A., Scotia Inverlat Casa de Bolsa, S.A. de C.V, Grupo Financiero Scotiabank Inverlat, and Scotia Inverlat Derivados, S.A. de C.V., are each authorized and regulated by the Mexican financial authorities.
Not all products and services are offered in all jurisdictions. Services described are available in jurisdictions where permitted by law.