- Rates and the dollar shook off much of the initially dovish response...
- ...to another hot core inflation gauge
- US CPI / core CPI, m/m SA, May:
- Actual: 0.1 / 0.4
- Scotia: 0.3 / 0.4
- Consensus: 0.1 / 0.4
- Prior: 0.4 / 0.4
- US CPI / core CPI, y/y, May:
- Actual: 4.0 / 5.3
- Scotia: 4.3 / 5.3
- Consensus: 4.1 / 5.2
- Prior: 4.9 / 5.5
US core CPI put in another hot showing that remains unacceptably high and sticky in relation to the Federal Reserve’s goals. Core goods price inflation has definitely returned while core service price inflation remains sticky.
Markets reacted by initially putting a bid to the US front-end before reversing all of that move and then some, by driving an initially softer dollar on a DXY basis before reining in much of that, and by pushing the S&P500 up by another 1.6% which is holding. There is next to nothing priced for tomorrow’s FOMC decision hence the no-surprises Powell probably won’t surprise anyone, rightly or wrongly.
The fact that the initial reaction either reversed or was reined in across rates and the dollar may lean toward the argument that the initial reaction was a positioning issue with markets positioned for an even hotter number than the hot number that we got, or they were looking at year-over-year readings before more serious inflation watchers dug deeper, or they initially repeated the same thing they did after the prior reading by focusing upon what Powell unfortunately trained them to look at. Whatever the reason, this was a much hotter report than indicated by just a glance at the market reaction.
If the Fed pauses tomorrow, then it certainly won’t be because the latest CPI print was soft. Or that the US job market is cooling (it isn’t, reminder here). It would only be if the FOMC wishes to take a breather and test the theory that they’ve done enough by pushing into restrictive territory and now is the time to gamble on whether they have, which time and data will inform. If they’re right, wonderful. If not, then they may never contain inflationary pressures.
DETAILS
First off, don’t be fooled by the instant media headlines that inflation cooled which dominated the popular coverage. The year-over-year rate did indeed ebb by a tick more than expected to 4% y/y (4.1% consensus, 4.9% prior) with core CPI ebbing a bit less than expected to 5.3% y/y (5.2% consensus, 5.5% prior). Who cares. You see, there’s this thing called base effects and the whole narrative around why what happens in relation to last year’s price levels is moot.
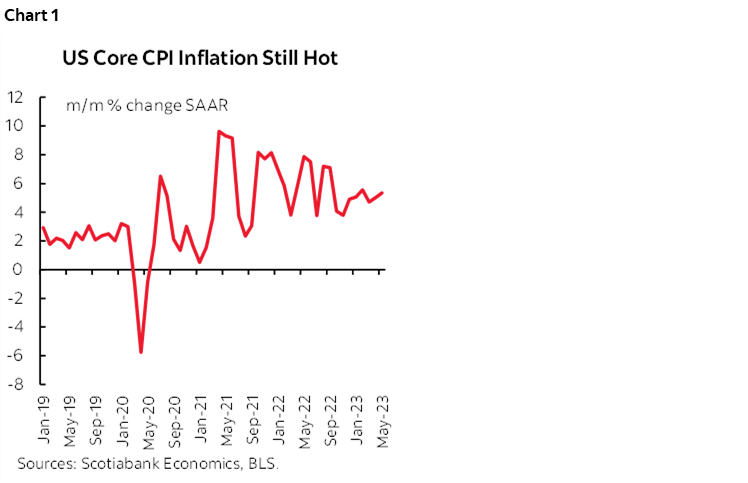
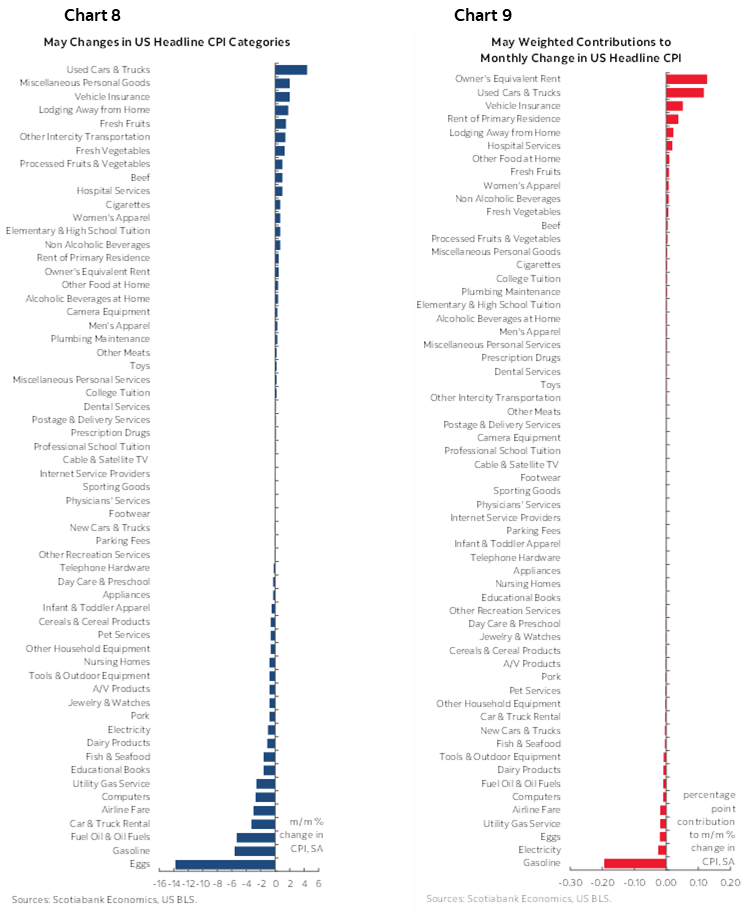
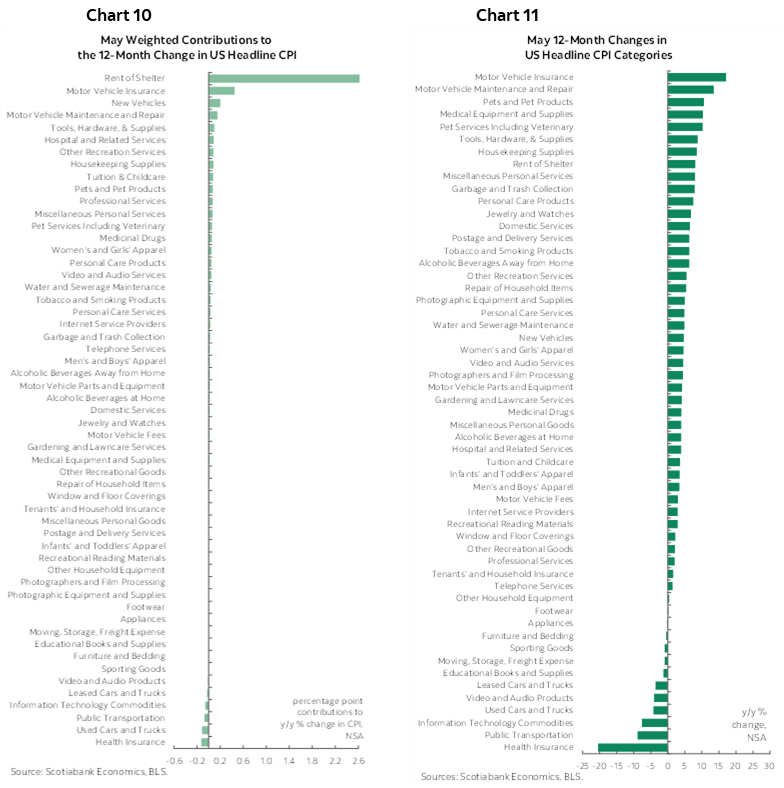
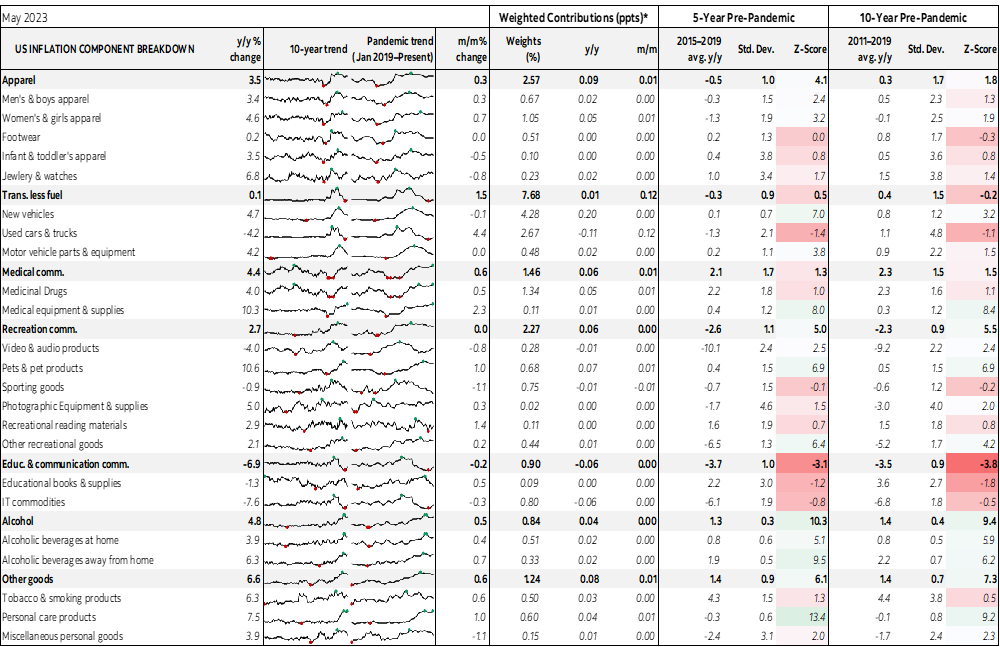
Inflationary pressures at the margin did not ease and that’s what matters. Core CPI was up 0.4% m/m, matching expectations. At a month-over-month, seasonally adjusted and annualized rate, this equates to 5.4% which is faster than the prior month’s 5% clip, faster than the 4.7% gain in March and the hottest reading since the 5.6% increase in February. That’s not slowing, as chart 1 demonstrates. Core CPI has been up 0.4% m/m in five out of the past six months. The other month (February) was up 0.5%. These are not cool readings. They are not getting better. They indicate high persistence.
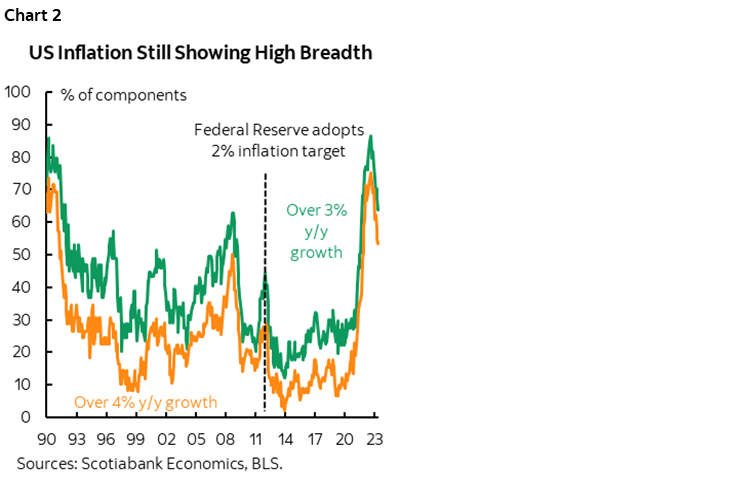
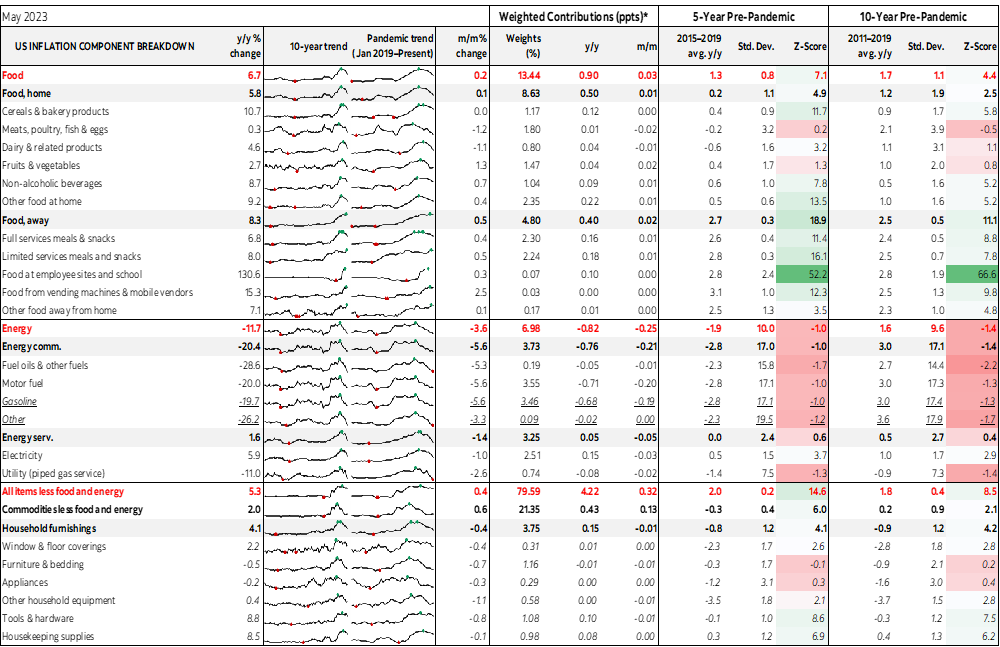
Further, the breadth is improving, but is still very high (chart 2).
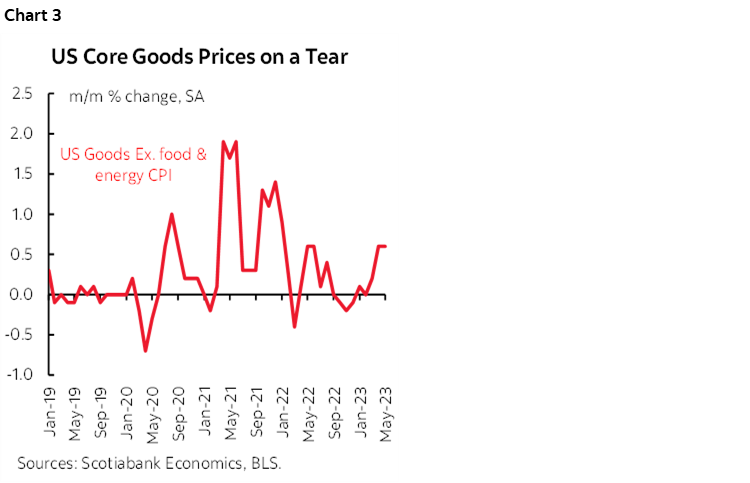
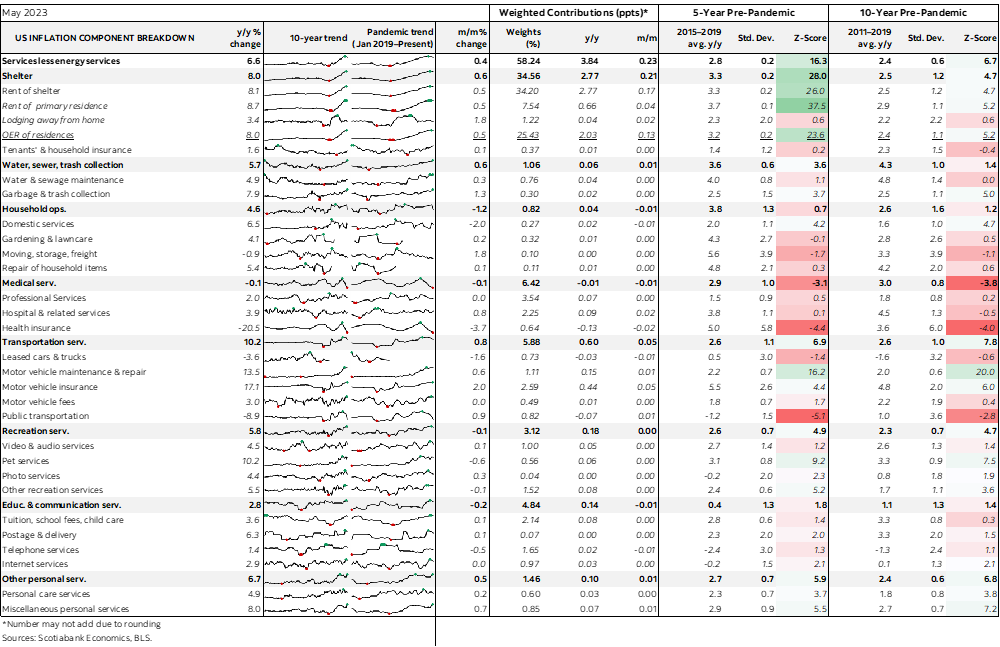
For one thing, just when everyone was convinced that supply chains had improved on the goods side of the picture and that this would keep inflation pointed lower, goods price inflation has rebounded (chart 3). Core goods prices ex-food and energy were up by 0.6% m/m SA nonannualized for the second straight month. Even taking used vehicles out would have still left a rise of 0.5% m/m in core goods prices. Just when Powell trained everyone to obsess over core services, whammo, core goods inflation is definitely back.
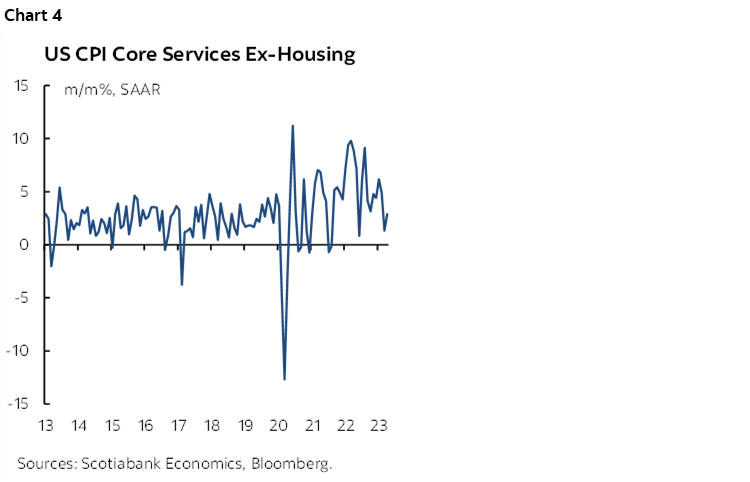
Core services ex-housing CPI was up 0.24% m/m or 2.9% m/m SAAR (chart 4). That measure has cooled to still-above target rates, but there may be a substitution effect toward firmer goods prices. Recall that the prior soft core services CPI did not translate well into PCE core services.
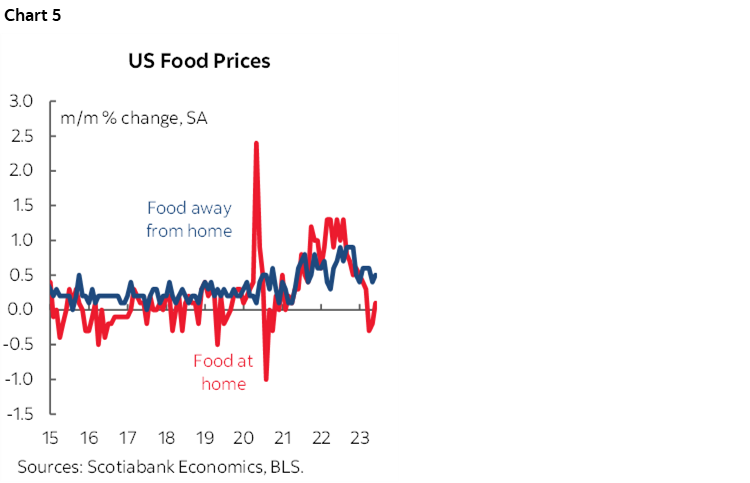
Across the details, food was up 0.2% m/m. Grocery prices ("at home food”) were up 0.1%. “Food away from home” which includes take-out, cafeterias etc, was up 0.5% m/m. Chart 5.
Energy prices fell 3.6% m/m SA and this was led by gasoline that was down 5.6% m/m SA as expected.
Clothing prices were up 0.3% m/m.
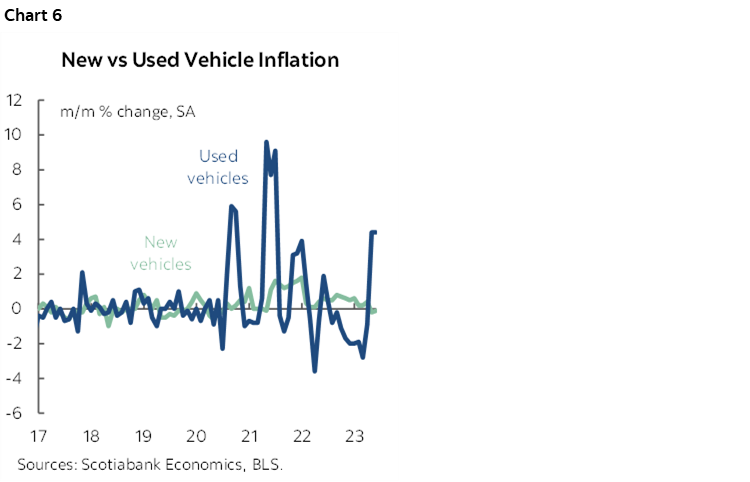
Used vehicle prices were up by +4.4% SA as expected (chart 6). New vehicles were little changed at -0.1% as largely expected and with zero weighted impact.
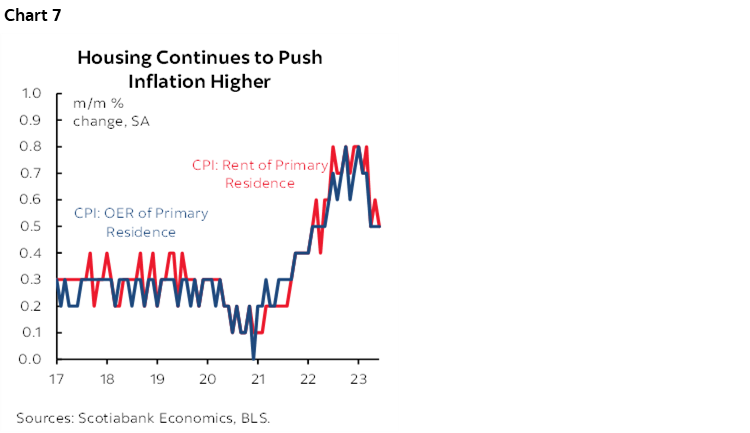
Owners’ equivalent rent was up 0.5% m/m SA as the lagging downward effects of market rents are still ahead (chart 7).
On the travel and hospitality side, airfare fell by -3% m/m. Lodging was up 1.8% m/m. Intercity transportation was up 1.4%. Vehicle rental prices fell -3.3%. More details are in the appendix.
LAGGING EFFECTS?
Is inflation—properly defined in m/m SAAR terms—assured of durably landing on target given lagged effects of policy rate to date? There are three uncertainties here. For one thing, the lags are longer than often portrayed by pointing to the start of administered policy rate hikes in March of last year because bond markets began tightening over 20 months ago and yet inflation and multiple growth signals including job markets remain highly resilient. It’s also possible that R* is higher today, that today’s inflation drivers are very different and persistent (ie: more structural) and that today’s different growth drivers may be different (more resilience).
DISCLAIMER
This report has been prepared by Scotiabank Economics as a resource for the clients of Scotiabank. Opinions, estimates and projections contained herein are our own as of the date hereof and are subject to change without notice. The information and opinions contained herein have been compiled or arrived at from sources believed reliable but no representation or warranty, express or implied, is made as to their accuracy or completeness. Neither Scotiabank nor any of its officers, directors, partners, employees or affiliates accepts any liability whatsoever for any direct or consequential loss arising from any use of this report or its contents.
These reports are provided to you for informational purposes only. This report is not, and is not constructed as, an offer to sell or solicitation of any offer to buy any financial instrument, nor shall this report be construed as an opinion as to whether you should enter into any swap or trading strategy involving a swap or any other transaction. The information contained in this report is not intended to be, and does not constitute, a recommendation of a swap or trading strategy involving a swap within the meaning of U.S. Commodity Futures Trading Commission Regulation 23.434 and Appendix A thereto. This material is not intended to be individually tailored to your needs or characteristics and should not be viewed as a “call to action” or suggestion that you enter into a swap or trading strategy involving a swap or any other transaction. Scotiabank may engage in transactions in a manner inconsistent with the views discussed this report and may have positions, or be in the process of acquiring or disposing of positions, referred to in this report.
Scotiabank, its affiliates and any of their respective officers, directors and employees may from time to time take positions in currencies, act as managers, co-managers or underwriters of a public offering or act as principals or agents, deal in, own or act as market makers or advisors, brokers or commercial and/or investment bankers in relation to securities or related derivatives. As a result of these actions, Scotiabank may receive remuneration. All Scotiabank products and services are subject to the terms of applicable agreements and local regulations. Officers, directors and employees of Scotiabank and its affiliates may serve as directors of corporations.
Any securities discussed in this report may not be suitable for all investors. Scotiabank recommends that investors independently evaluate any issuer and security discussed in this report, and consult with any advisors they deem necessary prior to making any investment.
This report and all information, opinions and conclusions contained in it are protected by copyright. This information may not be reproduced without the prior express written consent of Scotiabank.
™ Trademark of The Bank of Nova Scotia. Used under license, where applicable.
Scotiabank, together with “Global Banking and Markets”, is a marketing name for the global corporate and investment banking and capital markets businesses of The Bank of Nova Scotia and certain of its affiliates in the countries where they operate, including; Scotiabank Europe plc; Scotiabank (Ireland) Designated Activity Company; Scotiabank Inverlat S.A., Institución de Banca Múltiple, Grupo Financiero Scotiabank Inverlat, Scotia Inverlat Casa de Bolsa, S.A. de C.V., Grupo Financiero Scotiabank Inverlat, Scotia Inverlat Derivados S.A. de C.V. – all members of the Scotiabank group and authorized users of the Scotiabank mark. The Bank of Nova Scotia is incorporated in Canada with limited liability and is authorised and regulated by the Office of the Superintendent of Financial Institutions Canada. The Bank of Nova Scotia is authorized by the UK Prudential Regulation Authority and is subject to regulation by the UK Financial Conduct Authority and limited regulation by the UK Prudential Regulation Authority. Details about the extent of The Bank of Nova Scotia's regulation by the UK Prudential Regulation Authority are available from us on request. Scotiabank Europe plc is authorized by the UK Prudential Regulation Authority and regulated by the UK Financial Conduct Authority and the UK Prudential Regulation Authority.
Scotiabank Inverlat, S.A., Scotia Inverlat Casa de Bolsa, S.A. de C.V, Grupo Financiero Scotiabank Inverlat, and Scotia Inverlat Derivados, S.A. de C.V., are each authorized and regulated by the Mexican financial authorities.
Not all products and services are offered in all jurisdictions. Services described are available in jurisdictions where permitted by law.