- Canada’s job market is on fire, unemployment falling
- Canadian employment is rising faster than the US
- Bank of Canada on a long hold, markets catching onto our hike call
- Canadian jobs m/m 000s / UR %, SA, November:
- Actual: 53.6 / 6.5
- Scotia: -15 / 7.0
- Consensus: -2.5 / 7.0
- Prior: 66.6 / 6.9
A stunningly resilient Canadian job market gives the Canadian side more cause to be confident at the negotiating table with the Trump administration. Markets reacted to the latest reading by driving short-term yields massively higher (2s +17bps) and with a BoC hike now priced for next September/October in keeping with our +50bps call for 2026H2.
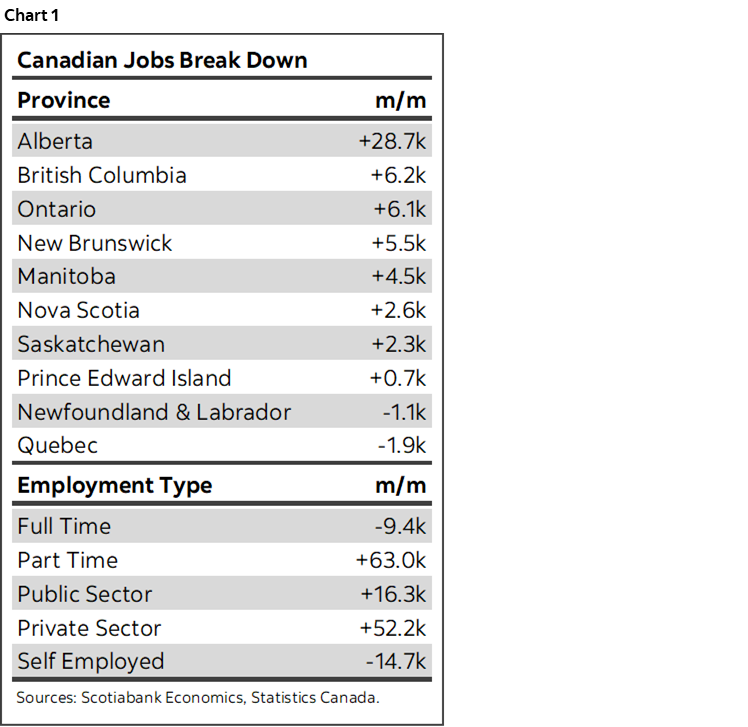
Another 54k jobs were created last month. Some details are in chart 1. The string of three strong gains in a row totals about 181,000 jobs created in just three months. At an annualized pace we’re talking about 725k which this country has only seen in two other years since the inception of the Labour Force Survey in the 1970s —2021 and 2022 coming out of the pandemic which was recovering from the nearly million jobs lost.
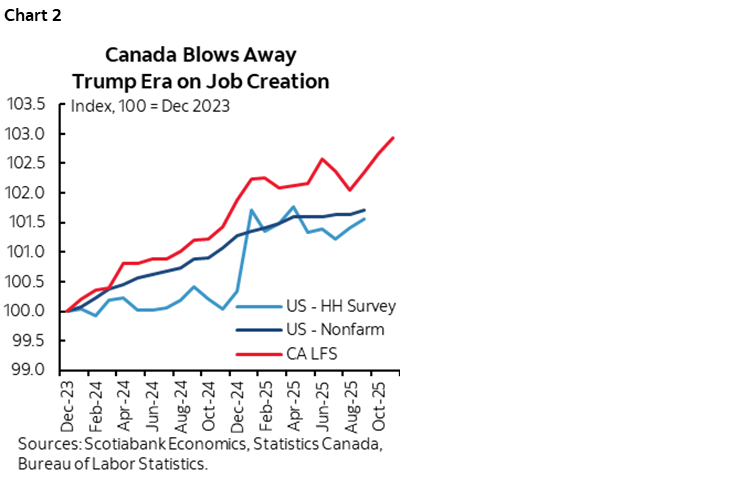
If protectionism is benefiting the US, then someone forgot to tell employers (chart 2). Canadian jobs have been outperforming US jobs throughout the past couple of years during which uncertainty began to rise into the Presidential election and during the first year of Trump’s term in office. US jobs numbers are held back by the government shutdown, but even when we get them the divergence is likely to stay in place—or worsen. If Q3 is any indication, then the US productivity advantage may no longer be as acute given the roughly 3¾% q/q SAAR surge of Canadian labour productivity in Q3.
Details Were Mixed, but BoC Will Look at the Trend
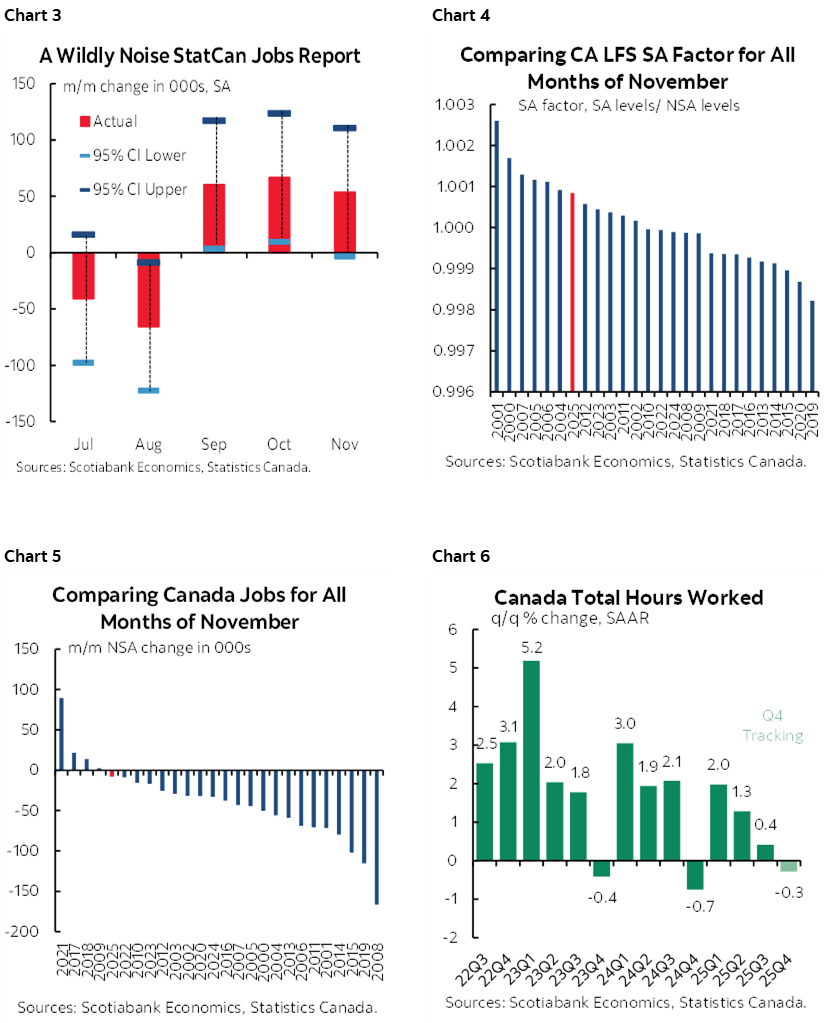
The charts on the following page provide more details. Note the one showing that despite this being a very statistically noisy survey with wide confidence bands, we can’t dismiss three months of strong gains. Each report might have been weaker than the reported gain. Each report might have also been a lot stronger than the reported gain.
All private payrolls were up by +52.2k as public sector payrolls grew by about +16k and self-employed jobs fell by -14.7k.
Services added +43k jobs, goods +11k. Goods were led by resources +11k, as manufacturing lost 9k but is still up by 91k in the past three months.
Services employment was led by health care and social assistance +45.5k, info/culture/rec +11k, and accommodation and food services +14.2k.
Part-time employment was up by +63k as full time jobs slipped by -9k. Still, over the three months in which total jobs have surged, full-time jobs are up by 78k with part-time up 103k. Given the massive statistical noise in the report I think the BoC would look at that trend as reasonably balanced between full-time and part-time jobs.
The unemployment rate fell four-tenths to 6.5% as the workforce shrank by 25.7k in addition to the effects of job growth. The workforce shrank despite population up 18k.
Hours worked were up quite strong (+0.4% m/m SA). That’s good for November GDP given GDP is an identity with hours times productivity. Hours are tracking little change in Q4 overall (-0.3% q/q SAAR). That's a drag on Q4 GDP all else equal in terms of productivity which is too early to assess for Q4.
Wages fell -0.8% m/m SAAR but after a massive 9.3% prior gain so that’s not surprising.
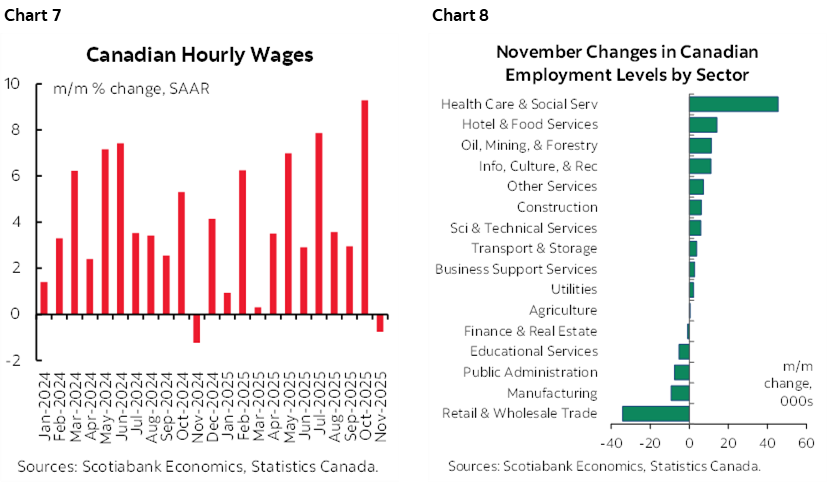
The SA factor is migrating higher but seasonally unadjusted jobs were stronger than usual.
All of the job gain in November was across youths with the 15–24 age category gaining 50k as 25+ jobs were flat (+3.9k). That’s good for youths, but not so much for the folks with the bigger bills to pay. And yet look at the trend. In the past three months during which total jobs have surged, youths are up 66k, men 25+ are up 62k and women 25+ are up 53k. That’s very well balanced across demographic groups.
In a bigger picture sense, all of this feeds the sense the BoC is on a prolonged hold and the next move is up. 50bps of hikes over 2026H2 has been our forecast for a while now and I'm starting to think of an earlier hike than late next year. Ripping jobs. Less slack than previously estimated due to GDP revisions. Wage settlements are still going strong in a very different job market than stateside with so many unionized workers striking 4–5 year contracts with make-up pay gains well above 2% inflation. Fiscal stimulus. CAD depreciation offsets the pretty small tariff hit to date. Services resilience in the nontradeables sector.
Yes there are plenty of risks next year, but there is already an insurance premium built into the present policy rate. Almost any variation of a Taylor Rule that I run for Canada shows that the policy rate should be higher than it is at present. The real policy rate is around zero and at the bottom end of most estimates of the neutral rate range.
DISCLAIMER
This report has been prepared by Scotiabank Economics as a resource for the clients of Scotiabank. Opinions, estimates and projections contained herein are our own as of the date hereof and are subject to change without notice. The information and opinions contained herein have been compiled or arrived at from sources believed reliable but no representation or warranty, express or implied, is made as to their accuracy or completeness. Neither Scotiabank nor any of its officers, directors, partners, employees or affiliates accepts any liability whatsoever for any direct or consequential loss arising from any use of this report or its contents.
These reports are provided to you for informational purposes only. This report is not, and is not constructed as, an offer to sell or solicitation of any offer to buy any financial instrument, nor shall this report be construed as an opinion as to whether you should enter into any swap or trading strategy involving a swap or any other transaction. The information contained in this report is not intended to be, and does not constitute, a recommendation of a swap or trading strategy involving a swap within the meaning of U.S. Commodity Futures Trading Commission Regulation 23.434 and Appendix A thereto. This material is not intended to be individually tailored to your needs or characteristics and should not be viewed as a “call to action” or suggestion that you enter into a swap or trading strategy involving a swap or any other transaction. Scotiabank may engage in transactions in a manner inconsistent with the views discussed this report and may have positions, or be in the process of acquiring or disposing of positions, referred to in this report.
Scotiabank, its affiliates and any of their respective officers, directors and employees may from time to time take positions in currencies, act as managers, co-managers or underwriters of a public offering or act as principals or agents, deal in, own or act as market makers or advisors, brokers or commercial and/or investment bankers in relation to securities or related derivatives. As a result of these actions, Scotiabank may receive remuneration. All Scotiabank products and services are subject to the terms of applicable agreements and local regulations. Officers, directors and employees of Scotiabank and its affiliates may serve as directors of corporations.
Any securities discussed in this report may not be suitable for all investors. Scotiabank recommends that investors independently evaluate any issuer and security discussed in this report, and consult with any advisors they deem necessary prior to making any investment.
This report and all information, opinions and conclusions contained in it are protected by copyright. This information may not be reproduced without the prior express written consent of Scotiabank.
™ Trademark of The Bank of Nova Scotia. Used under license, where applicable.
Scotiabank, together with “Global Banking and Markets”, is a marketing name for the global corporate and investment banking and capital markets businesses of The Bank of Nova Scotia and certain of its affiliates in the countries where they operate, including; Scotiabank Europe plc; Scotiabank (Ireland) Designated Activity Company; Scotiabank Inverlat S.A., Institución de Banca Múltiple, Grupo Financiero Scotiabank Inverlat, Scotia Inverlat Casa de Bolsa, S.A. de C.V., Grupo Financiero Scotiabank Inverlat, Scotia Inverlat Derivados S.A. de C.V. – all members of the Scotiabank group and authorized users of the Scotiabank mark. The Bank of Nova Scotia is incorporated in Canada with limited liability and is authorised and regulated by the Office of the Superintendent of Financial Institutions Canada. The Bank of Nova Scotia is authorized by the UK Prudential Regulation Authority and is subject to regulation by the UK Financial Conduct Authority and limited regulation by the UK Prudential Regulation Authority. Details about the extent of The Bank of Nova Scotia's regulation by the UK Prudential Regulation Authority are available from us on request. Scotiabank Europe plc is authorized by the UK Prudential Regulation Authority and regulated by the UK Financial Conduct Authority and the UK Prudential Regulation Authority.
Scotiabank Inverlat, S.A., Scotia Inverlat Casa de Bolsa, S.A. de C.V, Grupo Financiero Scotiabank Inverlat, and Scotia Inverlat Derivados, S.A. de C.V., are each authorized and regulated by the Mexican financial authorities.
Not all products and services are offered in all jurisdictions. Services described are available in jurisdictions where permitted by law.