- SCOTUS strikes down IEEPA tariffs
- What’s next is highly uncertain for refunds and alternative measures
- US GDP disappointed and not just on shutdown effects…
- ...as income growth vapourizes and core PCE inflation spiked higher
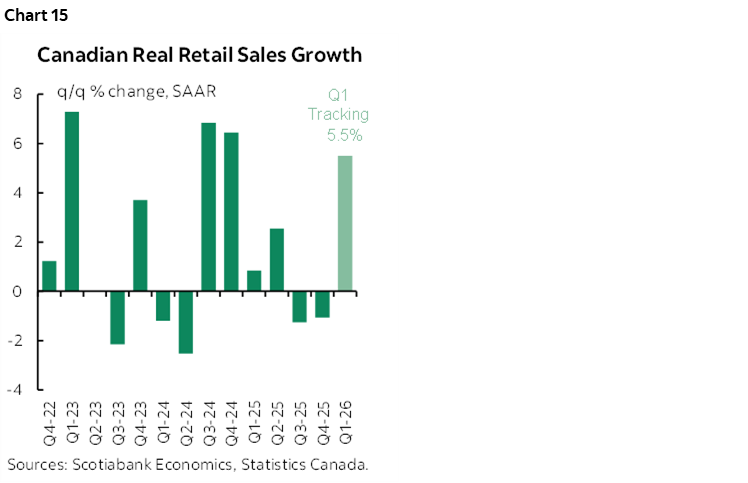
- Canadian retail sales surged into 2026…
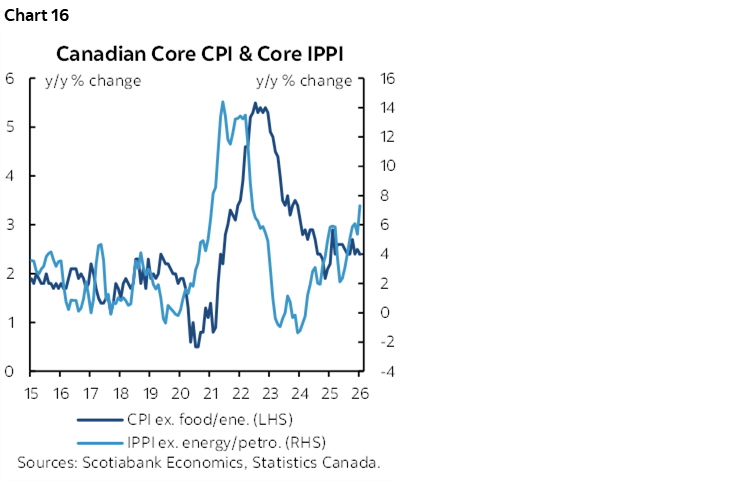
- ...as higher producer prices point to lagging upside risk to core CPI inflation
- Markets await next steps as uncertainty spikes higher
President Trump has had better days. The double blow of the tariff decision and disappointing GDP growth was a part of a deluge of new information that also included higher US inflation and weakening US consumer income growth. Also note that Canadian consumer spending was strong and inflation signals escalated.
Throughout it all markets were volatile but unsure of the correct direction to take. US 2s were little changed throughout it all. Ditto for stocks that fell at first and then rebounded. The dollar is broadly softer.
SCOTUS STRIKES DOWN IEEPA TARIFFS
The Supreme Court struck down President Trump’s signature IEEPA tariffs in a 6–3 vote. I’m stunned by the timing given Trump’s SOTU speech on Tuesday which will no doubt lash out at the justices as they sit before him in Congress. Perhaps the Court bravely wished to make a point of its independence from the executive branch.
Chief Justice Roberts explained the decision as follows:
"The President asserts the extraordinary power to unilaterally impose tariffs of unlimited amount, duration, and scope. In light of the breadth, history, and constitutional context of that asserted authority, he must identify clear congressional authorization to exercise it.”
The clear message is that Trump must go through Congress instead of bypassing it by executive orders.
Among the dissenters—Kavanaugh, Thomas and Alito—one concern was that the issue of refunds could be messy and complicated to handle. The decision threw what to do about this back to the lower courts and offered no guidance, though it may wind up back at SCOTUS one day. And yet while I’m no lawyer, using this as the rationale to dissent—as Kavanaugh did—strikes me as akin to excusing someone from a murder charge because the victim can’t be brought back. Deal with the issue at hand first, the remedies after.
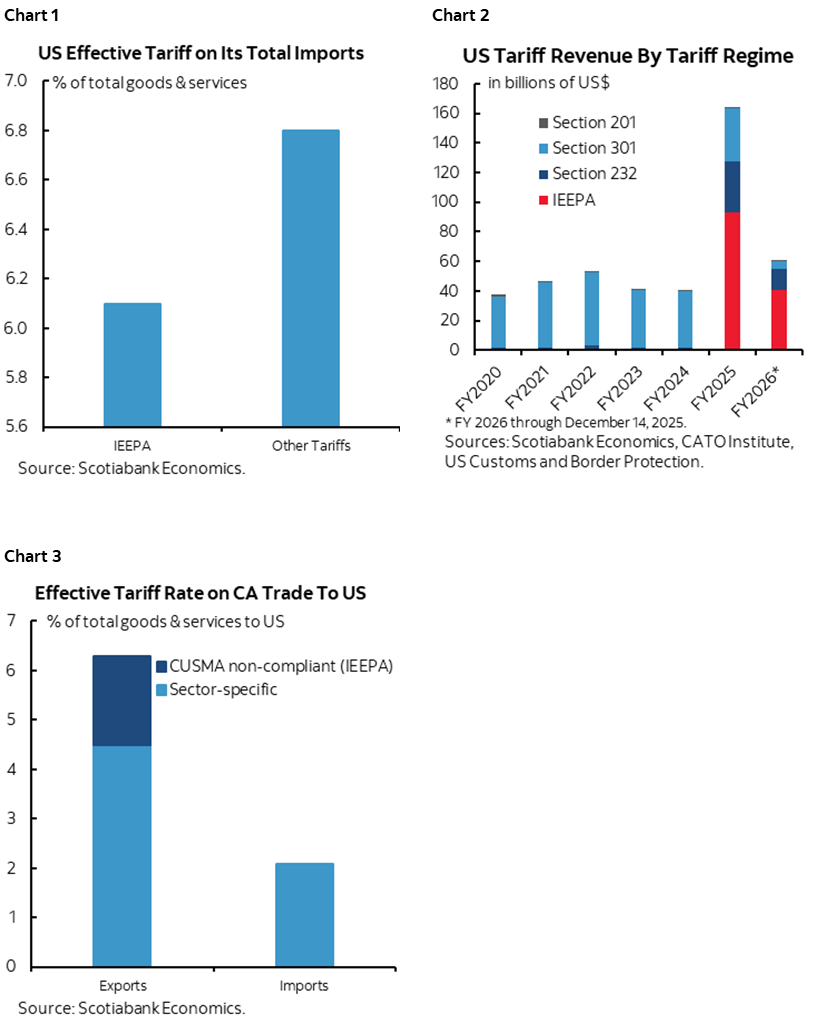
What impact will this carry? Chart 1 shows the average effective tariff rates on US imports imposed by the Trump administration broken down by IEEPA tariffs and the other tariffs. Just under half of the 12.9% effective tariff rate on all US imports is attributed to IEEPA tariffs. Chart 2 shows the yearly breakdown of US tariff revenues by tariff tool. Chart 3 shows the IEEPA share of the tariffs imposed on Canadian exports to the US (ie: the so-called ‘fentanyl’ tariffs).
Those charts lay out what is at stake, but chart 4 shows the alternative tariff methods that Trump can pivot toward and he has already repeated his intention to do so in the wake of the decision but without any details. They are less flexible, involve caps and more steps, but they have already been widely used particularly in the case of specific sectors.
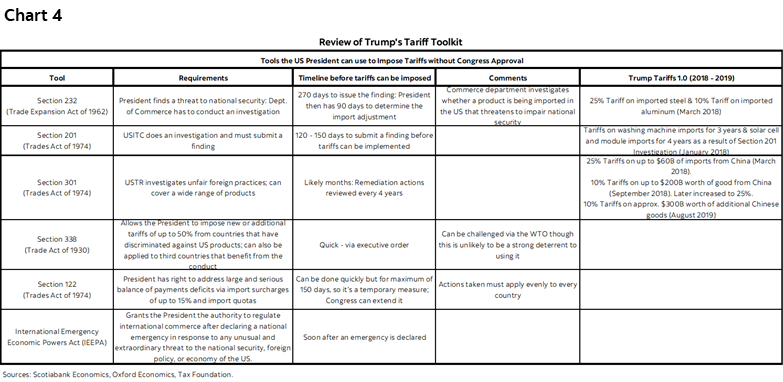
Regardless, we’re now in a more uncertain phase in terms of what lies next. What happens to potential refunds of IEEPA tariffs. How will this impact the Treasury. What other measures will be announced and when. Multiple sectors could be faced with elevated announcement risk until we find out what the administration plans to do next.
Furthermore, there remains the other Trump v. V.O.S. Selections, Inc. case that SCOTUS has not decided upon yet. That could come Tuesday or Wednesday on the next scheduled opinion days for the court.
All of this uncertainty is probably why the broad reaction across stocks and bonds was de minimis thus far.
US GDP DISAPPOINTS
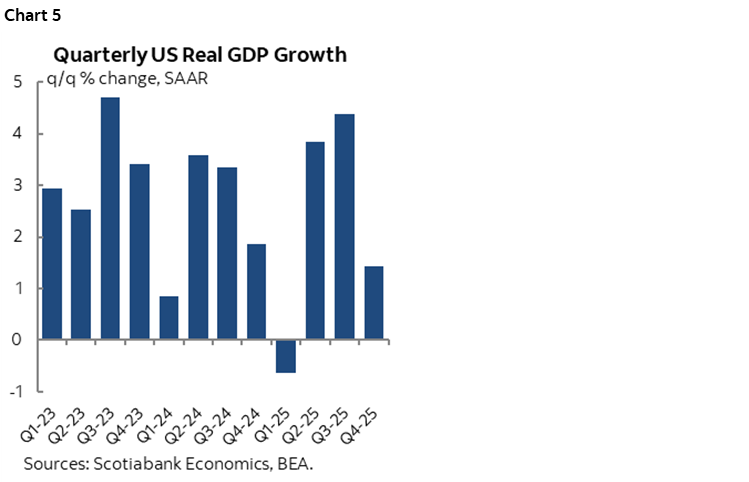
US GDP growth disappointed almost everyone’s expectations. Q4 grew by just 1.4% q/q SAAR which was half of consensus. It’s the slowest growth since 2025Q1 (chart 5).
Why? Chart 6 shows the weighted contributions to growth. Government spending knocked a weighted 0.9 ppts off of Q4 GDP.
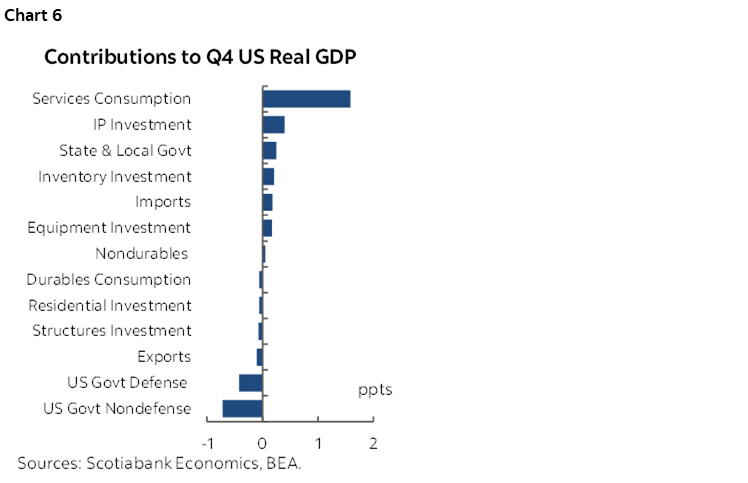
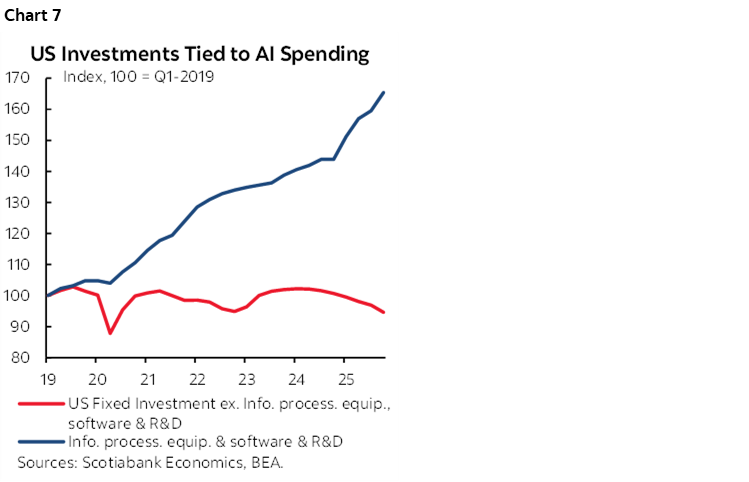
Investment contributed 0.45 ppts to Q4 GDP growth. All of that came through nonresidential investment as residential investment was a minor –0.1 drag with rounding up. Within nonresidential investment, equipment spending accounted for 0.2 ppts of GDP growth and the category labelled intellectual property products which includes software and R&D etc contributed 0.4 ppts. Further, all of the growth in investment was through AI-related investments; ex-AI, investment fell again which is quite unusual for an economy in excess aggregate demand and a positive output gap (chart 7).
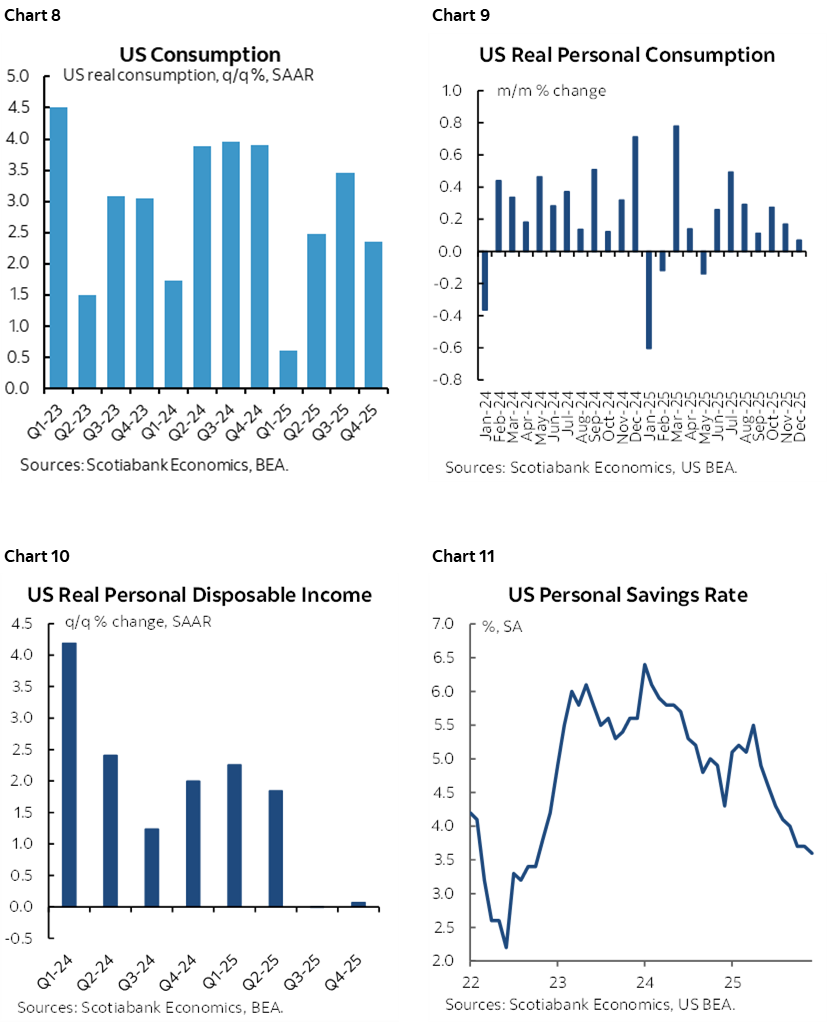
Consumption added 1.6 ppts which was lower than the nearly 2% being tracked before we got this morning’s consumer spending figures for December including negative revisions. All of that 1.6 ppt contribution from consumption came through services spending with no contribution to GDP growth from what consumers spent on goods. The latter point had high breadth to the weakness as neither consumer spending on big ticket durable goods (autos, appliances etc) nor spending on nondurables (food, clothing etc) contributed anything to GDP growth.
What is disconcerting on the consumption side is shown in charts 8–11. Consumption growth was slower than the prior two quarters but nevertheless solid in Q4 but the monthly changes show that it was front-loaded at the beginning of the quarter with early holiday sales. Momentum was lost as the quarter progressed. The chart showing income growth have completely stalled out in Q3 and Q4 explains the erosion of the nominal personal saving rate that in inflation-adjusted terms is approaching around just 1%. As income growth and job growth ex-health hiring are getting vapourized while the wealth effect from housing remains negative, the durability of solid consumption growth remains in doubt into 2026. See my weekly from this past week that addresses the net effects of tariff tax hikes against income tax refunds here.
Inventories added 0.2% to Q4 GDP growth.
Net exports added just 0.1% to Q4 GDP growth with rounding up. That was driven by lower imports (ie: less of a GDP leakage effect) that added 0.2 ppts to growth as exports were a non-factor by subtracting –0.1 ppts.
As for the effects of the government shutdown President Trump’s claim that growth would have been two percentage points higher if not for the shutdown is a tough pill to swallow. Government spending dragged 0.9 ppts off Q4 GDP growth as federal spending knocked 1.15% off growth but state and local governments added 0.25%.
We also have this guidance on the shutdown effects from the BEA that basically says among the things they can measure they figure the shutdown cost about 1 ppt of GDP growth:
“Due to a lapse in appropriations, some federal government agencies were closed, and some employees were furloughed from October 1 through November 12. The full effects of the partial federal government shutdown on the fourth-quarter estimates cannot be quantified because they are embedded in the regular source data that underlie the estimates and cannot be separately identified. However, BEA did estimate the effects of a reduction in the labor services supplied by federal employees. BEA estimates that this reduction in services provided by the federal government subtracted about 1.0 percentage point from real GDP growth in the fourth quarter. Because furloughed federal employees received back pay, the shutdown had no impact on current-dollar federal compensation and was reflected as a temporary increase in the prices paid for federal employee compensation. For more information, an FAQ is available on BEA’s website.”
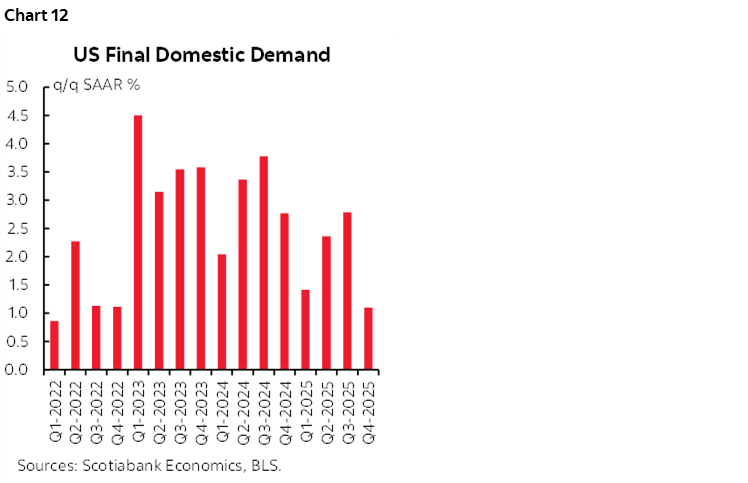
Final domestic demand—a barometer of the domestic economy that adds consumption, investment and government spending and excludes net trade and inventories—grew by 1.1% q/q SAAR in Q4 (chart 12). That’s the weakest since 2022Q1. If we added back the drag from government spending in the shutdown then that would leave FDD up by about 2% which would be the weakest since 2025Q1.
US INFLATION SPIKES HIGHER
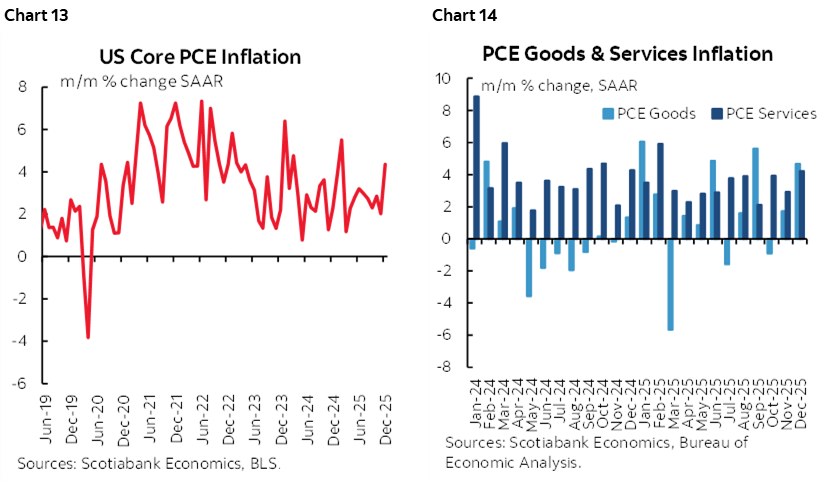
The FOMC’s hawkish inflation stance was vindicated—at least for now—by the spike in core PCE inflation during December (chart 13). Core services ex-housing inflation helped to drive that increase but there was also a strong increase in goods inflation (chart 14).
CANADIAN RETAIL SALES SURGED HIGHER INTO 2026
Retail sales surprised higher than expected. That’s because flash guidance for January’s reading was +1.5% m/m SA while the –0.4% m/m SA reading for December was little revised from previously known –0.5% guidance.
This leaves Q4 tracking a drip in sales volumes but a large gain somewhere in the 5–6% q/q SAAR range assuming not all of the 1.5% nominal jump in January was driven by higher volumes. It’s early, but that could be the strongest quarterly growth in retail sales volumes since 2024Q4 (chart 15). Cautions include the fact much of that may have been driven by a jump in auto sales and we don’t have details with the flash estimate. It could also be revised, but either higher or lower. We also don’t know the split between volumes and prices.
CANADIAN INFLATION FACES UPSIDE RISK FROM PRODUCER PRICES
Finally, another warning shot on Canadian inflation came through producer prices. Industrial product prices were up by 2.7% m/m SA with raw materials prices up 7.7% m/m.
Chart 16 shows the connection between industrial product prices excluding energy prices and core CPI inflation. It’s coming, in lagging fashion.
DISCLAIMER
This report has been prepared by Scotiabank Economics as a resource for the clients of Scotiabank. Opinions, estimates and projections contained herein are our own as of the date hereof and are subject to change without notice. The information and opinions contained herein have been compiled or arrived at from sources believed reliable but no representation or warranty, express or implied, is made as to their accuracy or completeness. Neither Scotiabank nor any of its officers, directors, partners, employees or affiliates accepts any liability whatsoever for any direct or consequential loss arising from any use of this report or its contents.
These reports are provided to you for informational purposes only. This report is not, and is not constructed as, an offer to sell or solicitation of any offer to buy any financial instrument, nor shall this report be construed as an opinion as to whether you should enter into any swap or trading strategy involving a swap or any other transaction. The information contained in this report is not intended to be, and does not constitute, a recommendation of a swap or trading strategy involving a swap within the meaning of U.S. Commodity Futures Trading Commission Regulation 23.434 and Appendix A thereto. This material is not intended to be individually tailored to your needs or characteristics and should not be viewed as a “call to action” or suggestion that you enter into a swap or trading strategy involving a swap or any other transaction. Scotiabank may engage in transactions in a manner inconsistent with the views discussed this report and may have positions, or be in the process of acquiring or disposing of positions, referred to in this report.
Scotiabank, its affiliates and any of their respective officers, directors and employees may from time to time take positions in currencies, act as managers, co-managers or underwriters of a public offering or act as principals or agents, deal in, own or act as market makers or advisors, brokers or commercial and/or investment bankers in relation to securities or related derivatives. As a result of these actions, Scotiabank may receive remuneration. All Scotiabank products and services are subject to the terms of applicable agreements and local regulations. Officers, directors and employees of Scotiabank and its affiliates may serve as directors of corporations.
Any securities discussed in this report may not be suitable for all investors. Scotiabank recommends that investors independently evaluate any issuer and security discussed in this report, and consult with any advisors they deem necessary prior to making any investment.
This report and all information, opinions and conclusions contained in it are protected by copyright. This information may not be reproduced without the prior express written consent of Scotiabank.
™ Trademark of The Bank of Nova Scotia. Used under license, where applicable.
Scotiabank, together with “Global Banking and Markets”, is a marketing name for the global corporate and investment banking and capital markets businesses of The Bank of Nova Scotia and certain of its affiliates in the countries where they operate, including; Scotiabank Europe plc; Scotiabank (Ireland) Designated Activity Company; Scotiabank Inverlat S.A., Institución de Banca Múltiple, Grupo Financiero Scotiabank Inverlat, Scotia Inverlat Casa de Bolsa, S.A. de C.V., Grupo Financiero Scotiabank Inverlat, Scotia Inverlat Derivados S.A. de C.V. – all members of the Scotiabank group and authorized users of the Scotiabank mark. The Bank of Nova Scotia is incorporated in Canada with limited liability and is authorised and regulated by the Office of the Superintendent of Financial Institutions Canada. The Bank of Nova Scotia is authorized by the UK Prudential Regulation Authority and is subject to regulation by the UK Financial Conduct Authority and limited regulation by the UK Prudential Regulation Authority. Details about the extent of The Bank of Nova Scotia's regulation by the UK Prudential Regulation Authority are available from us on request. Scotiabank Europe plc is authorized by the UK Prudential Regulation Authority and regulated by the UK Financial Conduct Authority and the UK Prudential Regulation Authority.
Scotiabank Inverlat, S.A., Scotia Inverlat Casa de Bolsa, S.A. de C.V, Grupo Financiero Scotiabank Inverlat, and Scotia Inverlat Derivados, S.A. de C.V., are each authorized and regulated by the Mexican financial authorities.
Not all products and services are offered in all jurisdictions. Services described are available in jurisdictions where permitted by law.