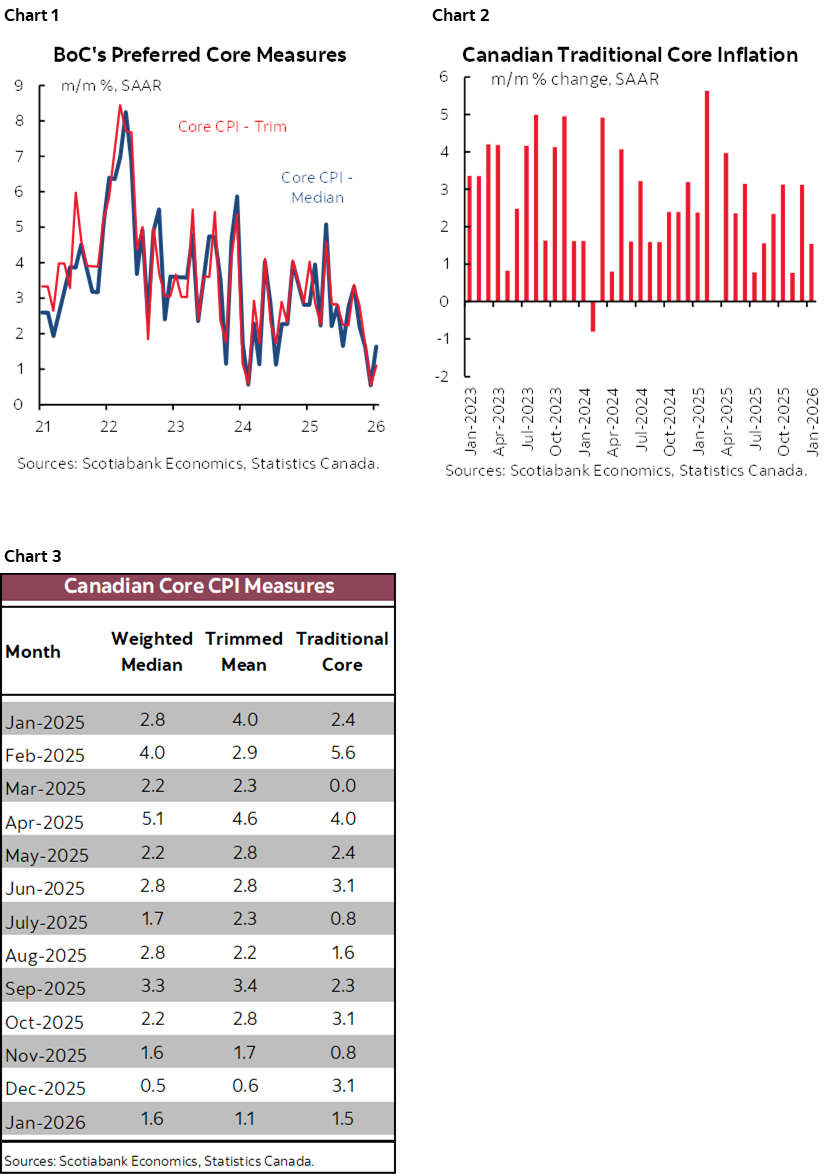
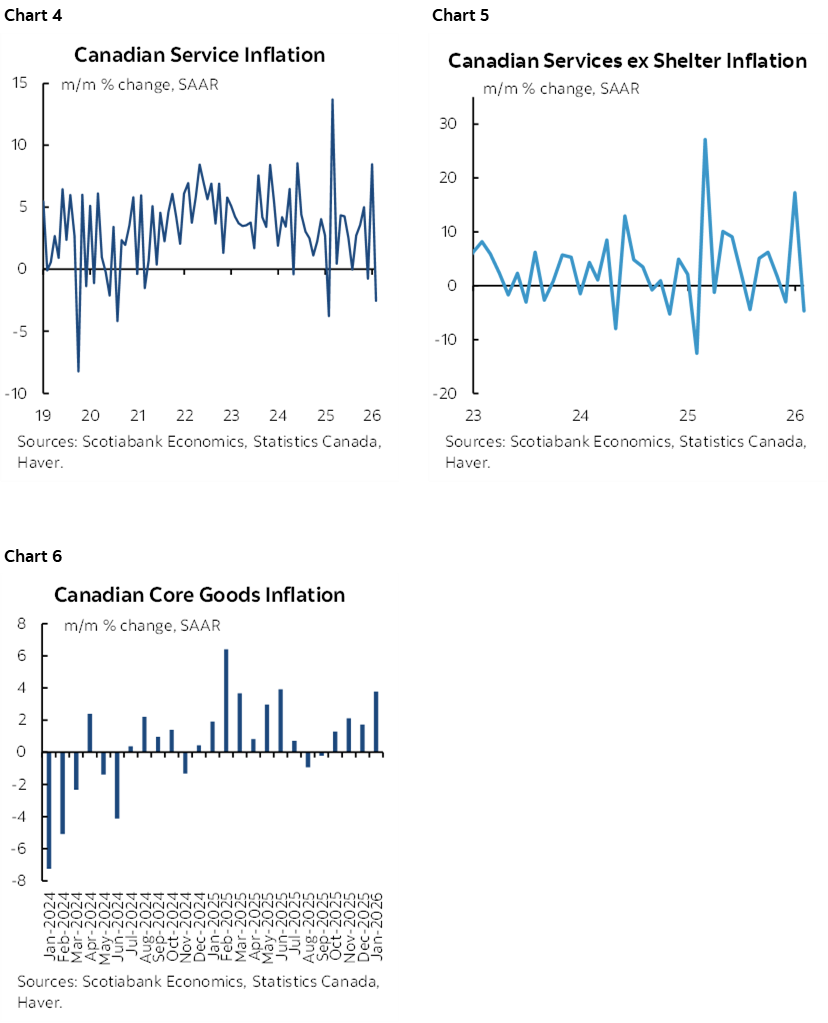
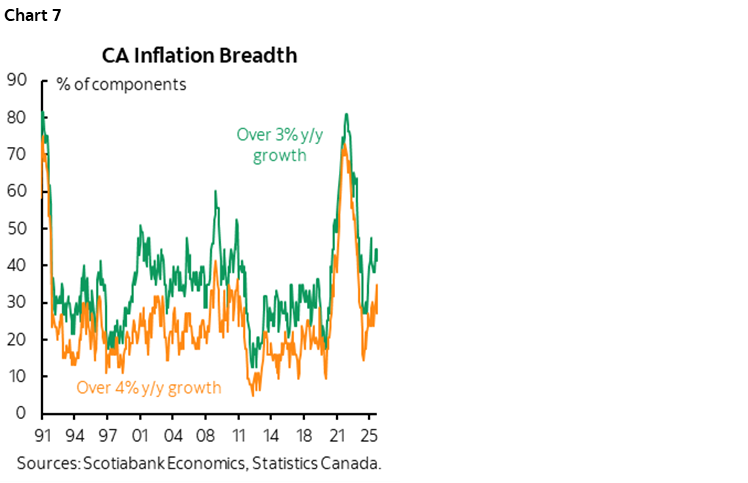
- All main measures of core inflation were soft again last month
- Headline and core measures are tracking in line with BoC’s January MPR
- The BoC will want a lot more evidence this isn’t just another temporary soft patch
- Mild reaction in Canadian markets
- Canadian CPI m/m % / y/y %, NSA, January:
- Actual: 0.0 / 2.3
- Scotia: 0.1 / 2.4
- Consensus: 0.1 / 2.4
- Prior: -0.2 / 2.4
- Trimmed mean CPI m/m % SAAR: 1.1 (prior revised to 0.55% from 1.1%)
- Weighted median CPI m/m % SAAR: 1.6 (prior unrevised from 0.5%)
- Traditional core ex-food & energy % SAAR: 1.5 (prior unrevised to 3.1%)
Canadian core measures of CPI inflation were soft again last month. Markets reacted by driving a slight decline in Canadian government bond yields including about a 2bps drop in the 2s yield and a mild depreciation of the Canadian dollar of about a quarter of a cent to the USD.
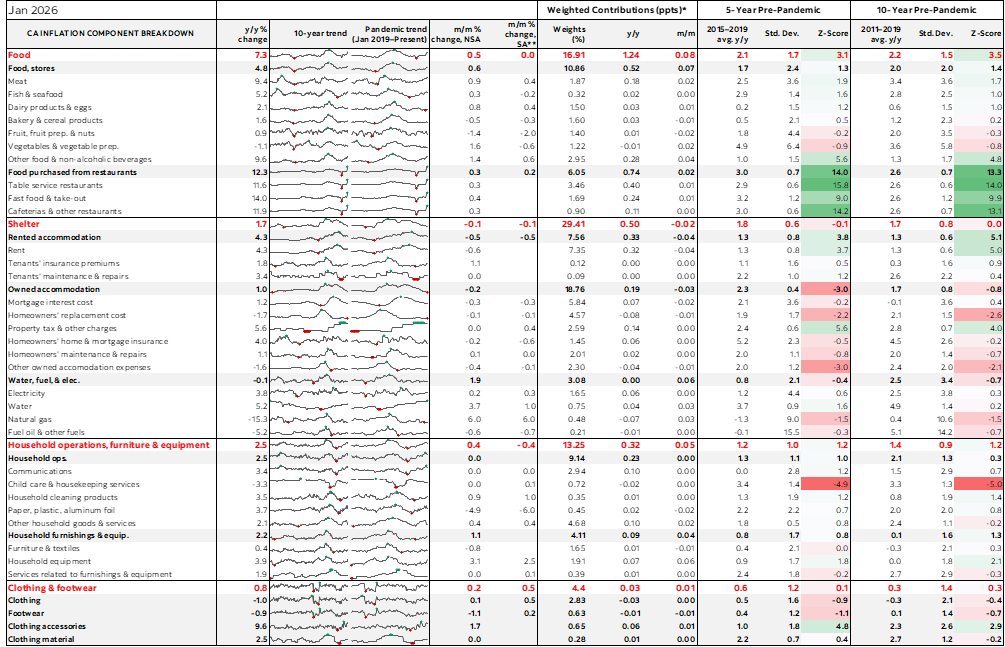
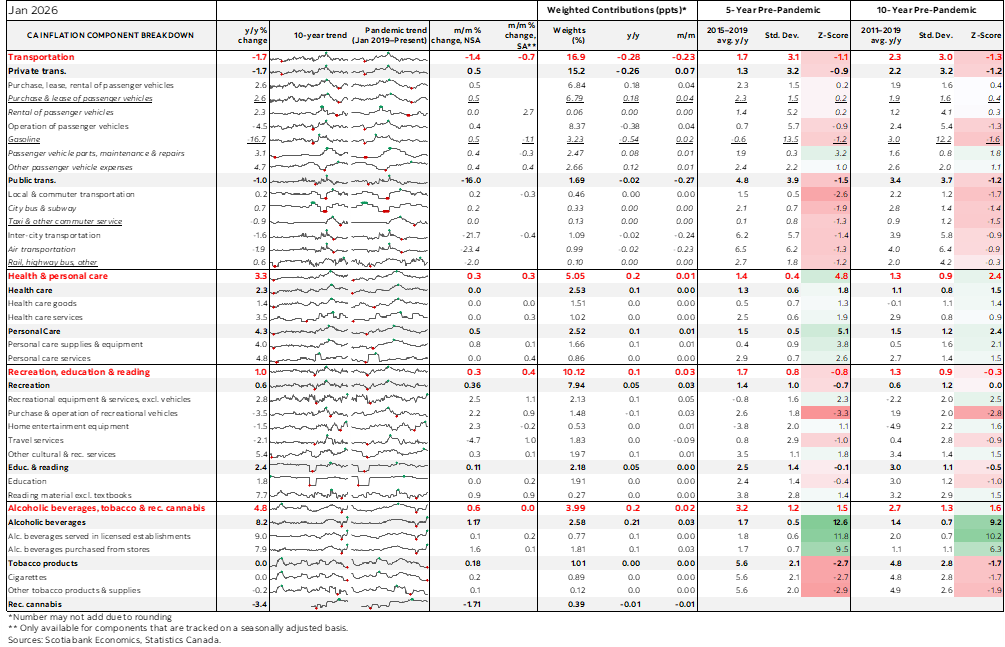
All three measures of core CPI were soft in m/m terms at a seasonally adjusted and annualized rate (SAAR). See charts 1-3. Traditional core (ex-food and energy) was up by only 1.5% m/m SAAR. Weighted median CPI that captures inflation at the 50th-percentile point of the basket was up 1.6%. Trimmed mean CPI that lops off the top and bottom 20% of the basket after sorting from highest to lowest weighted contributions was up by just 1.1%. Only trimmed mean CPI was revised for the prior month to 0.55% from 1.1%).
Why such a mild reaction? One reason is that the market has been trained to understand that the BoC is on a prolonged hold as it evaluates upside and downside risks and the combination of cyclical and structural drivers alongside potential changes to fiscal policy and trade policy. That’s a patient debate and reacting in overly hasty fashion could be disastrous.
Another reason is that the numbers are of no clear surprise to the BOC. The January MPR had 2.0% y/y for headline CPI and the first month of the quarter was 2.3%. There are a lot of transitory factors from a year-ago that will be working through. One is that upward HST relief effects on y/y total CPI start to expire next month and more fully by March after which the elimination of the consumer portion of the carbon tax turns y/y upward.
Further, trimmed mean CPI and weighted median CPI were expected by the BoC to average 2.5% y/y and the January figure is at about that.
There is also the important issue of requiring much more data to avoid being fooled by a potentially temporary soft patch. Something similar was witnessed in early 2024, for instance, after which the m/m SAAR measures of core inflation all took off higher. Short-sighted markets react to short-term data. Central banks should not.
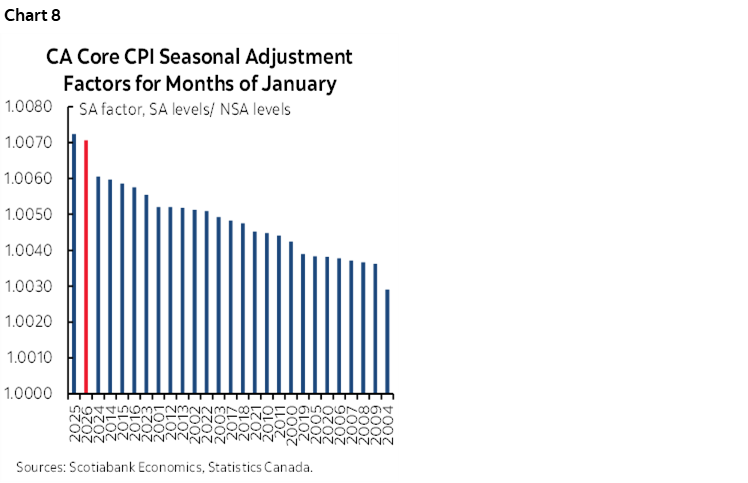
The gyrations in services versus core goods (ex-food and energy) inflation also merit caution. Services inflation had skyrocketed in December and fell back in January (chart 4). Most of that services acceleration and then deceleration was in services ex-shelter (chart 5). Core goods inflation was previously soft and suddenly accelerated by the most since mid-2025 (chart 6).
Breadth is also still rising (chart 7). It’s not alarming, but if it continues, then it will be of rising concern to the BoC.
There may also be other temporary distortions. The heat is finally coming out of how CPI measures rented accommodation. This follows a large surge on the back of an influx of temporary residents made up of international students, temporary foreign workers and asylum seekers. Tighter immigration policy has tamped down the temporary resident numbers and cooled rental market pressures until a new equilibrium is achieved.
There could also be temporary weather effects that tamped down many prices as consumers stayed in from one of the coldest and snowiest winters in years.
On the flipside is that the high seasonal adjustment factor applied to traditional core CPI suggests that this measure of inflation would have been softer if an SA factor would have been more in line with prior months of January (chart 8). There is a recency bias to how SA factors are calculated that is somewhat unthinking and automatic.
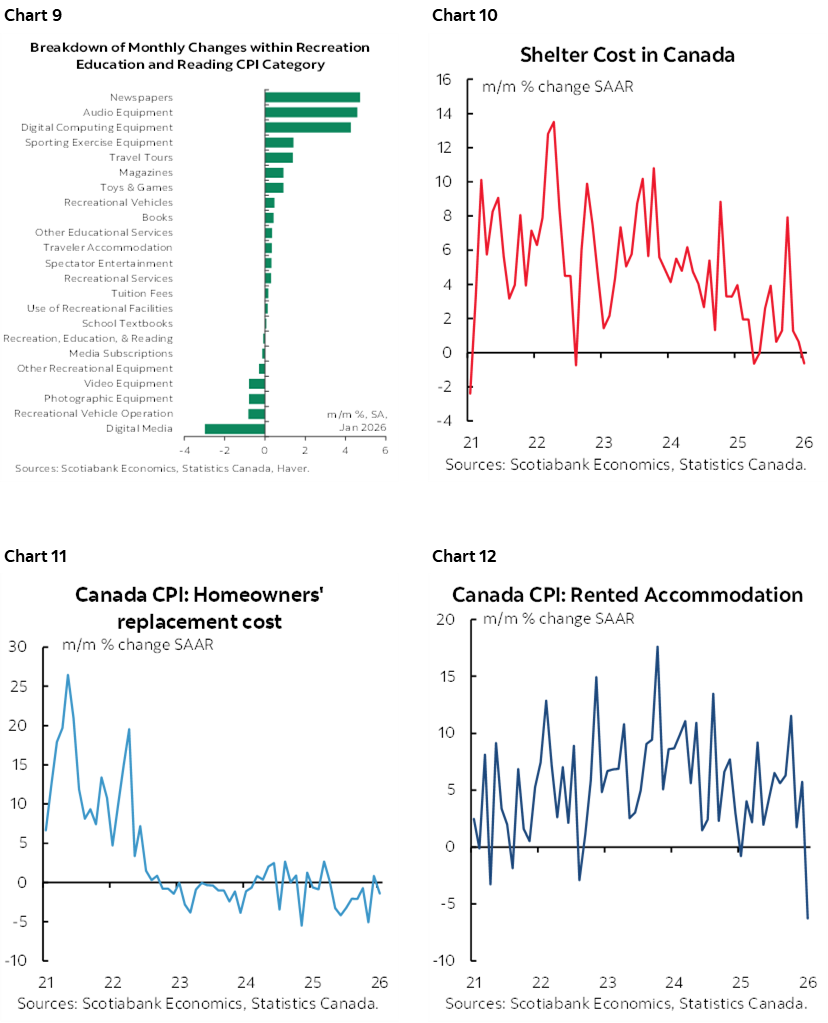
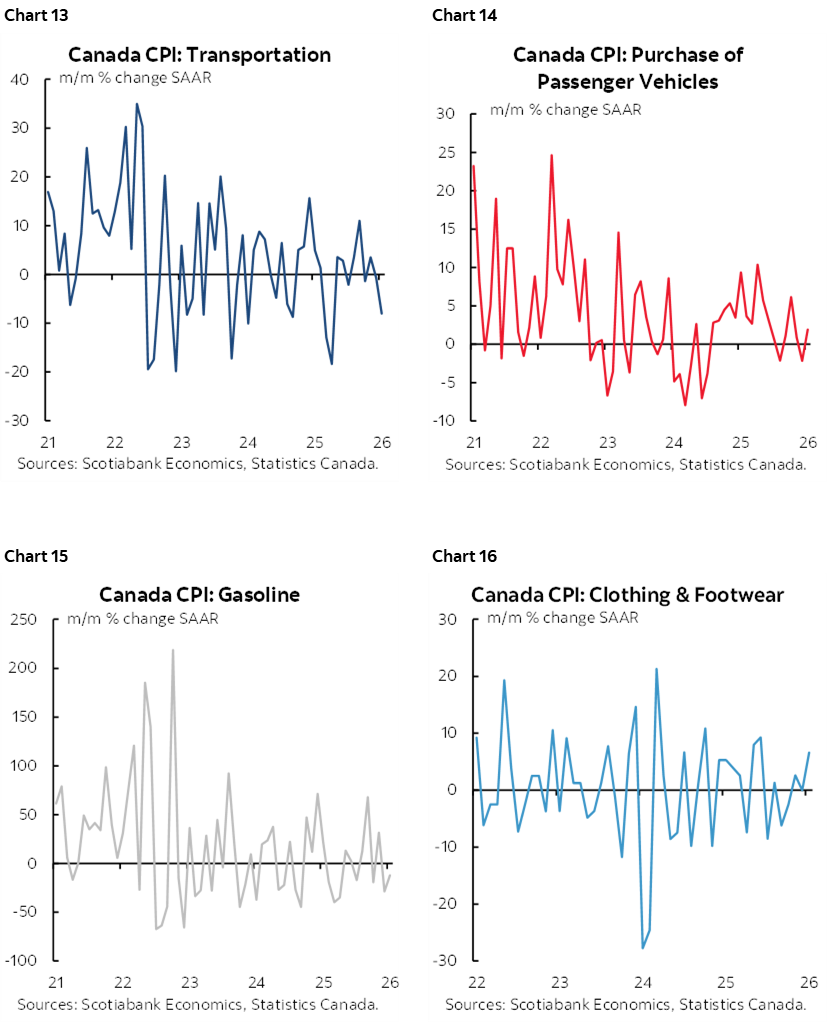
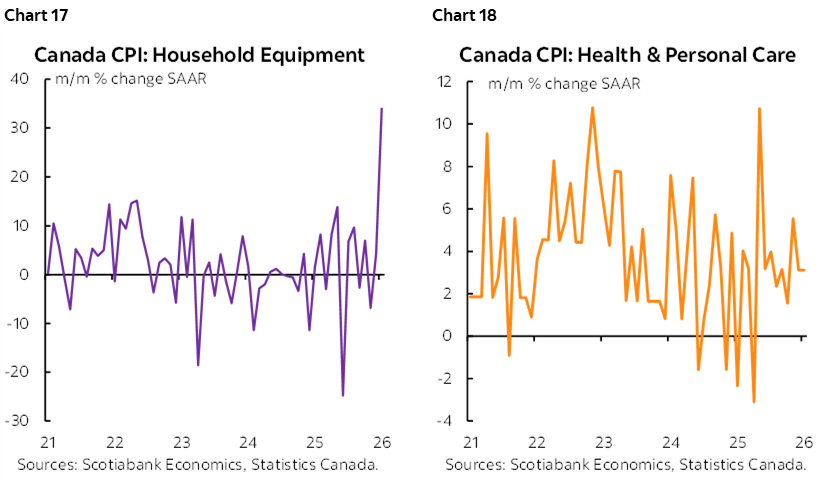
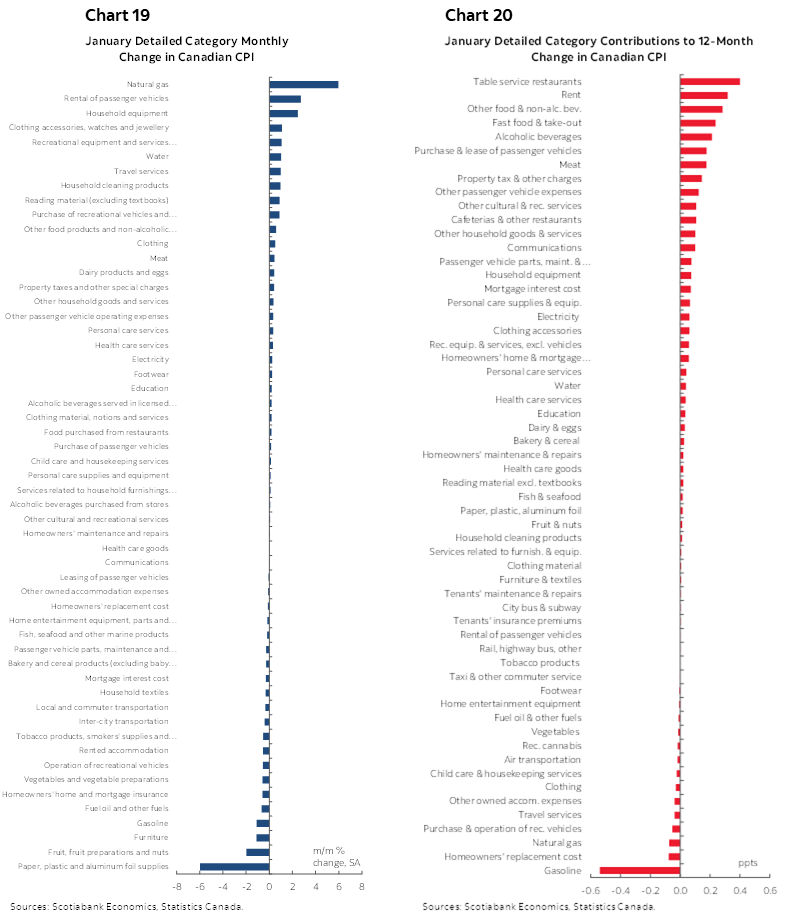
Charts 9-18 plot some of the basket components. Charts 19-20 break down the basket in m/m unweighted and weighted terms. Charts 21-22 do likewise in y/y terms.
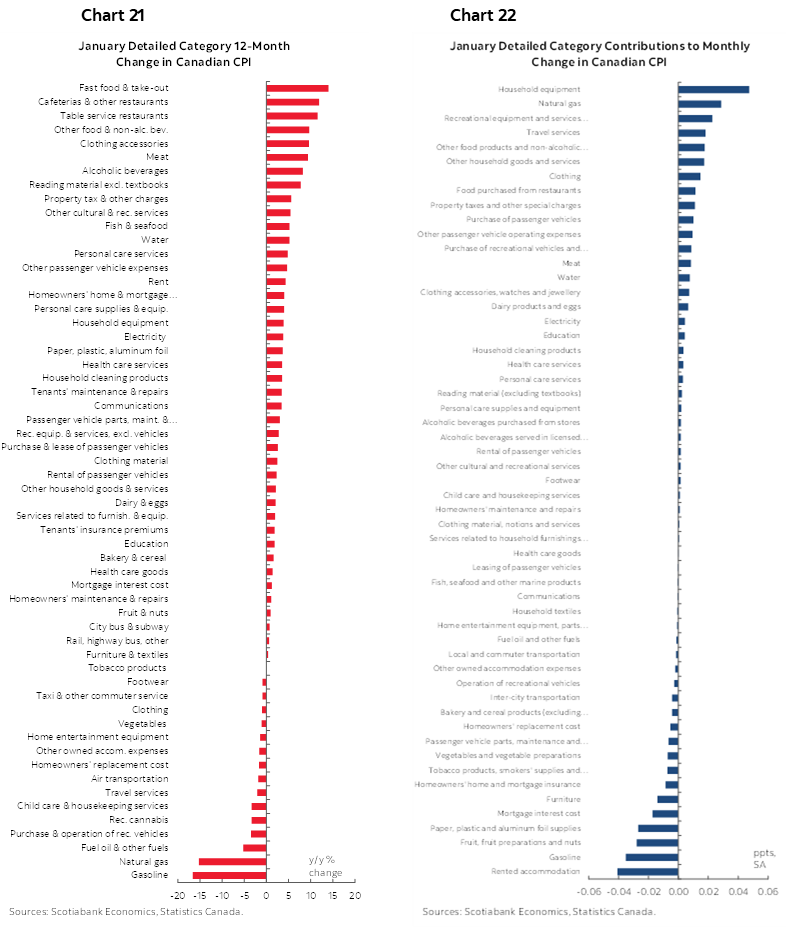
Please also see the accompanying table with further details and micro charts.
DISCLAIMER
This report has been prepared by Scotiabank Economics as a resource for the clients of Scotiabank. Opinions, estimates and projections contained herein are our own as of the date hereof and are subject to change without notice. The information and opinions contained herein have been compiled or arrived at from sources believed reliable but no representation or warranty, express or implied, is made as to their accuracy or completeness. Neither Scotiabank nor any of its officers, directors, partners, employees or affiliates accepts any liability whatsoever for any direct or consequential loss arising from any use of this report or its contents.
These reports are provided to you for informational purposes only. This report is not, and is not constructed as, an offer to sell or solicitation of any offer to buy any financial instrument, nor shall this report be construed as an opinion as to whether you should enter into any swap or trading strategy involving a swap or any other transaction. The information contained in this report is not intended to be, and does not constitute, a recommendation of a swap or trading strategy involving a swap within the meaning of U.S. Commodity Futures Trading Commission Regulation 23.434 and Appendix A thereto. This material is not intended to be individually tailored to your needs or characteristics and should not be viewed as a “call to action” or suggestion that you enter into a swap or trading strategy involving a swap or any other transaction. Scotiabank may engage in transactions in a manner inconsistent with the views discussed this report and may have positions, or be in the process of acquiring or disposing of positions, referred to in this report.
Scotiabank, its affiliates and any of their respective officers, directors and employees may from time to time take positions in currencies, act as managers, co-managers or underwriters of a public offering or act as principals or agents, deal in, own or act as market makers or advisors, brokers or commercial and/or investment bankers in relation to securities or related derivatives. As a result of these actions, Scotiabank may receive remuneration. All Scotiabank products and services are subject to the terms of applicable agreements and local regulations. Officers, directors and employees of Scotiabank and its affiliates may serve as directors of corporations.
Any securities discussed in this report may not be suitable for all investors. Scotiabank recommends that investors independently evaluate any issuer and security discussed in this report, and consult with any advisors they deem necessary prior to making any investment.
This report and all information, opinions and conclusions contained in it are protected by copyright. This information may not be reproduced without the prior express written consent of Scotiabank.
™ Trademark of The Bank of Nova Scotia. Used under license, where applicable.
Scotiabank, together with “Global Banking and Markets”, is a marketing name for the global corporate and investment banking and capital markets businesses of The Bank of Nova Scotia and certain of its affiliates in the countries where they operate, including; Scotiabank Europe plc; Scotiabank (Ireland) Designated Activity Company; Scotiabank Inverlat S.A., Institución de Banca Múltiple, Grupo Financiero Scotiabank Inverlat, Scotia Inverlat Casa de Bolsa, S.A. de C.V., Grupo Financiero Scotiabank Inverlat, Scotia Inverlat Derivados S.A. de C.V. – all members of the Scotiabank group and authorized users of the Scotiabank mark. The Bank of Nova Scotia is incorporated in Canada with limited liability and is authorised and regulated by the Office of the Superintendent of Financial Institutions Canada. The Bank of Nova Scotia is authorized by the UK Prudential Regulation Authority and is subject to regulation by the UK Financial Conduct Authority and limited regulation by the UK Prudential Regulation Authority. Details about the extent of The Bank of Nova Scotia's regulation by the UK Prudential Regulation Authority are available from us on request. Scotiabank Europe plc is authorized by the UK Prudential Regulation Authority and regulated by the UK Financial Conduct Authority and the UK Prudential Regulation Authority.
Scotiabank Inverlat, S.A., Scotia Inverlat Casa de Bolsa, S.A. de C.V, Grupo Financiero Scotiabank Inverlat, and Scotia Inverlat Derivados, S.A. de C.V., are each authorized and regulated by the Mexican financial authorities.
Not all products and services are offered in all jurisdictions. Services described are available in jurisdictions where permitted by law.