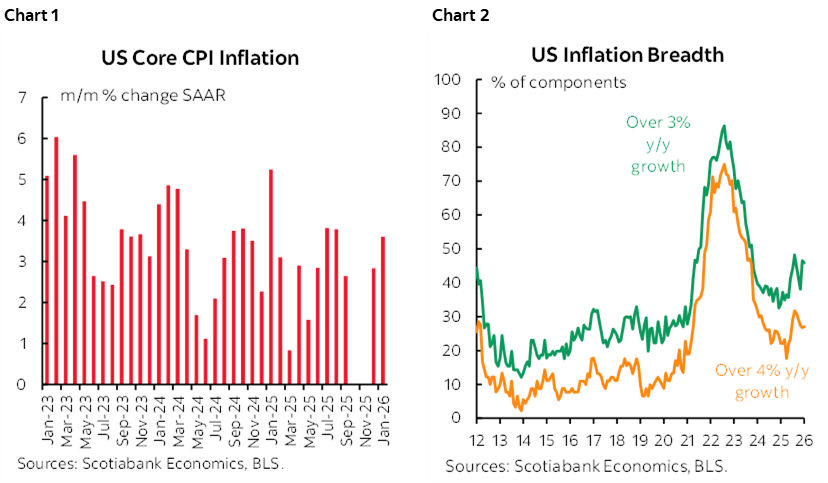
- Core CPI posted a second consecutive strong gain
- Breadth remains elevated
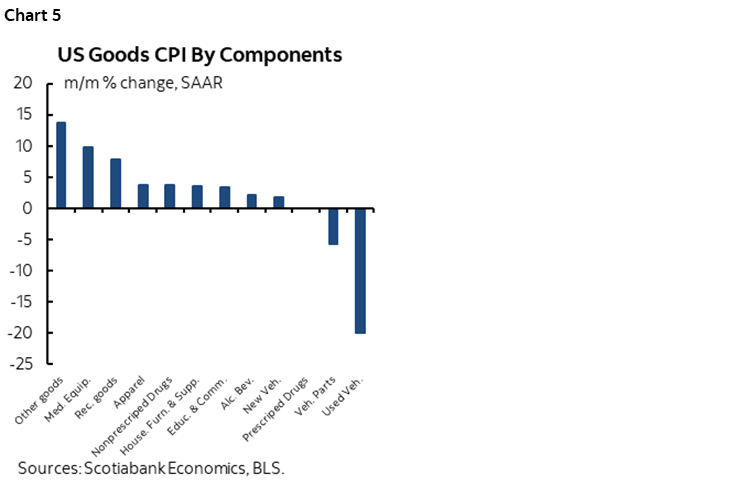
- Prices for core services remain hot
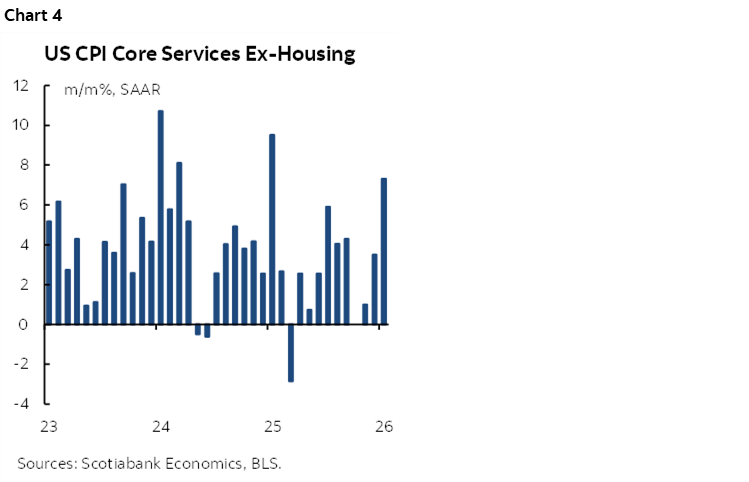
- Core goods prices were flat, but not because of waning tariff effects
- US inflation data will remain messed up and lagging over the next month
- FOMC hawks will dig in on warm core CPI and details
- US CPI / core CPI, m/m % change, SA, January:
- Actual: 0.17 / 0.30
- Scotia: 0.3 / 0.3
- Consensus: 0.3 / 0.3
- Prior: 0.30 / 0.23
US core inflation landed on the screws at 0.28% m/m seasonally adjusted. That maintains elevated pressure on underlying inflation (chart 1). The details will spawn the usual debates, but the fundamental point is that underlying pressure and breadth (chart 2) are too hot to appease the FOMC’s hawks. Details are here and interpretations follow.
Markets initially reacted to the headline beat with slightly lower than expected total CPI inflation of 0.2% m/m SA but the US 2s yield quickly reversed that. Markets have since been volatile with modest downward pressure on Treasury yields.
This report does nothing to change the Fed's dilemma. Jobs are weak, core inflation is not pending core PCE’s translation from core CPI and core PPI when we get it. Take health and social services out of nonfarm and January’s job change was flat and continued a rather weak trend. But core CPI and particularly core services CPI pressure like this won't swing the hawks on the Committee around to easing.
Chart 3 shows that core goods prices excluding food and energy commodities were flat at 0% m/m SA.
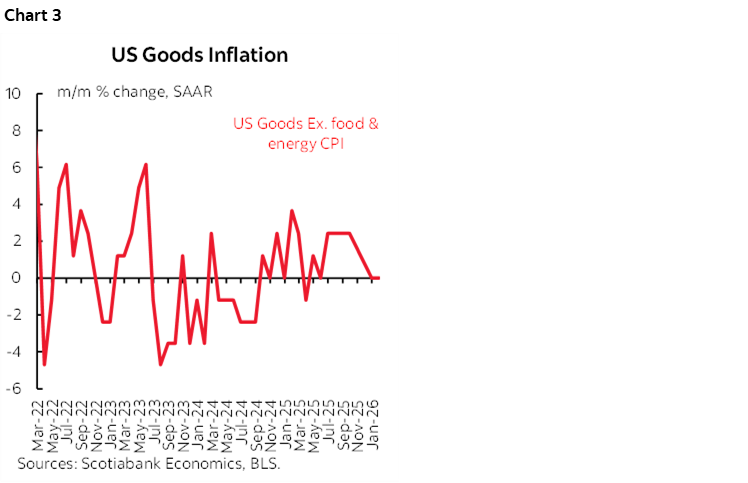
Chart 4 shows core service prices that exclude shelter and energy services. The 0.6% m/m SA nonannualized rise was the hottest since last January and the chart shows this figure converted to an annualized rate. This chart will ignite the hawks.
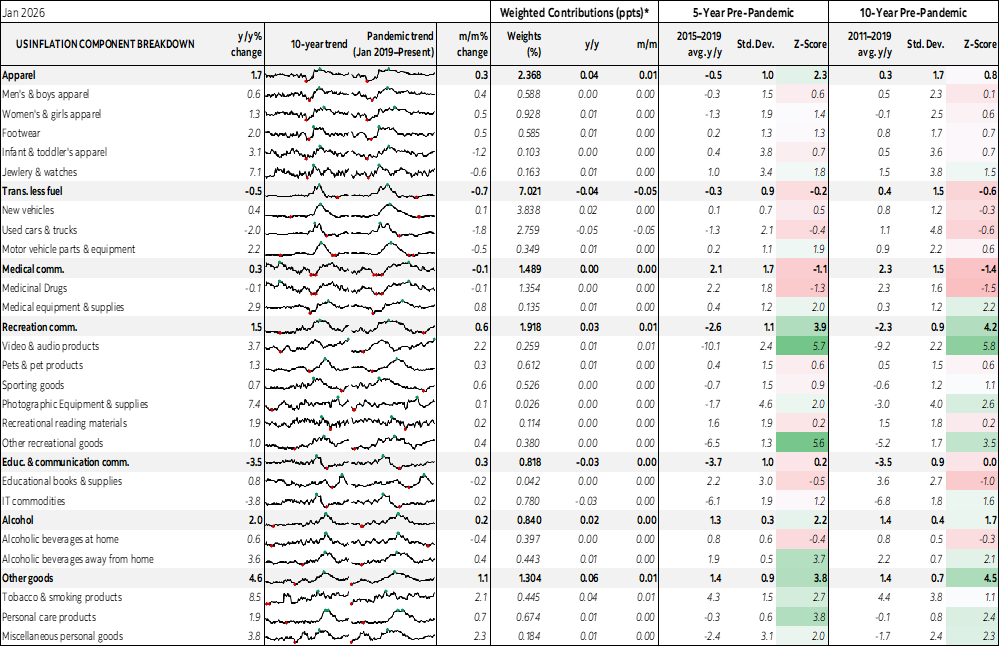
What drove core goods prices to be flat? That can't be claimed as evidence of no tariff effect. Tariff related categories like apparel, household furnishings, recreation commodities etc were quite firm (chart 5).
Instead, vehicles were part of the soft core goods inflation with waning demand. Used vehicles were most of that with a price drop of -1.8% m/m SA, but even new prices were little changed (+0.1%). New vehicle sales have been trending lower. Vehicle parts prices have also been falling. Autos are obviously subject to tariffs unless USMCA compliant which is most of them, so the weakness likely reflects softening auto demand. New vehicle sales peak last March before ‘Liberation Day’ as tariff front-running kicked in and the industry is dealing with the aftermath combined with the expiration of EV subsidies at the end of September.
Flat to lower drug prices were a partial influence.
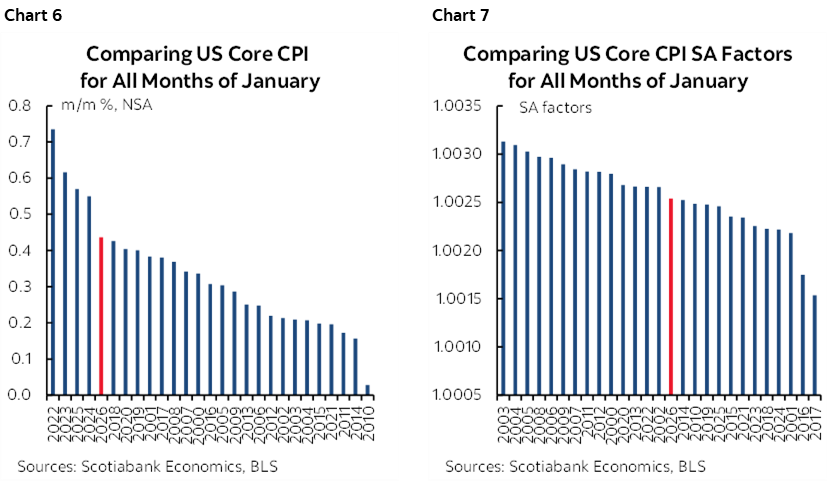
Seasonally unadjusted prices were firmer than usual for an average month of January (chart 6) but the seasonal adjustment factor was unspectacular (chart 7).
Conversion from core CPI weights to core PCE weights suggest core PCE is tracking at about 0.24% m/m SA for January. We will not, however, get PCE for January until March 13th. Next Friday’s PCE will be for December and we don’t get producer prices for January until one week after that. The US inflation data release schedule remains messed up by the shutdown.
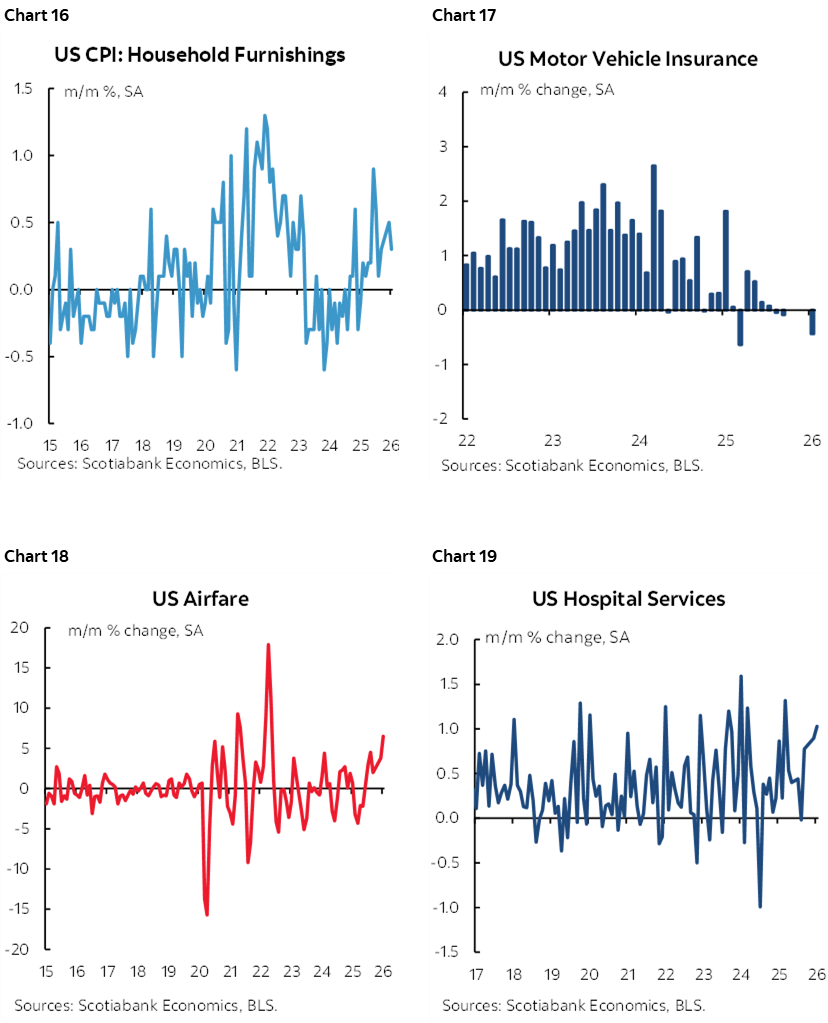
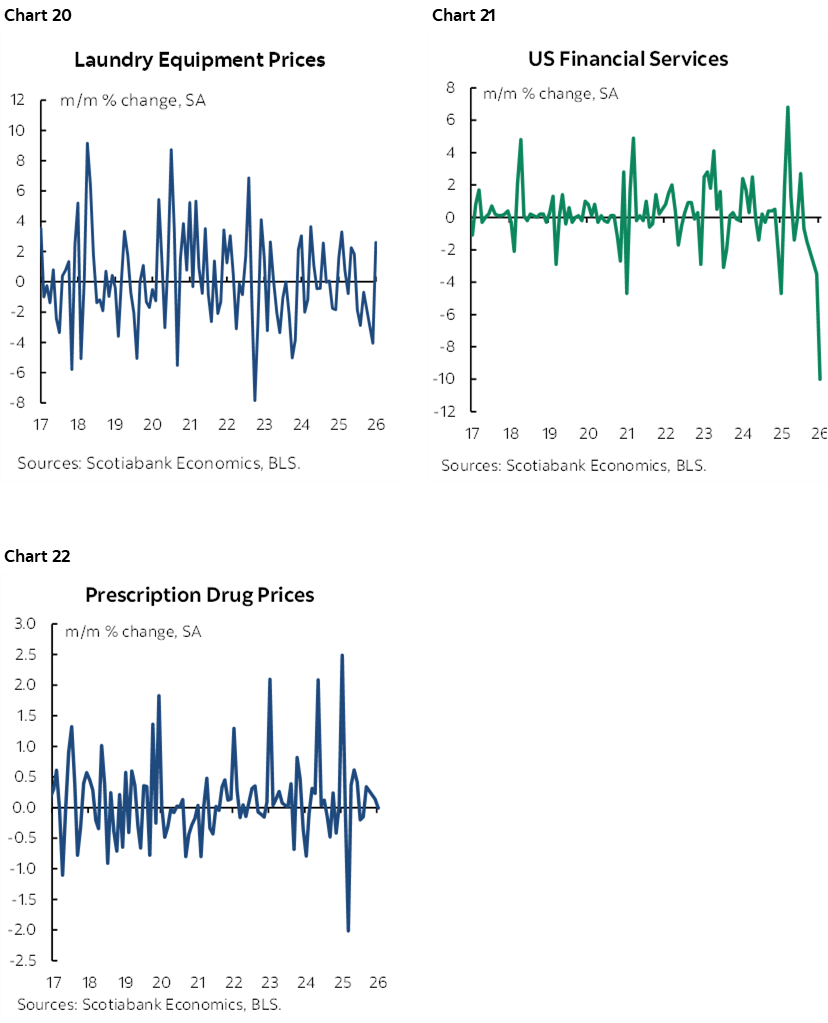
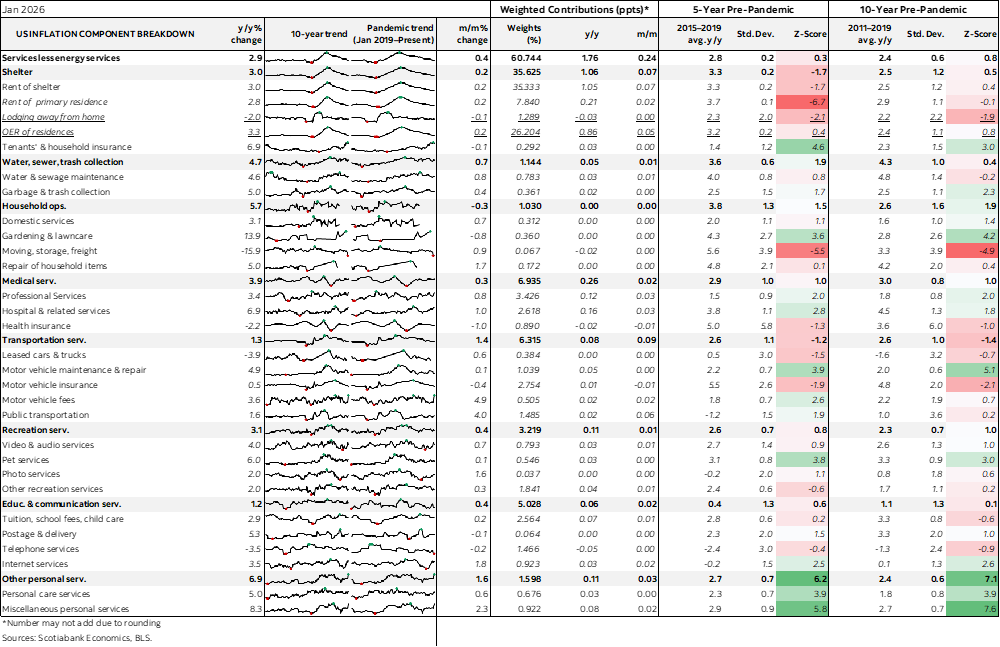
Charts 8–22 show components. Shelter was up 0.2% including for owners equivalent rent and primary rent.
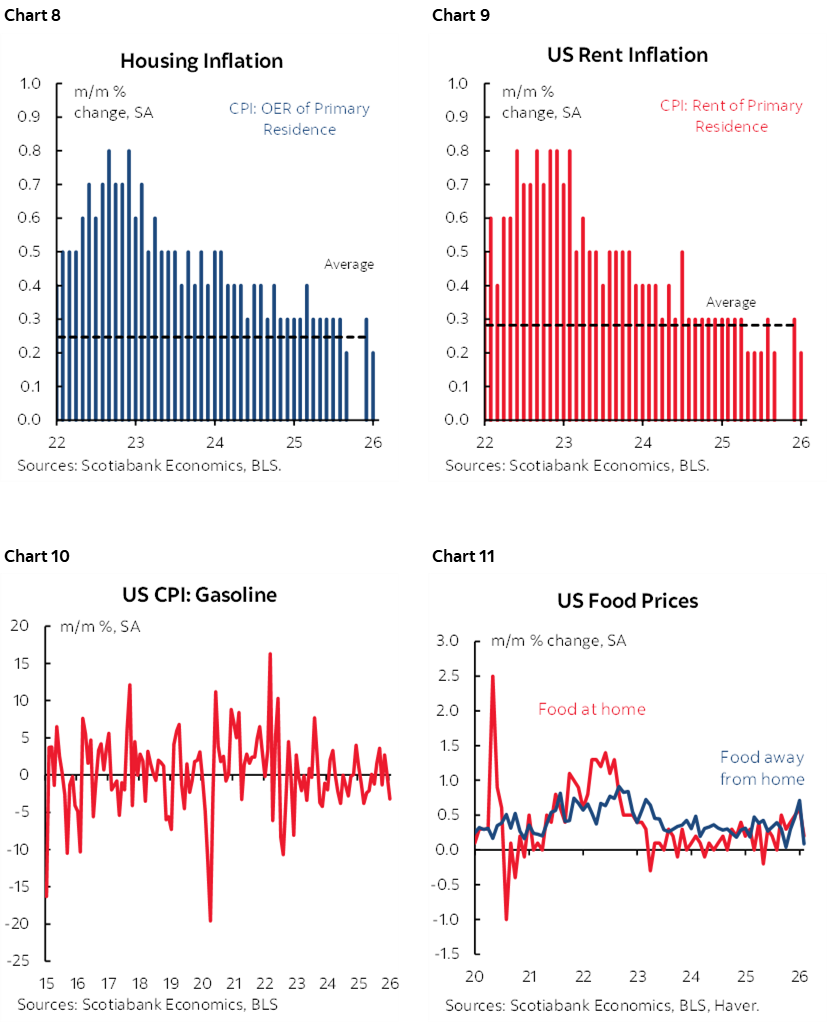
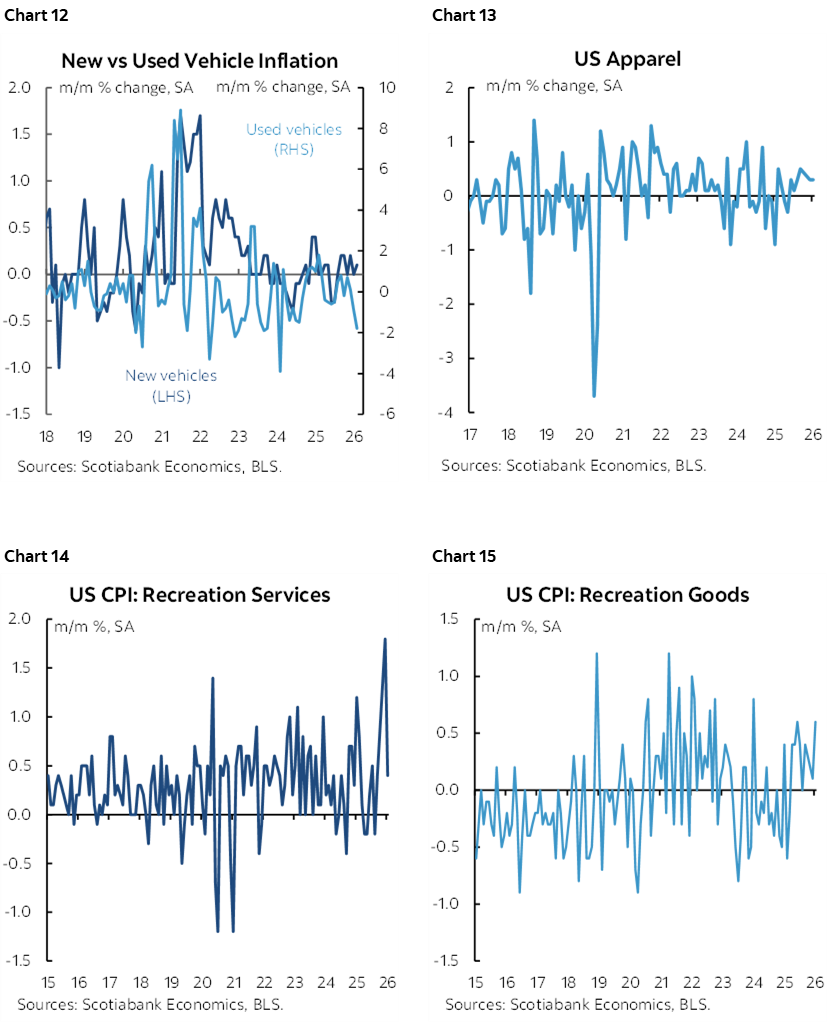
Used vehicle prices fell 1.8% m/m SA with new vehicles little changed (+0.1%).
Gasoline prices fell by 3.2% m/m SA which, along with stable food price inflation of 0.2% including groceries (0.2%) and ‘away from home’ food (0.1%) helped to explain why headline CPI was softer than core that excludes these categories.
There is quite a lot of breadth across individual service price categories to go with the 0.6% m/m SA jump in core services prices (ie: ex-housing and energy services).
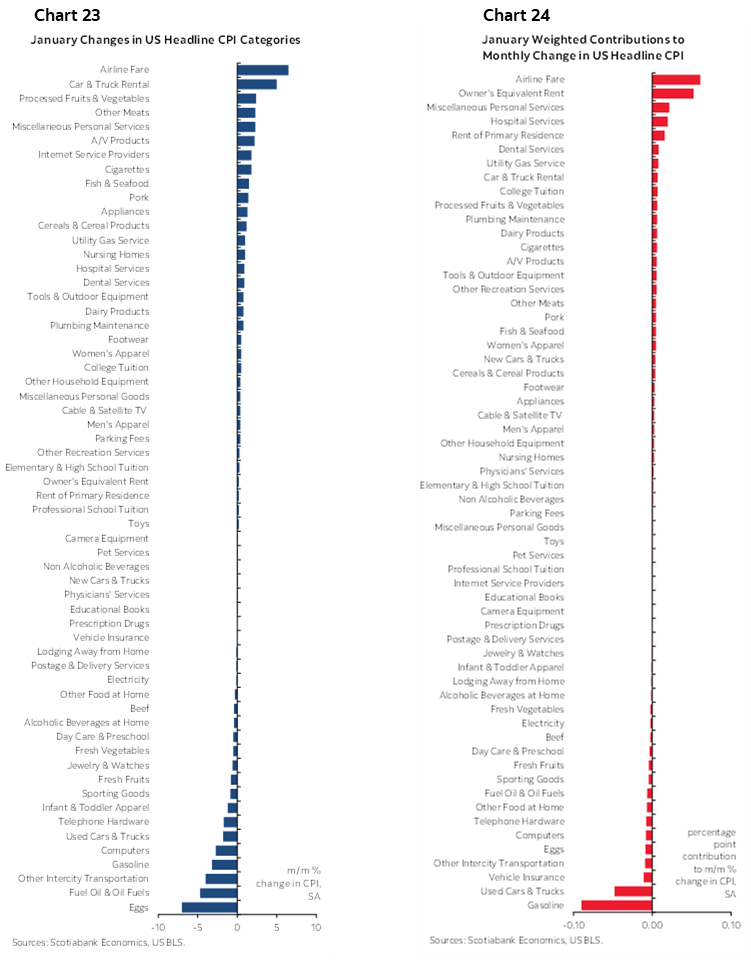
Charts 23–24 show unweighted and weighted contributions to the change in total CPI on a month-over-month basis.
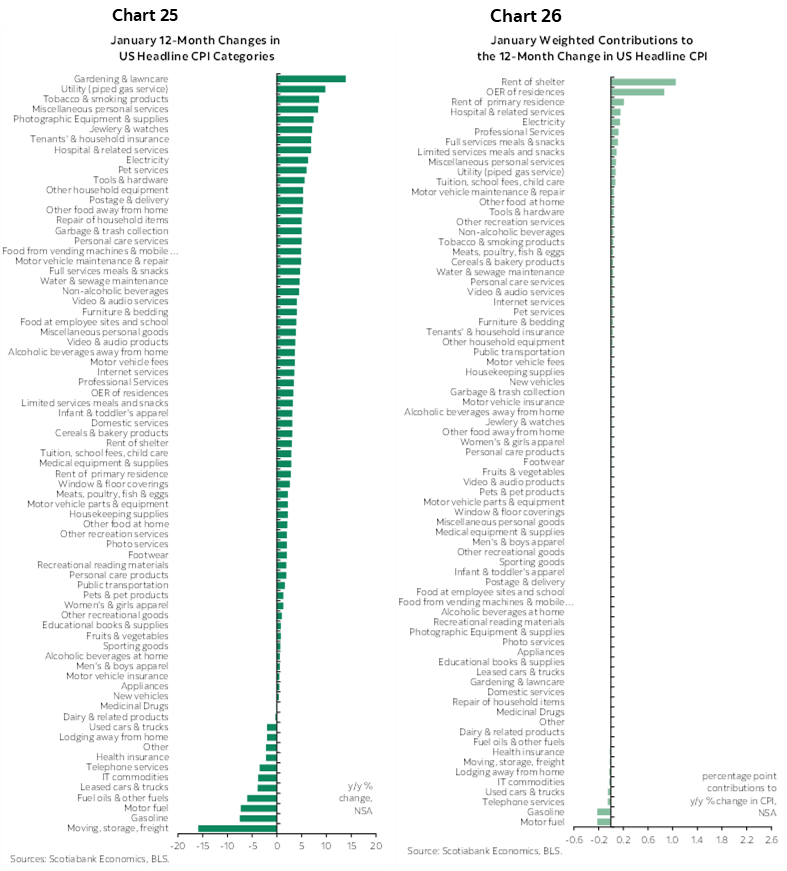
Charts 25–26 do likewise for year–over–year changes.
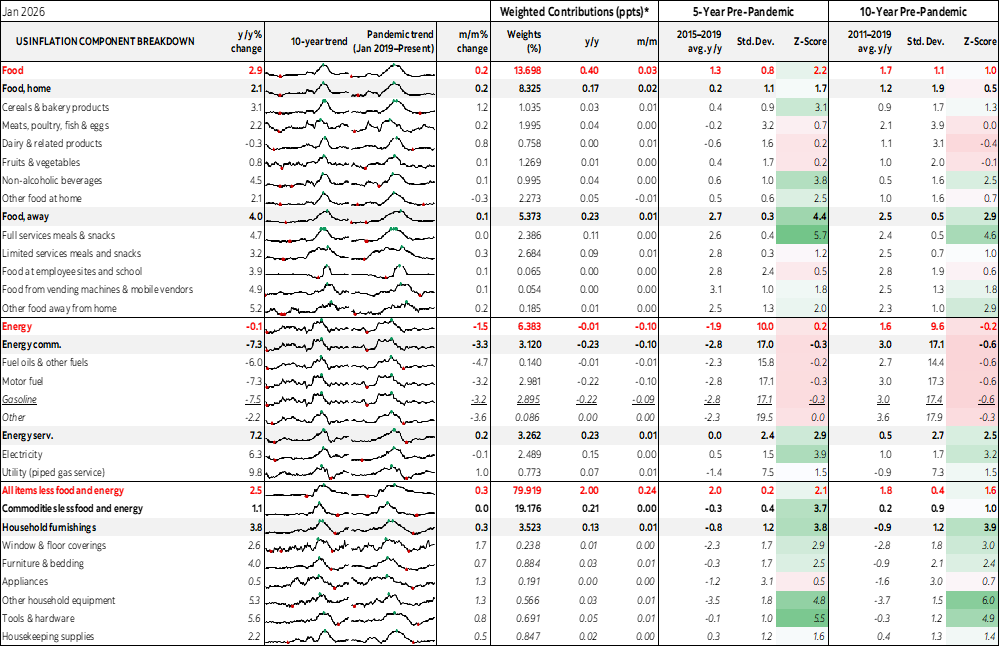
Also see the accompanying table for more details and micro charts plus measures of dispersion.
DISCLAIMER
This report has been prepared by Scotiabank Economics as a resource for the clients of Scotiabank. Opinions, estimates and projections contained herein are our own as of the date hereof and are subject to change without notice. The information and opinions contained herein have been compiled or arrived at from sources believed reliable but no representation or warranty, express or implied, is made as to their accuracy or completeness. Neither Scotiabank nor any of its officers, directors, partners, employees or affiliates accepts any liability whatsoever for any direct or consequential loss arising from any use of this report or its contents.
These reports are provided to you for informational purposes only. This report is not, and is not constructed as, an offer to sell or solicitation of any offer to buy any financial instrument, nor shall this report be construed as an opinion as to whether you should enter into any swap or trading strategy involving a swap or any other transaction. The information contained in this report is not intended to be, and does not constitute, a recommendation of a swap or trading strategy involving a swap within the meaning of U.S. Commodity Futures Trading Commission Regulation 23.434 and Appendix A thereto. This material is not intended to be individually tailored to your needs or characteristics and should not be viewed as a “call to action” or suggestion that you enter into a swap or trading strategy involving a swap or any other transaction. Scotiabank may engage in transactions in a manner inconsistent with the views discussed this report and may have positions, or be in the process of acquiring or disposing of positions, referred to in this report.
Scotiabank, its affiliates and any of their respective officers, directors and employees may from time to time take positions in currencies, act as managers, co-managers or underwriters of a public offering or act as principals or agents, deal in, own or act as market makers or advisors, brokers or commercial and/or investment bankers in relation to securities or related derivatives. As a result of these actions, Scotiabank may receive remuneration. All Scotiabank products and services are subject to the terms of applicable agreements and local regulations. Officers, directors and employees of Scotiabank and its affiliates may serve as directors of corporations.
Any securities discussed in this report may not be suitable for all investors. Scotiabank recommends that investors independently evaluate any issuer and security discussed in this report, and consult with any advisors they deem necessary prior to making any investment.
This report and all information, opinions and conclusions contained in it are protected by copyright. This information may not be reproduced without the prior express written consent of Scotiabank.
™ Trademark of The Bank of Nova Scotia. Used under license, where applicable.
Scotiabank, together with “Global Banking and Markets”, is a marketing name for the global corporate and investment banking and capital markets businesses of The Bank of Nova Scotia and certain of its affiliates in the countries where they operate, including; Scotiabank Europe plc; Scotiabank (Ireland) Designated Activity Company; Scotiabank Inverlat S.A., Institución de Banca Múltiple, Grupo Financiero Scotiabank Inverlat, Scotia Inverlat Casa de Bolsa, S.A. de C.V., Grupo Financiero Scotiabank Inverlat, Scotia Inverlat Derivados S.A. de C.V. – all members of the Scotiabank group and authorized users of the Scotiabank mark. The Bank of Nova Scotia is incorporated in Canada with limited liability and is authorised and regulated by the Office of the Superintendent of Financial Institutions Canada. The Bank of Nova Scotia is authorized by the UK Prudential Regulation Authority and is subject to regulation by the UK Financial Conduct Authority and limited regulation by the UK Prudential Regulation Authority. Details about the extent of The Bank of Nova Scotia's regulation by the UK Prudential Regulation Authority are available from us on request. Scotiabank Europe plc is authorized by the UK Prudential Regulation Authority and regulated by the UK Financial Conduct Authority and the UK Prudential Regulation Authority.
Scotiabank Inverlat, S.A., Scotia Inverlat Casa de Bolsa, S.A. de C.V, Grupo Financiero Scotiabank Inverlat, and Scotia Inverlat Derivados, S.A. de C.V., are each authorized and regulated by the Mexican financial authorities.
Not all products and services are offered in all jurisdictions. Services described are available in jurisdictions where permitted by law.