- Payrolls beat expectations due to one single sector—health
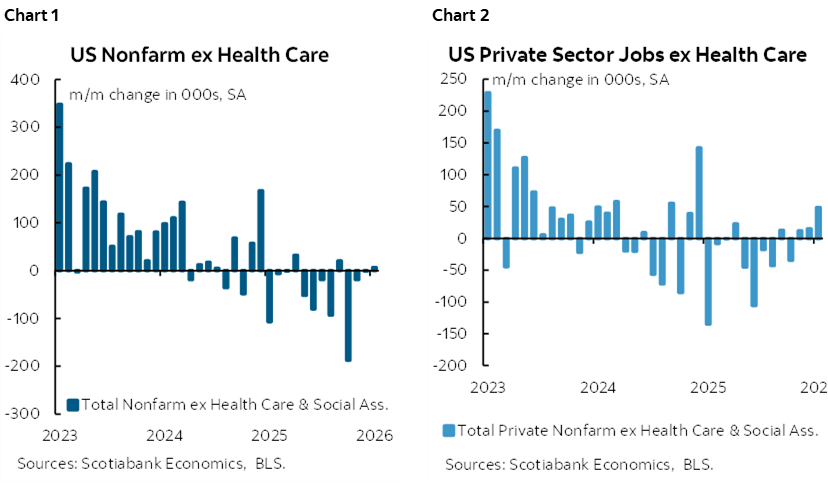
- Ex-health, payrolls continue to grind to a halt
- Ambulatory and counselling services drove the job gain
- Revisions wiped out 1.029 million jobs by year-end 2025…
- ...due to combination of annual March 2025 revisions, SA factor revisions since, and birth-death model changes
- The UR dipped, but with very low confidence in the household survey data…
- ...for multiple reasons, not least of which the use of outdated pre-Inauguration Day population counts before immigration policy tightened
- Weather impaired data collection and the quality of household survey estimates
- Hours worked continue to grow softly
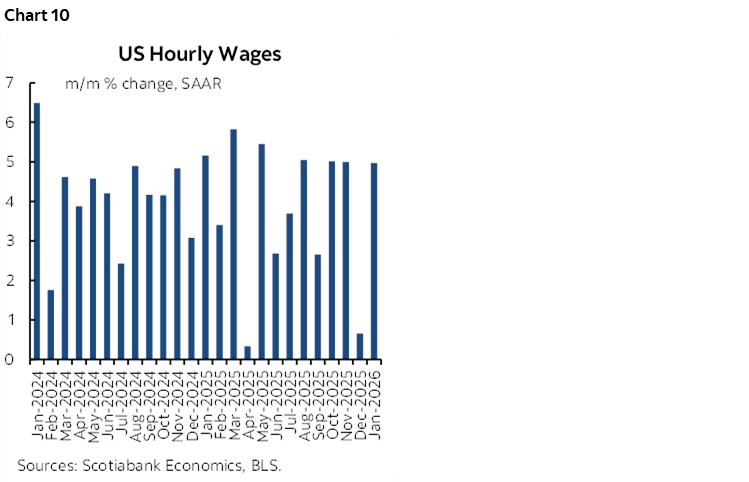
- Wage growth was solid
- US nonfarm payrolls m/m 000s / UR %, SA, January:
- Actual: 130 / 4.3
- Scotia: 0.0 / 4.3
- Consensus: 65 / 4.4
- Prior: 48 / 4.4 (revised from 50 / 4.4)
- Two-month payroll revision: -17k
- Annual payroll revision to March 2025: -862k
- Total payroll revision to December 2025: -1.029 million
This is a weak overall report in my opinion and so I disagree with how markets interpreted the readings for a slew of reasons.
Markets only paid heed to the dip in the unemployment rate and the headline beat without fussing over details. The Fed should fuss over details that paint a continued picture of a very weak job market under the hood and fade the unemployment rate.
NOTHING UNDER THE HOOD
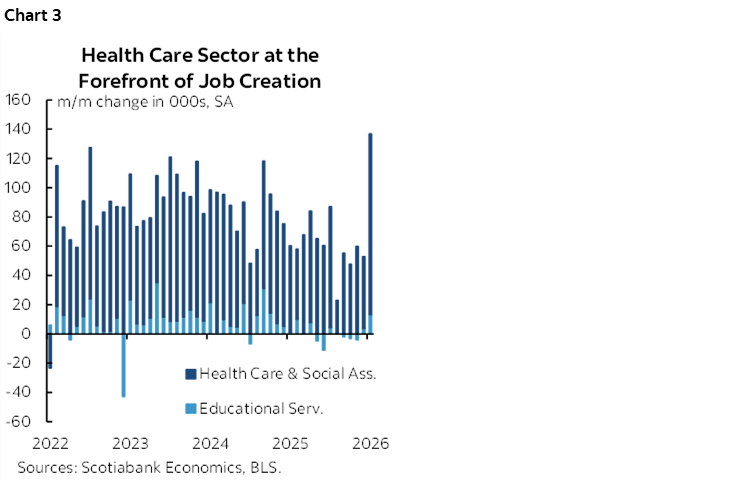
For starters, the nonfarm payroll gain of 130k drops to a gain of only 6.5k after excluding the 123.5k jobs created in the health and social services sector. If not for that one sector, I would’ve been very close. This extends the trend of very weak nonfarm payrolls ex-health (chart 1) though private payrolls ex-health picked up somewhat against a weak trend (chart 2).
Health care added 82k jobs driven by ambulatory health care services (+50k), hospitals (18k), and nursing and residential care facilities (13k). Ambulatory health care services include professionals offering out-patient services. Social assistance hiring was up 42k mainly in individual and family services (38k) which is defined as “primarily engaged in providing non-residential social assistance services for individual and families.”
So, more ambulatory service jobs and more counselling services employment buoyed job growth and that’s supposed to be a good sign for the economy and to markets. Righto, everything makes perfect sense.
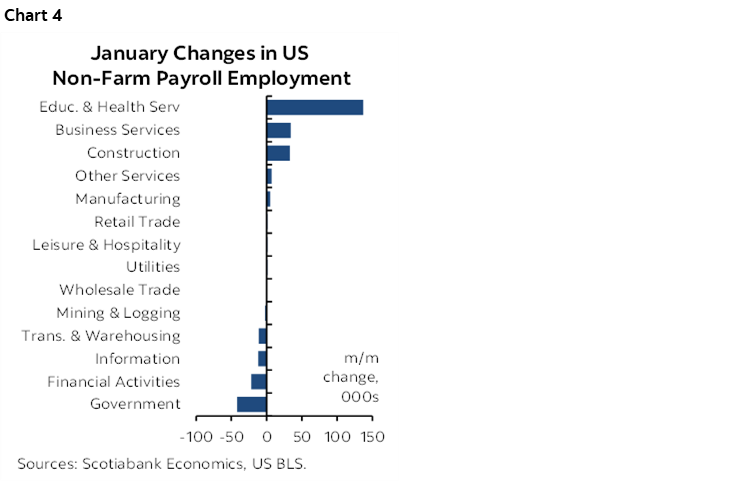
In short, I blew my headline nonfarm call entirely because of this one sector as health and social assistance hiring was the strongest since August 2020 during the pandemic (chart 3). That’s curious in that the expiration of some ACA subsidies in December is likely to impair health’s role in hiring over the year even if not in this first report of 2026. I have no good explanation for why health hiring was higher than since the dark days of the pandemic. It even conflicts with the drop in Indeed job postings for health sector positions.
Private nonfarm payrolls gained 172k but only 48.5k after excluding health and social assistance and only 35k after excluding education.
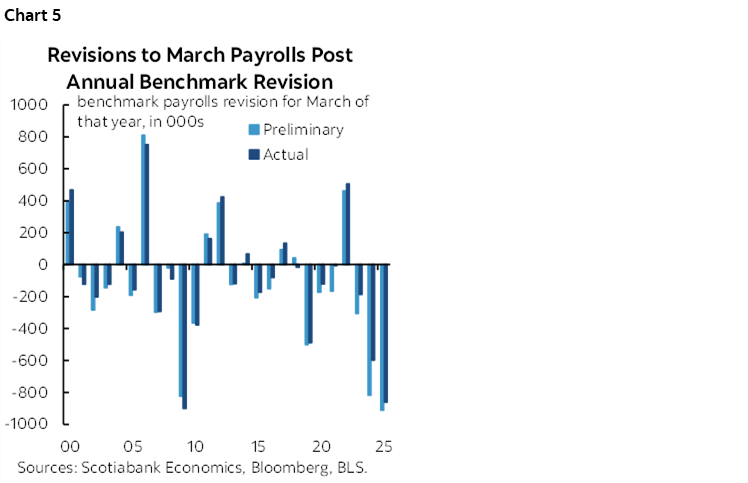
Chart 4 shows the sector breakdown of the change in payrolls. Government fell 42k driven by the federal government (-34k). Most sectors were flat to lower.
REVISIONS WIPED OUT 1.029 MILLION PAYROLL JOBS
There were three types of revisions here that combined to remove 1.029 million nonfarm payroll positions by year-end 2025.
One was to March 2025 in the annual final benchmarking process that removed 862k jobs compared to the initially estimated –911k revision last September. Chart 5 shows the pattern of massive recent revisions to March payroll levels through successive annual benchmarking exercises. Recent years have tipped the scales on the size of the preliminary and final revisions which should have everyone seriously doubting the quality of the jobs numbers being produced by the BLS.
Second was that the BLS revised seasonal adjustment factors and this had the effect shown in chart 6 which portrays more downward than downward revisions from this effect. The BLS notes “Seasonally adjusted data from January 2021 forward are subject to revision. In addition, data for some series prior to 2021, both seasonally adjusted and unadjusted, incorporate other revisions.”
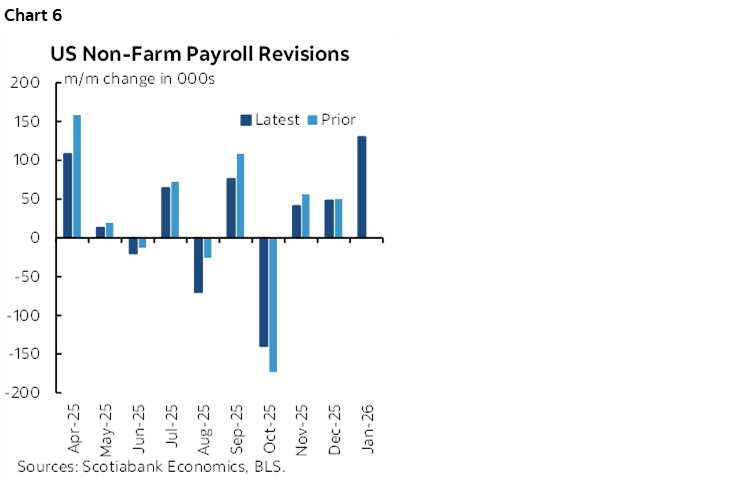
Third was the customary two-month rolling revisions that in this case combined regular revisions with SA factor revision effects to December and November.
There were also birth-death model adjustments that removed 61k seasonally unadjusted jobs in January compared to no adjustments, -99k in December, and –31k in November with wild ups and downs before that.
PAYROLLS HIT THE SKIDS AFTER ‘LIBERATION DAY’
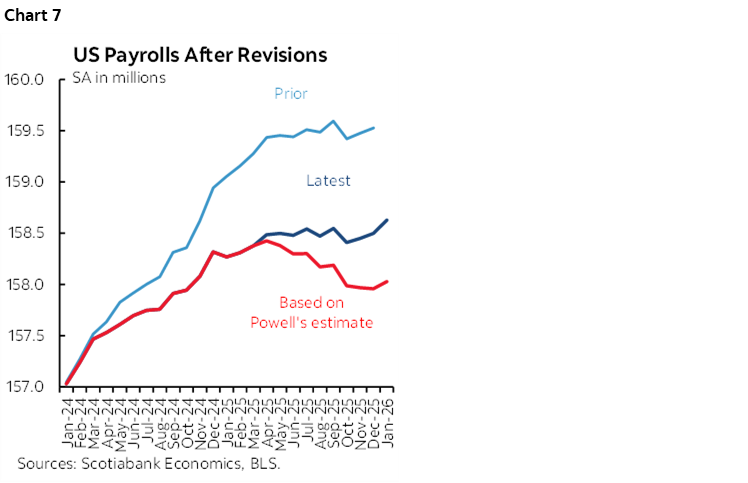
Where this leaves us is chart 7. The light blue line shows payroll levels up to December before this morning’s December data and all revisions. The dark blue line shows payrolls after this morning’s figures. The red line then takes the blue line and adds Chair Powell’s estimated 60k/month overcount of payrolls since April of last year. He offered that estimate on a lark in my opinion and we won’t know until September when the preliminary annual benchmarking revisions to March 2026 payrolls arrives.
THE DIP IN THE UNEMPLOYMENT RATE IS NOT TO BE TRUSTED
The unemployment rate dipped to 4.3% from 4.4%. At least I got that one right, but for wonky reasons that are tough to take credit for. The household survey generated a job gain of 528k in January versus a 387k rise in the size of the labour force. I just don’t trust that data.
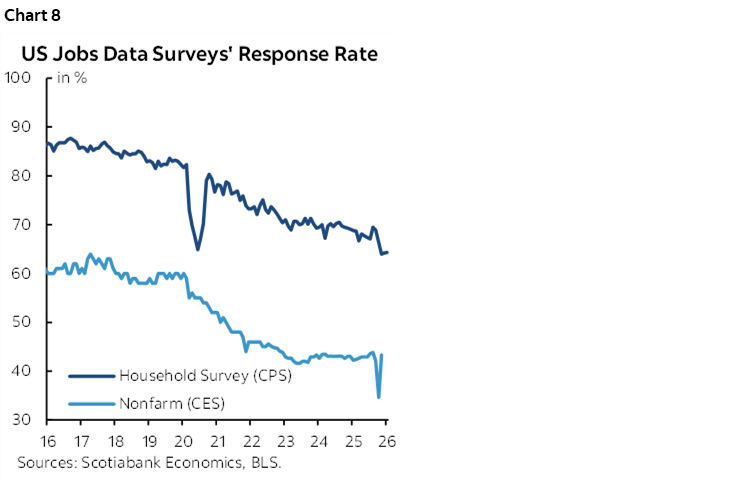
For one thing, the BLS said that severe weather impaired collection of household survey data and pushed that survey’s response rate to 64.3% which was below average (chart 8).
For another, the 90% confidence band around the household survey’s estimate of the change in the number of unemployed is +/- 425,000. That means that the estimated -141k drop in the number of unemployed Americans last month was somewhere between -566k and +424k at the 10% level of significance. Right. The statistical confidence in the change in unemployment basically covers a decent sized US city of about 1 million people.
Third, as the BLS noted in the previous release for December, the annual incorporation of revised population counts that would have normally been incorporated in this month’s household survey won’t be incorporated until next month’s report. This adds to data quality question marks until we see that effort. For now, the household survey uses short-term projections of monthly population estimates derived from population adjustments “introduced in January 2025 (based on Vintage 2024 population estimates.” They go on to say “As soon as practicable, BLS plans to revise January 2026 estimates to incorporate the updated population controls.”
This could be key to qualifying the reported change in the UR and its drivers. A whole year’s worth of tighter immigration policy that was introduced after the January 2025 population counts before inauguration day may not be adequately reflected in today’s numbers.
OTHER DETAILS
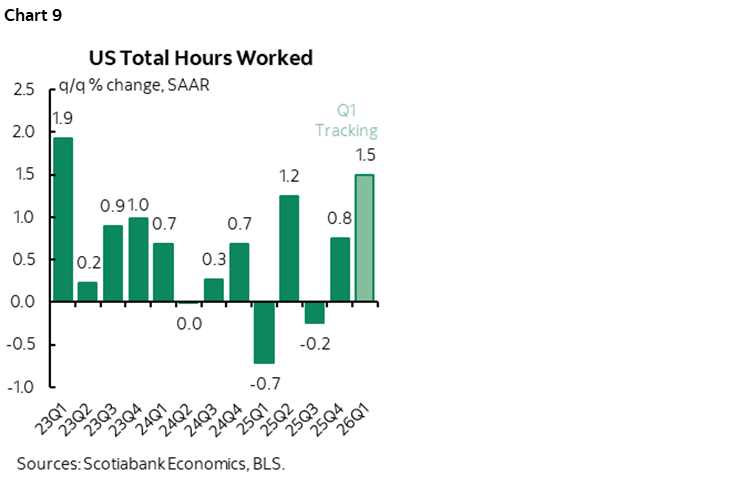
The US had better keep up productivity growth. Hours worked were up only 0.8% q/q SAAR in Q4. They are very tentatively tracking 1.5% in Q1 based only on Jan and the Q4 average. GDP is hours worked times labour productivity (chart 9).
Wage growth was 0.4% m/m SA last month but revised down from 0.3% to 0.1% m/m in December. The result left the y/y rate unchanged at 3.7%. Chart 10 shows annualized m/m seasonally adjusted wage growth.
DISCLAIMER
This report has been prepared by Scotiabank Economics as a resource for the clients of Scotiabank. Opinions, estimates and projections contained herein are our own as of the date hereof and are subject to change without notice. The information and opinions contained herein have been compiled or arrived at from sources believed reliable but no representation or warranty, express or implied, is made as to their accuracy or completeness. Neither Scotiabank nor any of its officers, directors, partners, employees or affiliates accepts any liability whatsoever for any direct or consequential loss arising from any use of this report or its contents.
These reports are provided to you for informational purposes only. This report is not, and is not constructed as, an offer to sell or solicitation of any offer to buy any financial instrument, nor shall this report be construed as an opinion as to whether you should enter into any swap or trading strategy involving a swap or any other transaction. The information contained in this report is not intended to be, and does not constitute, a recommendation of a swap or trading strategy involving a swap within the meaning of U.S. Commodity Futures Trading Commission Regulation 23.434 and Appendix A thereto. This material is not intended to be individually tailored to your needs or characteristics and should not be viewed as a “call to action” or suggestion that you enter into a swap or trading strategy involving a swap or any other transaction. Scotiabank may engage in transactions in a manner inconsistent with the views discussed this report and may have positions, or be in the process of acquiring or disposing of positions, referred to in this report.
Scotiabank, its affiliates and any of their respective officers, directors and employees may from time to time take positions in currencies, act as managers, co-managers or underwriters of a public offering or act as principals or agents, deal in, own or act as market makers or advisors, brokers or commercial and/or investment bankers in relation to securities or related derivatives. As a result of these actions, Scotiabank may receive remuneration. All Scotiabank products and services are subject to the terms of applicable agreements and local regulations. Officers, directors and employees of Scotiabank and its affiliates may serve as directors of corporations.
Any securities discussed in this report may not be suitable for all investors. Scotiabank recommends that investors independently evaluate any issuer and security discussed in this report, and consult with any advisors they deem necessary prior to making any investment.
This report and all information, opinions and conclusions contained in it are protected by copyright. This information may not be reproduced without the prior express written consent of Scotiabank.
™ Trademark of The Bank of Nova Scotia. Used under license, where applicable.
Scotiabank, together with “Global Banking and Markets”, is a marketing name for the global corporate and investment banking and capital markets businesses of The Bank of Nova Scotia and certain of its affiliates in the countries where they operate, including; Scotiabank Europe plc; Scotiabank (Ireland) Designated Activity Company; Scotiabank Inverlat S.A., Institución de Banca Múltiple, Grupo Financiero Scotiabank Inverlat, Scotia Inverlat Casa de Bolsa, S.A. de C.V., Grupo Financiero Scotiabank Inverlat, Scotia Inverlat Derivados S.A. de C.V. – all members of the Scotiabank group and authorized users of the Scotiabank mark. The Bank of Nova Scotia is incorporated in Canada with limited liability and is authorised and regulated by the Office of the Superintendent of Financial Institutions Canada. The Bank of Nova Scotia is authorized by the UK Prudential Regulation Authority and is subject to regulation by the UK Financial Conduct Authority and limited regulation by the UK Prudential Regulation Authority. Details about the extent of The Bank of Nova Scotia's regulation by the UK Prudential Regulation Authority are available from us on request. Scotiabank Europe plc is authorized by the UK Prudential Regulation Authority and regulated by the UK Financial Conduct Authority and the UK Prudential Regulation Authority.
Scotiabank Inverlat, S.A., Scotia Inverlat Casa de Bolsa, S.A. de C.V, Grupo Financiero Scotiabank Inverlat, and Scotia Inverlat Derivados, S.A. de C.V., are each authorized and regulated by the Mexican financial authorities.
Not all products and services are offered in all jurisdictions. Services described are available in jurisdictions where permitted by law.