- Canada’s economy flatlined in November…
- ...and slightly picked up in December, leaving a weak Q4 behind
- Weather, strikes, macro drivers messed up Q4 in Canada
- It’s unclear whether Q4 was weaker than the BoC expected…
- …but who cares, as they have faded history in favour of being forward looking
- Core US producer prices skyrocketed; core PCE to land between 0.2–0.3% m/m…
- ...that when annualized reveals ongoing residual inflation risk
- Markets faded data behind Warsh headlines
- Canadian GDP, m/m % SA, November:
- Actual: 0.0
- Scotia: 0.1
- Consensus: 0.1
- Prior: -0.3
- December prelim flash: 0.1
Canada’s economy limped into year-end. Reading why it did so is a convoluted mess of macro drivers, weather, and strikes. It’s unclear if the numbers would mildly surprise the BoC which has strongly signalled it’s looking through what was and toward what may be on the bias that expects something better in 2026. Time and data will test this, but today’s batch had little to offer to the narrative.
GDP came in flat in November (actually -0.02% m/m) against Statcan’s preliminary guidance that was offered a month ago that indicated mild growth of 0.1% which consensus had gone with. That’s a mild miss.
December GDP is guided to have increased by 0.1% m/m SA sans details other than verbal guidance that “Increases in manufacturing and wholesale trade were partially offset by decreases in mining, quarrying, and oil and gas extraction.”
What this gives us is Q4 tracking GDP growth of -0.5% q/q SAAR using the production-side GDP accounts (chart 1).
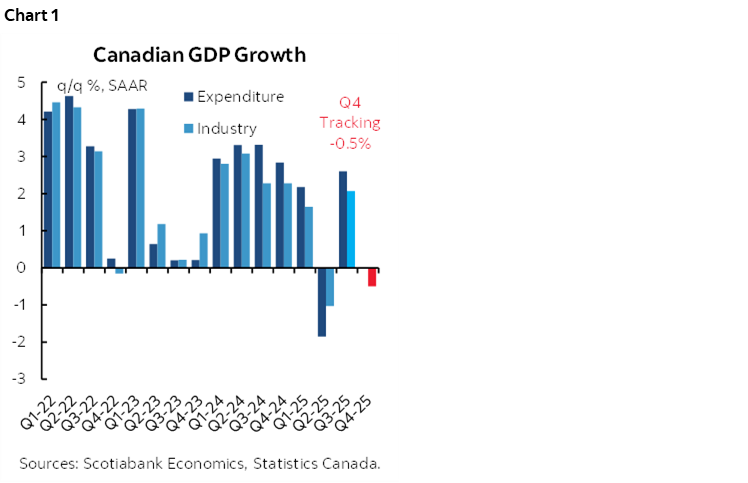
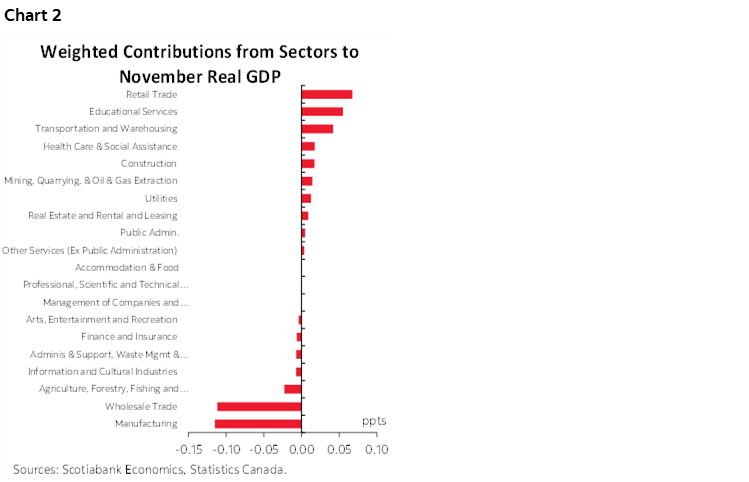
Chart 2 breaks down which sectors drove November’s flat GDP reading.
Is that a surprise to the BoC? Maybe, maybe not. They forecast 0% Q4 GDP growth, but their forecast is based upon a different set of expenditure-based GDP accounts. Expenditure-based GDP accounts more fully capture the reasons behind production shifts, such as inventory effects.
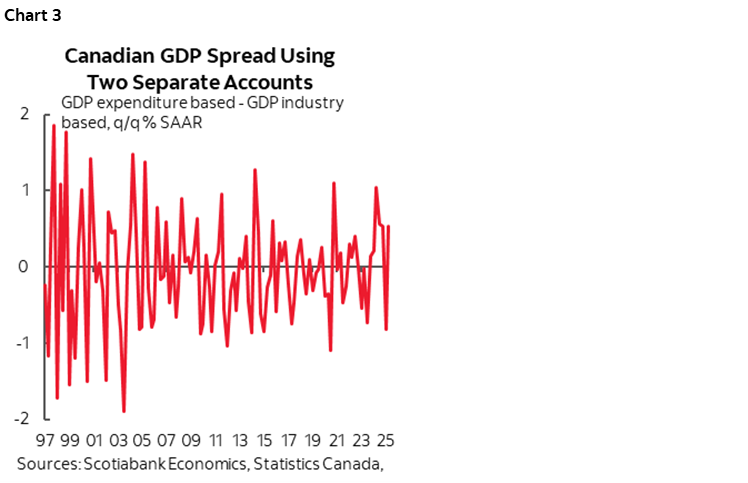
Historically there has often been a meaningful divergence between the two measures of GDP growth—one using monthly production-based GDP converted to quarterly, the other using quarterly expenditure-based GDP. Chart 3 shows the historical spread. It is not at all uncommon to have significant deviations between the measures of a half percentage point or more.
Therefore one cannot say with confidence that the measure of GDP that most forecasters including the BoC follow shrank by –0.5% in Q4. That remains to be determined. It could have shrunk by more, or less, or not at all within reasonable margins.
Ergo, the BoC wouldn’t so much as bat an eye at these figures. They faded history in Wednesday’s communications in favour of a forward bias that expected a rebound in GDP this year amid bidirectional rate uncertainty that signaled a long pause as they sift through data and developments.
US PRODUCER PRICES RUDELY WELCOMED WARSH
The US data was more interesting in my opinion. Welcome to Day One (of the nomination), Mr. Warsh.
Core producer prices excluding food and energy soared by the most since July. They were up by 0.7% m/m SA which was a full half point above consensus.
Total producer prices were up by less (0.5%) but still more than doubled consensus (0.2%). Food and energy weighed against core prices.
One key is how higher core producer prices may flow through to consumer prices based on incidence effects that are uncertain. Plus it’s just one month.
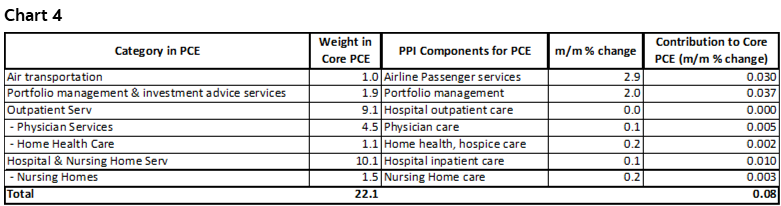
Another key is how the PPI data flows into the Fed’s preferred inflation reading—core PCE. Several PPI categories are included in PCE. Chart 4 shows that their weighted contributions add to a lift of about 0.1% m/m in core PCE inflation with rounding up.
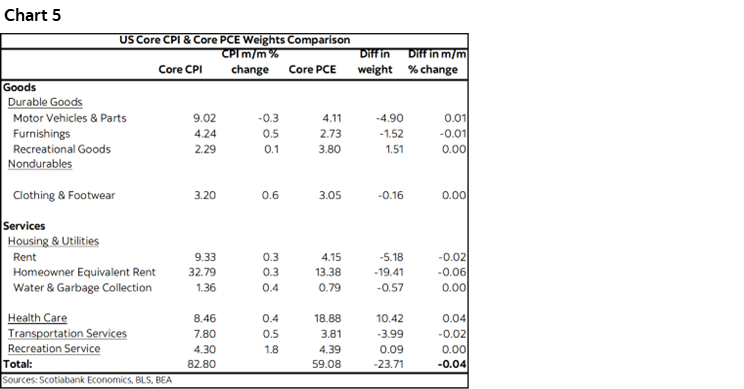
Recall that core CPI was up by 0.2%. Accounting for weighting differences between CPI and PCE is shown in chart 5 to shave only –0.04ppts off of 0.2% core CPI when translated to PCE. The combined effects of how core CPI translates into PCE alongside core PPI’s effects lean toward a 0.2–0.3% m/m core PCE reading that we won’t get until February 20th. When annualized, that would reveal a core PCE m/m SAAR reading above the 2% headline PCE target in a sign that residual inflation risk persists.
DISCLAIMER
This report has been prepared by Scotiabank Economics as a resource for the clients of Scotiabank. Opinions, estimates and projections contained herein are our own as of the date hereof and are subject to change without notice. The information and opinions contained herein have been compiled or arrived at from sources believed reliable but no representation or warranty, express or implied, is made as to their accuracy or completeness. Neither Scotiabank nor any of its officers, directors, partners, employees or affiliates accepts any liability whatsoever for any direct or consequential loss arising from any use of this report or its contents.
These reports are provided to you for informational purposes only. This report is not, and is not constructed as, an offer to sell or solicitation of any offer to buy any financial instrument, nor shall this report be construed as an opinion as to whether you should enter into any swap or trading strategy involving a swap or any other transaction. The information contained in this report is not intended to be, and does not constitute, a recommendation of a swap or trading strategy involving a swap within the meaning of U.S. Commodity Futures Trading Commission Regulation 23.434 and Appendix A thereto. This material is not intended to be individually tailored to your needs or characteristics and should not be viewed as a “call to action” or suggestion that you enter into a swap or trading strategy involving a swap or any other transaction. Scotiabank may engage in transactions in a manner inconsistent with the views discussed this report and may have positions, or be in the process of acquiring or disposing of positions, referred to in this report.
Scotiabank, its affiliates and any of their respective officers, directors and employees may from time to time take positions in currencies, act as managers, co-managers or underwriters of a public offering or act as principals or agents, deal in, own or act as market makers or advisors, brokers or commercial and/or investment bankers in relation to securities or related derivatives. As a result of these actions, Scotiabank may receive remuneration. All Scotiabank products and services are subject to the terms of applicable agreements and local regulations. Officers, directors and employees of Scotiabank and its affiliates may serve as directors of corporations.
Any securities discussed in this report may not be suitable for all investors. Scotiabank recommends that investors independently evaluate any issuer and security discussed in this report, and consult with any advisors they deem necessary prior to making any investment.
This report and all information, opinions and conclusions contained in it are protected by copyright. This information may not be reproduced without the prior express written consent of Scotiabank.
™ Trademark of The Bank of Nova Scotia. Used under license, where applicable.
Scotiabank, together with “Global Banking and Markets”, is a marketing name for the global corporate and investment banking and capital markets businesses of The Bank of Nova Scotia and certain of its affiliates in the countries where they operate, including; Scotiabank Europe plc; Scotiabank (Ireland) Designated Activity Company; Scotiabank Inverlat S.A., Institución de Banca Múltiple, Grupo Financiero Scotiabank Inverlat, Scotia Inverlat Casa de Bolsa, S.A. de C.V., Grupo Financiero Scotiabank Inverlat, Scotia Inverlat Derivados S.A. de C.V. – all members of the Scotiabank group and authorized users of the Scotiabank mark. The Bank of Nova Scotia is incorporated in Canada with limited liability and is authorised and regulated by the Office of the Superintendent of Financial Institutions Canada. The Bank of Nova Scotia is authorized by the UK Prudential Regulation Authority and is subject to regulation by the UK Financial Conduct Authority and limited regulation by the UK Prudential Regulation Authority. Details about the extent of The Bank of Nova Scotia's regulation by the UK Prudential Regulation Authority are available from us on request. Scotiabank Europe plc is authorized by the UK Prudential Regulation Authority and regulated by the UK Financial Conduct Authority and the UK Prudential Regulation Authority.
Scotiabank Inverlat, S.A., Scotia Inverlat Casa de Bolsa, S.A. de C.V, Grupo Financiero Scotiabank Inverlat, and Scotia Inverlat Derivados, S.A. de C.V., are each authorized and regulated by the Mexican financial authorities.
Not all products and services are offered in all jurisdictions. Services described are available in jurisdictions where permitted by law.