- Q4 GDP was weak…
- ...because of the biggest inventory drawdown in three years
- The domestic economy posted impressive growth…
- ...aided by export growth
- Q1 GDP is tracking a rebound
- The BoC was likely to ignore GDP no matter what…
- ...and more so now given what’s under the hood
- Q4 GDP, q/q SAAR %:
- Actual: -0.6
- Scotia: -0.5
- Consensus: -0.2
- Prior: 2.4 (revised from 2.6)
- GDP m/m % SA, December:
- Actual: 0.24
- Scotia: 0.1
- Consensus: 0.1
- Prior: 0.0
- January ‘flash’ estimate: “essentially unchanged”
My instant reaction in client-focused chat rooms upon seeing these numbers was that they were much better than expected because of the details. Headlines dwelled on the GDP contraction of –0.6% q/q at a seasonally adjusted and annualized rate (SAAR). That placed emphasis upon the wrong thing from a Bank of Canada standpoint. Markets generally understood the points that followed because there was very little reaction in bonds and CAD.
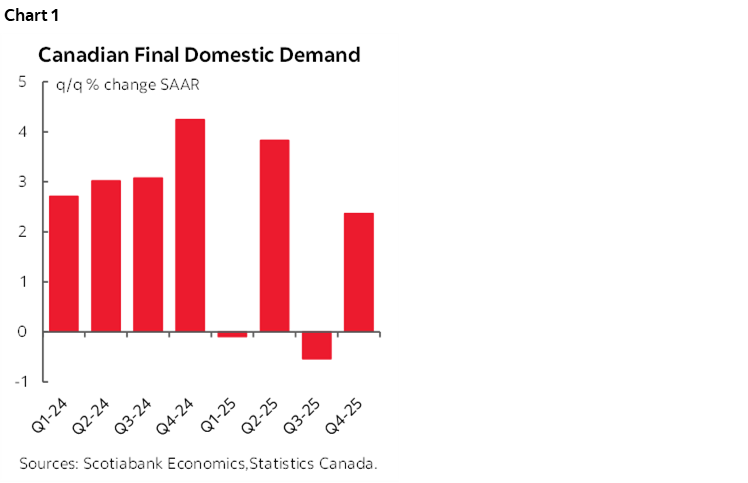
Key is that final domestic demand was strong which adds consumption plus investment plus government spending. That was up by 2.3% q/q SAAR in Q4 for the strongest gain since 2025Q2 (chart 1). It’s a better gauge of strength in the domestic economy over which monetary policy has greater influence.
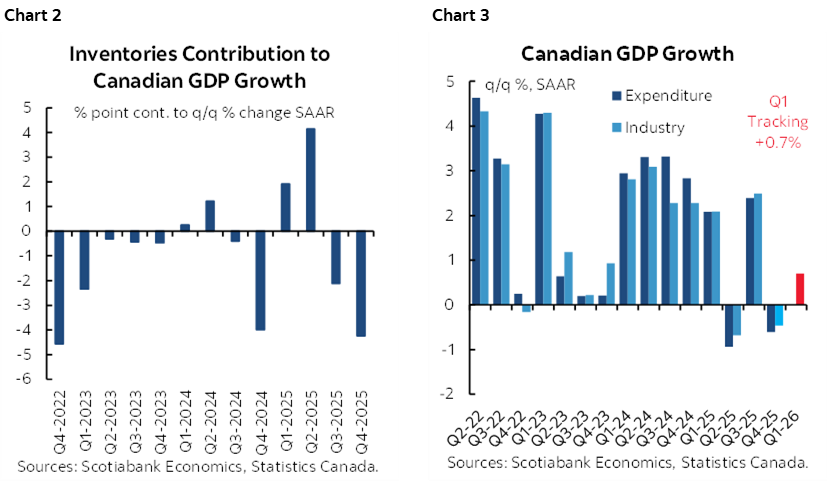
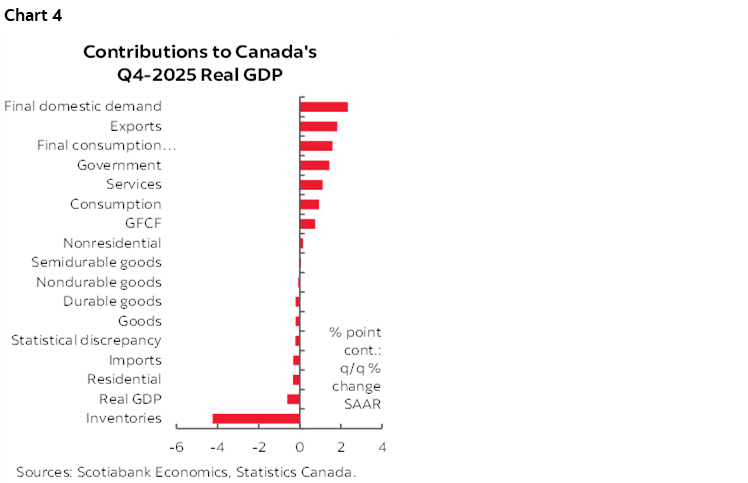
What explained the gulf between GDP and FDD? The biggest inventory drawdown in three years. Inventories drove a whopping 4.2 percentage point drag on GDP growth which is the biggest inventory drawdown effect since 2022Q4 (chart 2). Therefore, chart 3 provides a misleading depiction of what’s going on in the Canadian economy.
What drove FDD? Chart 4 breaks things down in terms of weighted contributions to GDP growth.
Consumer spending added 0.9 ppts to GDP growth through higher services spending that added 1.11 ppts to growth versus a –0.2 ppts drag from goods spending. Chart 5.
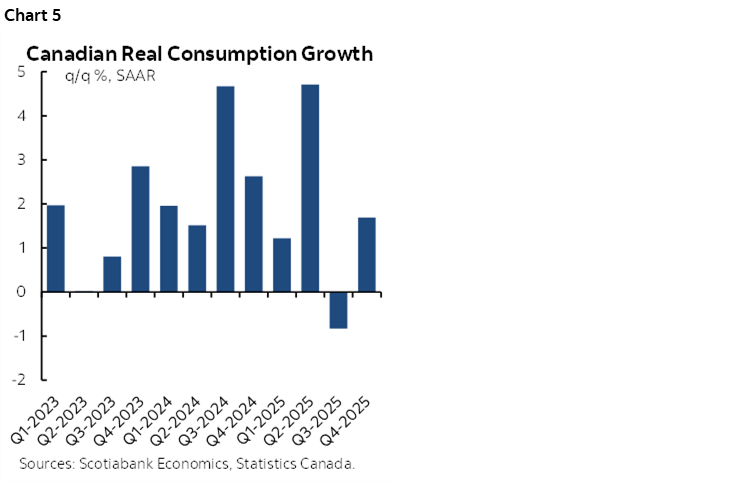
Investment by businesses added 0.2 ppts to growth as investment in structures subtracted –0.2 ppts but investment in equipment added 0.35 ppts.
Exports added a whopping 1.8 ppts to growth.
Higher imports subtracted 0.3 ppts since GDP accounting treats that as a leakage effect.
Government played a significant role. Government current spending added 0.66 ppts to growth while government cap-ex added 0.8 ppts (chart 6). Government haters will pounce on this as an illusory sign of strength in the economy. Those same people are often the ones beseeching government to spend more on defence and infrastructure. You can’t have it both ways, folks. And note that Statcan specifically noted that the government cap-ex line was “driven by increased investment in weapons systems.” Canada fell behind on infrastructure, major projects and defence and now that it’s contributing to growth you can’t complain about it.
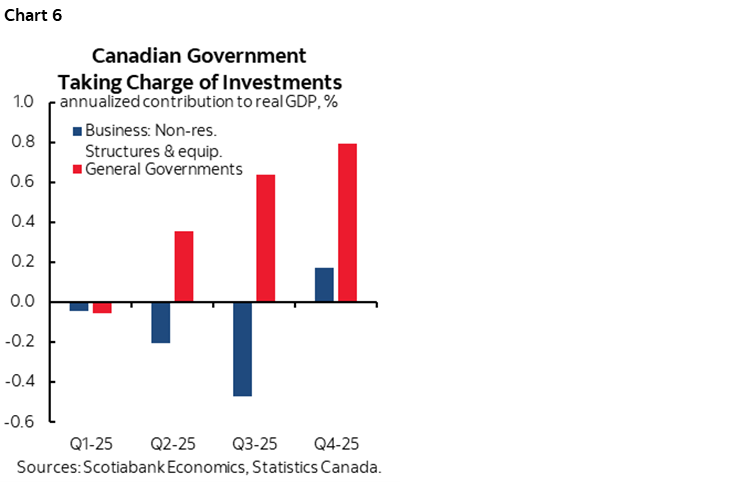
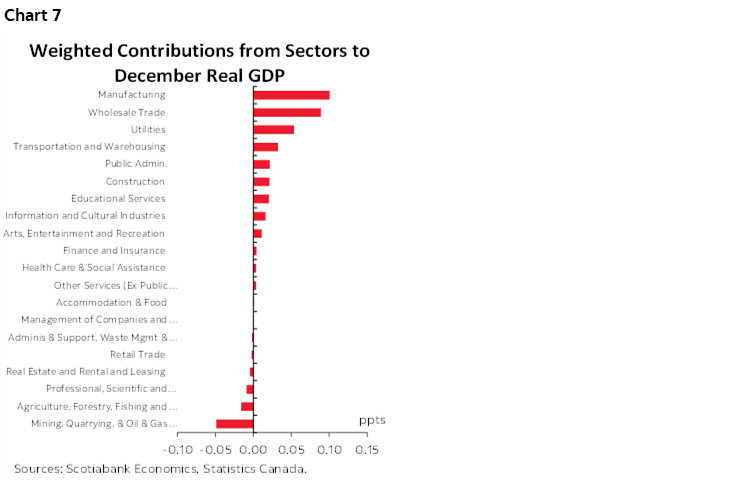
Chart 7 breaks down weighted contributions to December GDP growth of 0.24% m/m SA. Manufacturing was the single biggest positive contribution followed by the wholesale sector that is also related to trade. Note that transportation and warehousing—also related to trade—is fourth on the list of weighted contributions to growth.
As for Q1 tracking, it presently sits at about 0.7% q/q SAAR using the Q4 average of monthly GDP figures and the January estimate while assuming no change in February and March in order to focus the math on the knowns. This is using production/income side GDP accounts.
Expenditure-based quarterly GDP accounts—which is how the BoC and the street forecast—could well be tracking stronger in Q1 on the view that the inventory drag in Q4 could give way to some inventory replenishment. The BoC’s 1.8% q/q SAAR Q1 GDP forecast could well be within reach, though it’s too early to tell.
So what would the Bank of Canada think overall? Q4 GDP of –0.6% was weaker than their January MPR forecast (0%) but when disappointment is due to things like inventories while final domestic demand is strong they tend to fade it. They’ll want to see how Q1 evolves but so far they’re probably pretty happy about the preliminary evidence.
In short, the BoC is very likely to retain its patient messaging. It was likely to do that regardless of this morning’s numbers in any event since it is focused upon long-tailed developments across supply and demand channels that only time and a lot of data will inform pending material further information on things like trade negotiations that will take a long time to unfold.
DISCLAIMER
This report has been prepared by Scotiabank Economics as a resource for the clients of Scotiabank. Opinions, estimates and projections contained herein are our own as of the date hereof and are subject to change without notice. The information and opinions contained herein have been compiled or arrived at from sources believed reliable but no representation or warranty, express or implied, is made as to their accuracy or completeness. Neither Scotiabank nor any of its officers, directors, partners, employees or affiliates accepts any liability whatsoever for any direct or consequential loss arising from any use of this report or its contents.
These reports are provided to you for informational purposes only. This report is not, and is not constructed as, an offer to sell or solicitation of any offer to buy any financial instrument, nor shall this report be construed as an opinion as to whether you should enter into any swap or trading strategy involving a swap or any other transaction. The information contained in this report is not intended to be, and does not constitute, a recommendation of a swap or trading strategy involving a swap within the meaning of U.S. Commodity Futures Trading Commission Regulation 23.434 and Appendix A thereto. This material is not intended to be individually tailored to your needs or characteristics and should not be viewed as a “call to action” or suggestion that you enter into a swap or trading strategy involving a swap or any other transaction. Scotiabank may engage in transactions in a manner inconsistent with the views discussed this report and may have positions, or be in the process of acquiring or disposing of positions, referred to in this report.
Scotiabank, its affiliates and any of their respective officers, directors and employees may from time to time take positions in currencies, act as managers, co-managers or underwriters of a public offering or act as principals or agents, deal in, own or act as market makers or advisors, brokers or commercial and/or investment bankers in relation to securities or related derivatives. As a result of these actions, Scotiabank may receive remuneration. All Scotiabank products and services are subject to the terms of applicable agreements and local regulations. Officers, directors and employees of Scotiabank and its affiliates may serve as directors of corporations.
Any securities discussed in this report may not be suitable for all investors. Scotiabank recommends that investors independently evaluate any issuer and security discussed in this report, and consult with any advisors they deem necessary prior to making any investment.
This report and all information, opinions and conclusions contained in it are protected by copyright. This information may not be reproduced without the prior express written consent of Scotiabank.
™ Trademark of The Bank of Nova Scotia. Used under license, where applicable.
Scotiabank, together with “Global Banking and Markets”, is a marketing name for the global corporate and investment banking and capital markets businesses of The Bank of Nova Scotia and certain of its affiliates in the countries where they operate, including; Scotiabank Europe plc; Scotiabank (Ireland) Designated Activity Company; Scotiabank Inverlat S.A., Institución de Banca Múltiple, Grupo Financiero Scotiabank Inverlat, Scotia Inverlat Casa de Bolsa, S.A. de C.V., Grupo Financiero Scotiabank Inverlat, Scotia Inverlat Derivados S.A. de C.V. – all members of the Scotiabank group and authorized users of the Scotiabank mark. The Bank of Nova Scotia is incorporated in Canada with limited liability and is authorised and regulated by the Office of the Superintendent of Financial Institutions Canada. The Bank of Nova Scotia is authorized by the UK Prudential Regulation Authority and is subject to regulation by the UK Financial Conduct Authority and limited regulation by the UK Prudential Regulation Authority. Details about the extent of The Bank of Nova Scotia's regulation by the UK Prudential Regulation Authority are available from us on request. Scotiabank Europe plc is authorized by the UK Prudential Regulation Authority and regulated by the UK Financial Conduct Authority and the UK Prudential Regulation Authority.
Scotiabank Inverlat, S.A., Scotia Inverlat Casa de Bolsa, S.A. de C.V, Grupo Financiero Scotiabank Inverlat, and Scotia Inverlat Derivados, S.A. de C.V., are each authorized and regulated by the Mexican financial authorities.
Not all products and services are offered in all jurisdictions. Services described are available in jurisdictions where permitted by law.