- CPI inflation was weaker than expected
- Core measures conflicted again as BoC’s review reassesses which ones are best
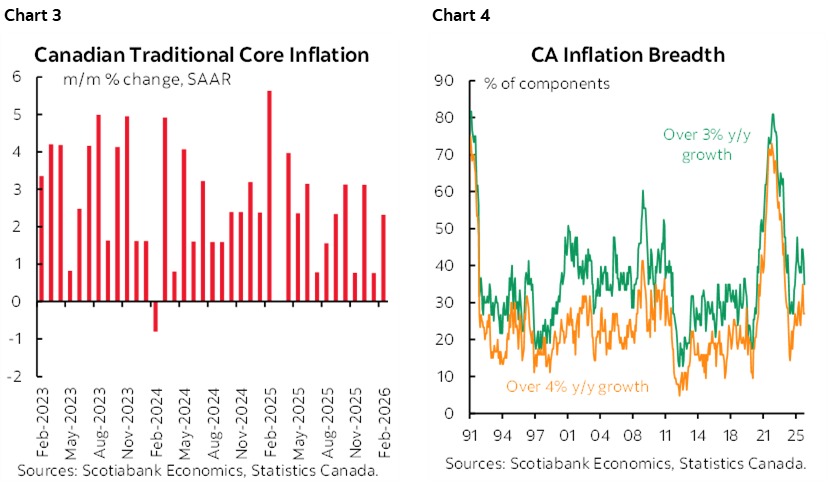
- Breadth of inflation pressures eased off somewhat
- Next month’s headline CPI will surge and do so again in April
- Key to the BoC is the permanence of the oil shock…
- ...and how it transmits through core…
- ...as empirical questions that will take time and data to answer while on hold
- Canadian CPI m/m % / y/y %, NSA, February:
- Actual: 0.5 / 1.8
- Scotia: 0.9 / 2.1
- Consensus: 0.7 / 1.9
- Prior: 0.0 / 2.3
- Trimmed mean CPI m/m % SAAR: 0.6 (prior unrevised from 1.1%)
- Weighted median CPI m/m % SAAR: 1.6 (prior unrevised from 1.6%)
- Traditional core ex-food & energy % SAAR: 2.3 (prior 0.8 revised from 1.5%)
The rearview mirror showed inflation undershooting expectations in February, ‘February’ being the operative word here. The readings are as stale as week old bread sitting on the discount shelf and headed for the pigeons. Core measures conflicted once again, while the breadth of price pressures eased off somewhat. The rally in bond yields should be more focused upon future risks to the inflation outlook.
FIRST, THE DETAILS
Headline CPI was up by just 0.5% m/m seasonally unadjusted, or 0.1% m/m SA. The year-over-year rate ebbed to 1.8% from 2.3% previously and with the expiration of the temporary GST cut after mid-February 2025 contributing to this morning’s weaker year-over-year figure. The BoC will look through that effect.
The two keys were further evidence of soft core inflation (charts 1–3) and weaker breadth (chart 4) but with a big caveat on the former point.
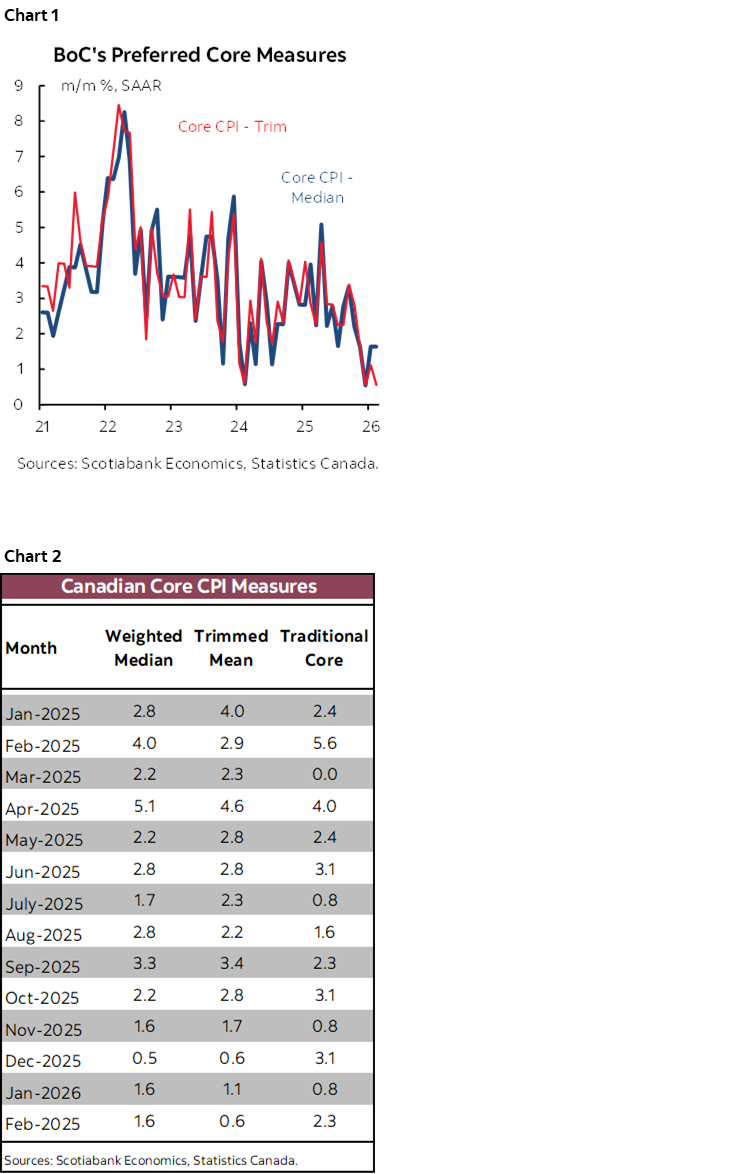
That caveat involves guesswork around what measure of core inflation is best. Our house research argues traditional core is best. The BoC has in the past published research saying the central tendency measures of core (trimmed mean and weighted median) are best, while press conferences emphasize a flexible approach that looks at everything. BoC guidance points to core measures being reevaluated in this year’s 5-year review and with possibly more added.
This matters because traditional core CPI (ex-food and energy) was up by 2.3% m/m SAAR which isn’t light, but follows a downwardly revised reading of 0.8% m/m SAAR in January from 1.5% previously. The three-month moving average of traditional core CPI is 2.1% m/m SAAR.
And yet trimmed mean CPI was just 0.6% m/m SAAR for a three-month moving average of 0.7%. Weighted median CPI was just 1.6% m/m SAAR for a three-month MA of 1.3%.
So what’s going on with core inflation? It depends, it seems, on which measure the BoC prefers.
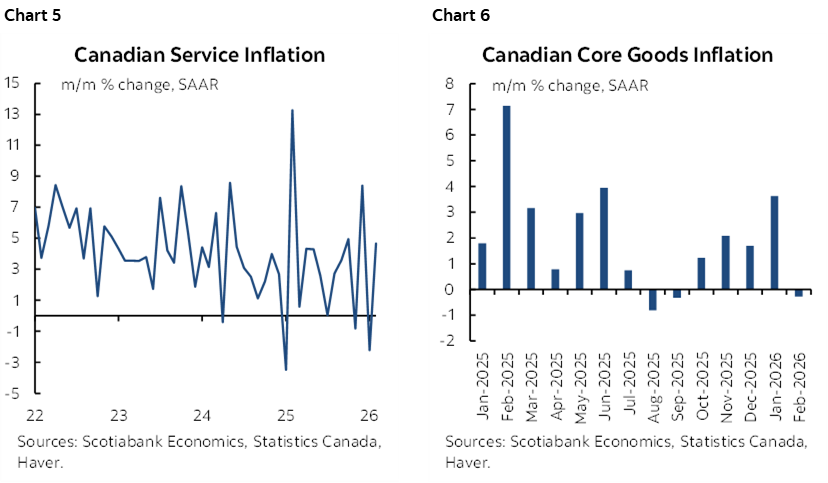
Chart 5 shows that services inflation accelerated and chart 6 shows that core goods inflation decelerated, both behaving as directionally expected but on net by less than expected.
WHAT DOES THE FUTURE HOLD?
Regardless, the BoC will be more intensely focused upon forward-looking inflation risks as follows. Assessing them will take time for a central bank that is likely to be in data watch mode for an extended period while doing nothing at least for several meetings.
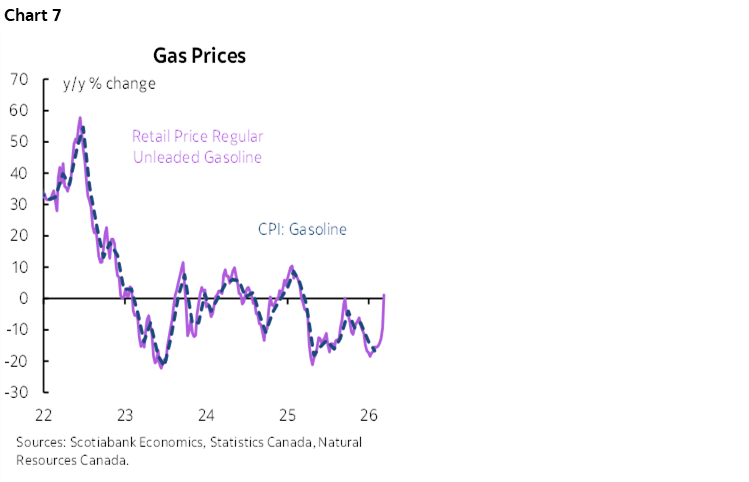
1. How much upside to headline inflation might arrive and for how long? The magnitude of the oil price increase and its effects on energy components within CPI (gasoline, home heating) could give rise to a 0.75–1% lift to inflation if moderately persistent over time based on the rule of thumb that each $10 lift gives a few tenths of upside. In the nearer term, I figure that next month's (March) inflation reading will get about a 0.5 ppt lift to the y/y rate from gasoline prices based on tracking so far to mid-month (chart 7). All else equal, that would drive the y/y headline CPI rate up toward 2¼%. It will go even higher in April when last April's elimination of the consumer portion of the carbon tax shakes out and that base effect will persist for many months.
2. Will the energy price spike stop there or get passed into core measures and when? A little of it may get passed through in first-round effects but the second-round effects could be more complicated and pointed toward the downside if real wages take a sustained hit. The ultimate outcome will be an empirical question settled by data and that will take time.
3. Canada—being a net energy exporter—gets a positive terms of trade shock from higher energy prices that usually causes hawkish concerns at the BoC. It's a positive imported income shock to broad national income that trickles down into higher incomes in the household, business (retain earnings) and government (improved balances) sectors. That will translate into higher incomes and usually translates into higher spending on net. It would be super unusual if a sustained positive energy shock didn't give rise to higher activity in Canada so be careful with arguments that lean to the contrary to typical experiences for commodity producers. If that happens, then the income effect could lift core inflation pressures independent of the effects of any pass through of higher energy prices into core measures. Again, an empirical question that will take time to assess.
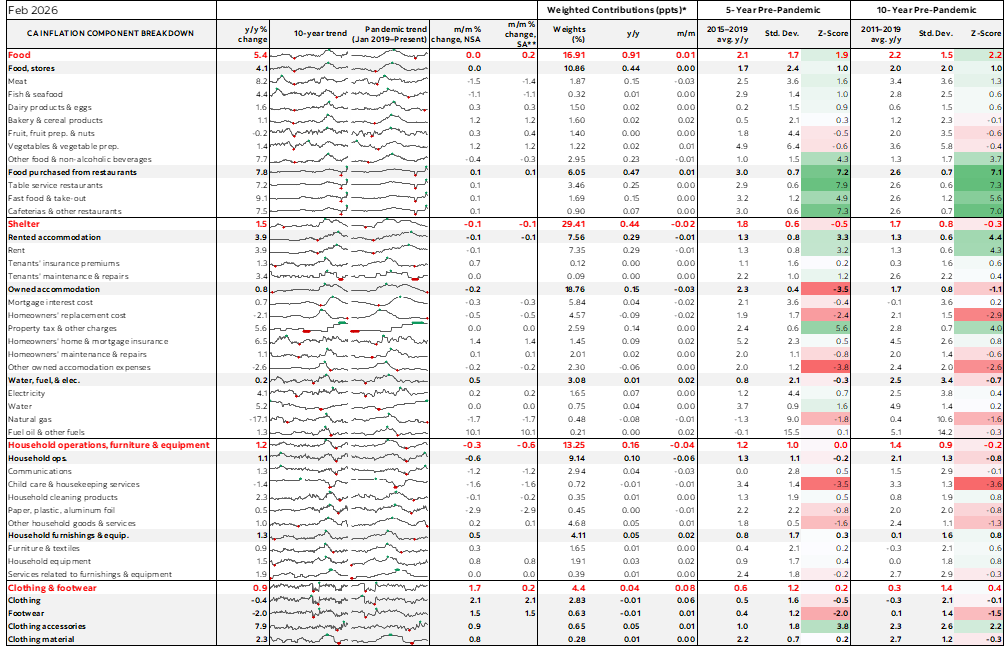
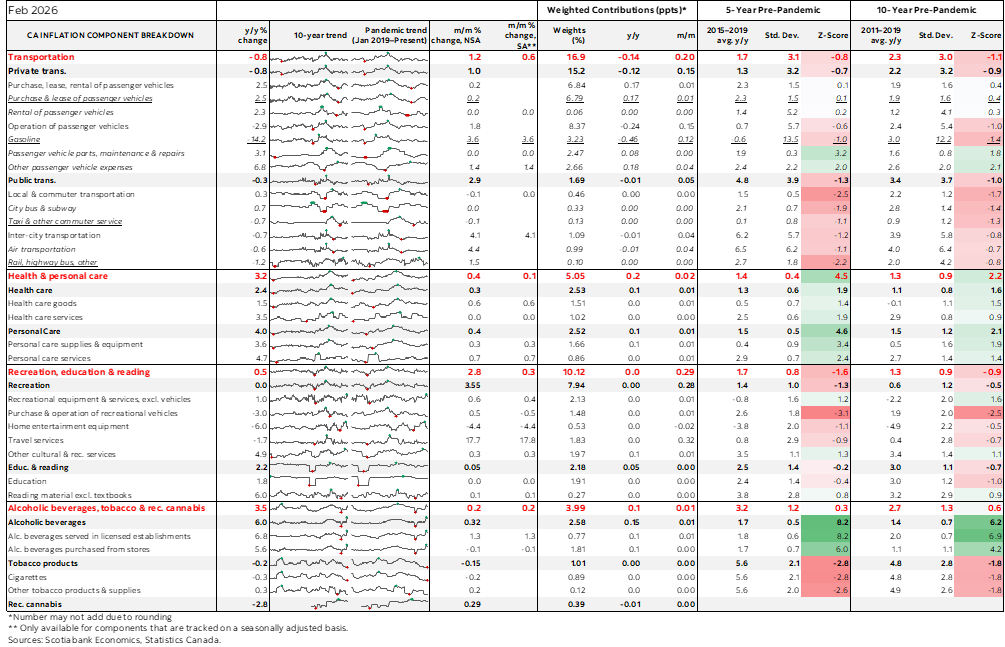
MORE DETAILS!
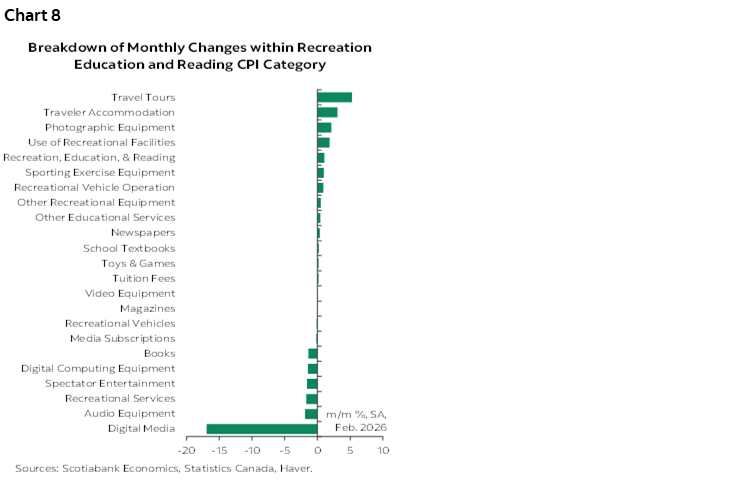
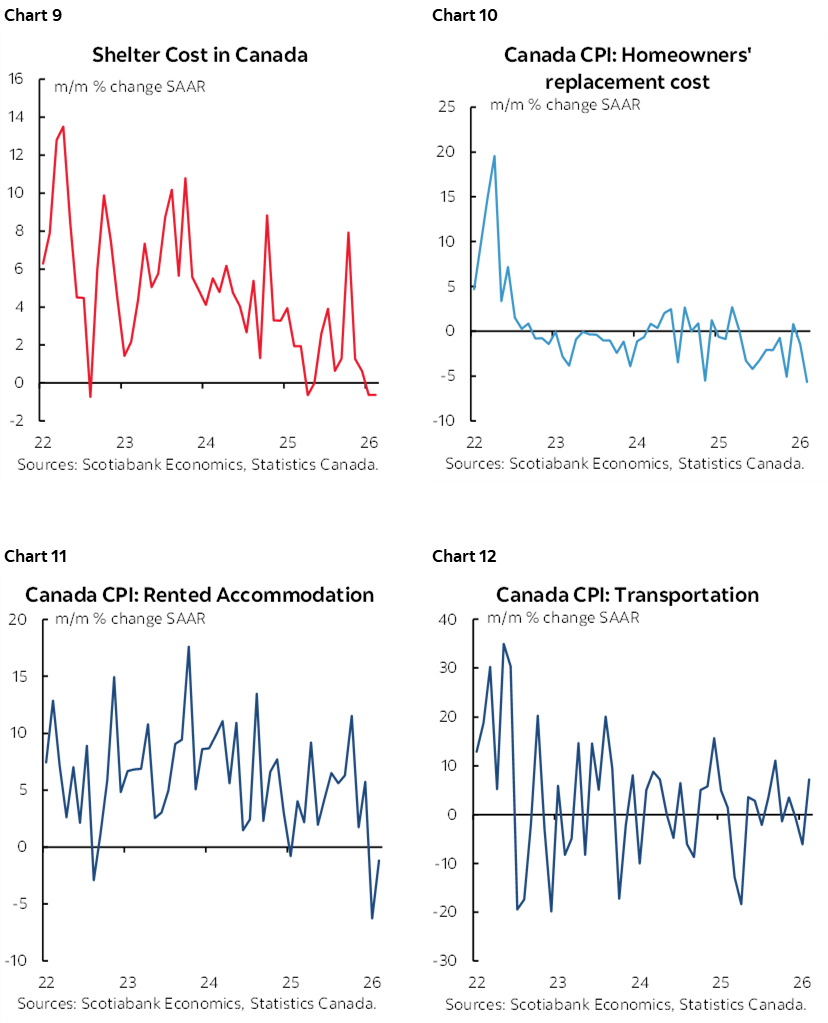
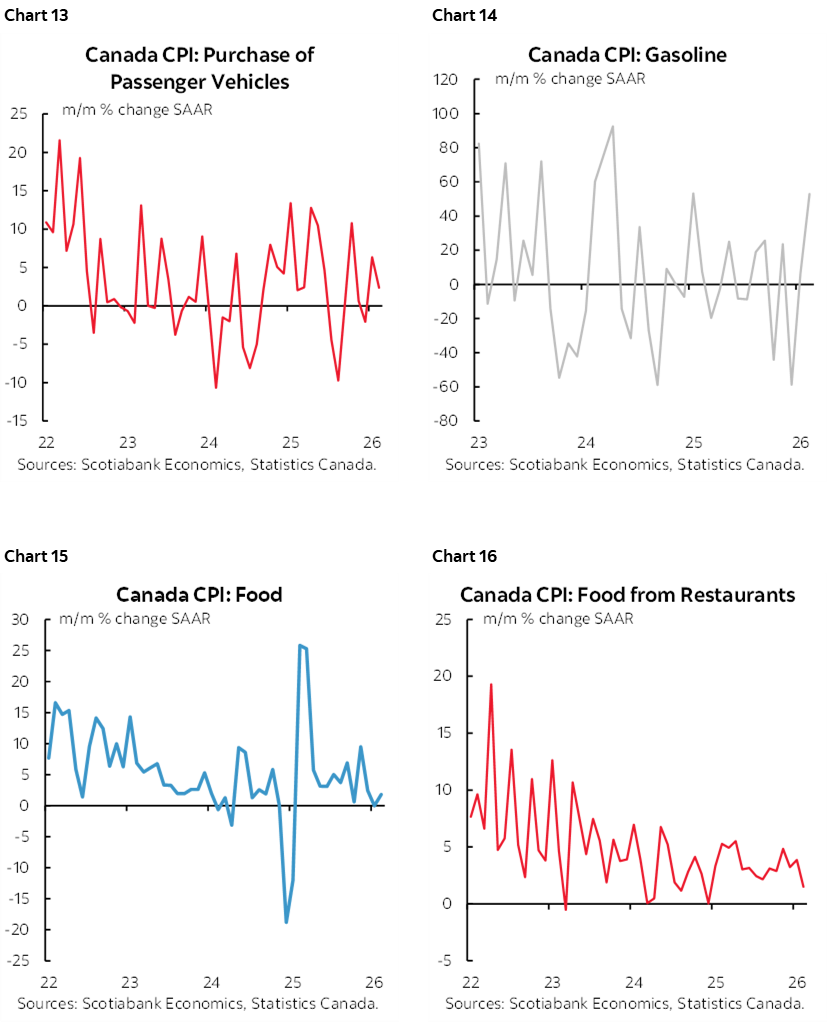
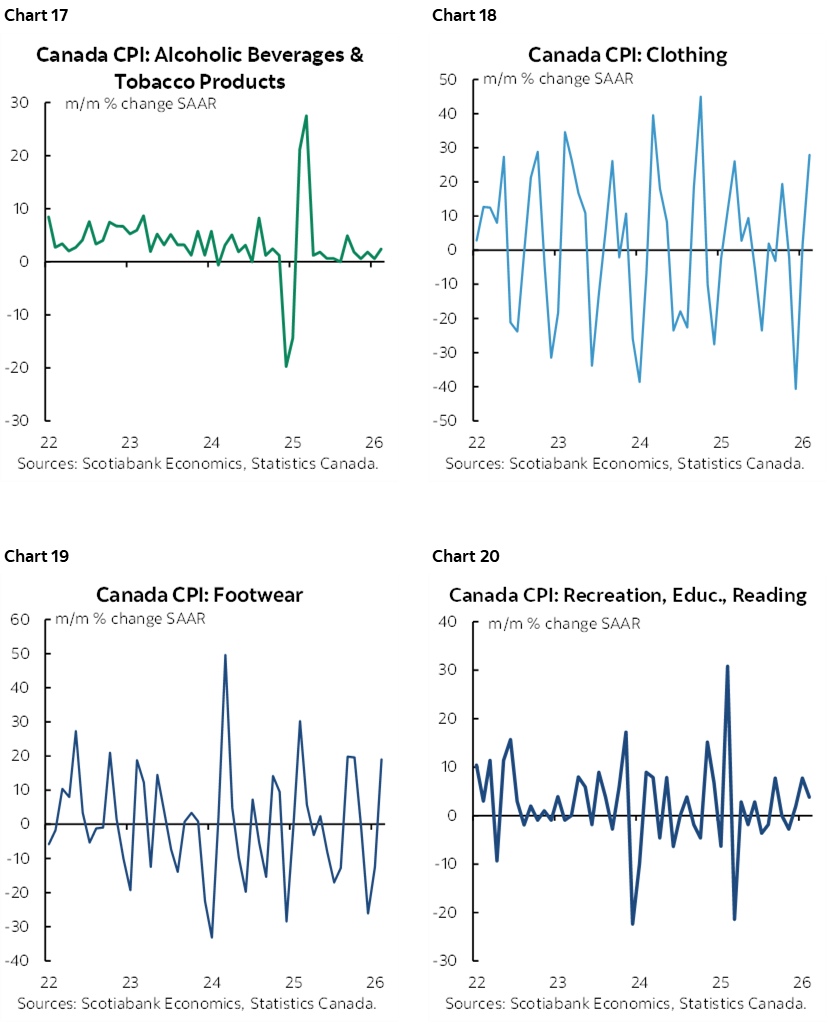
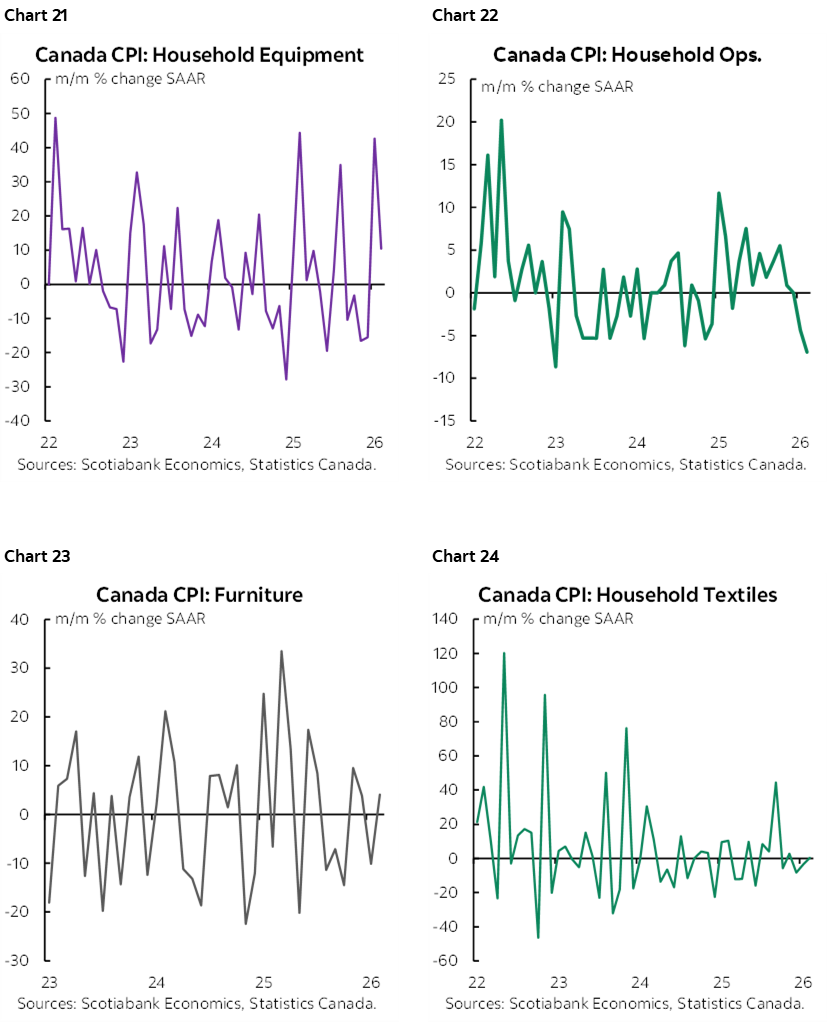
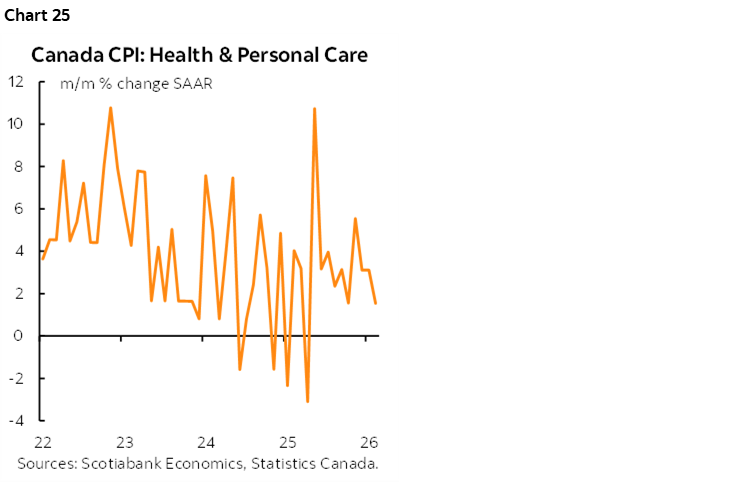
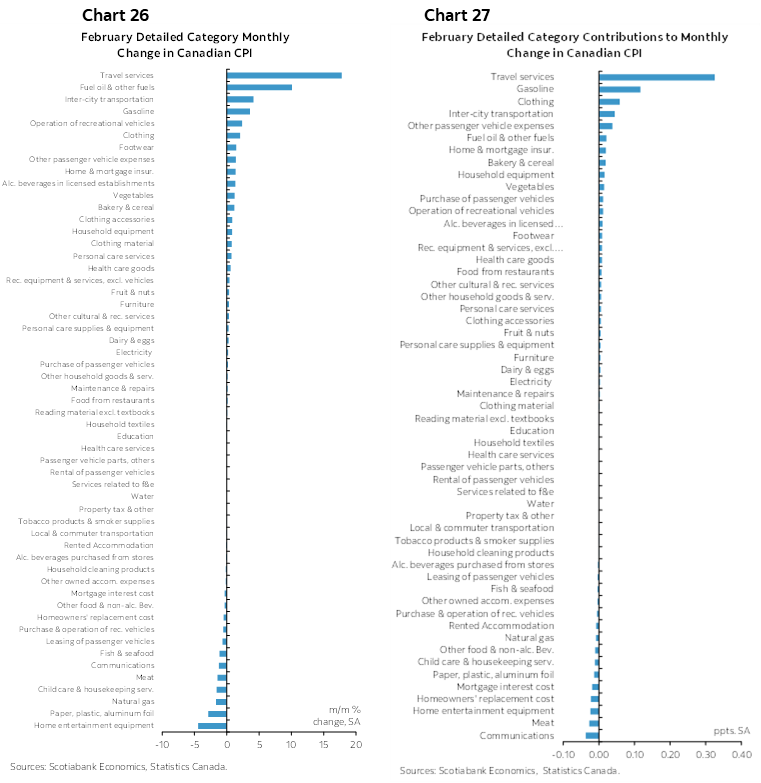
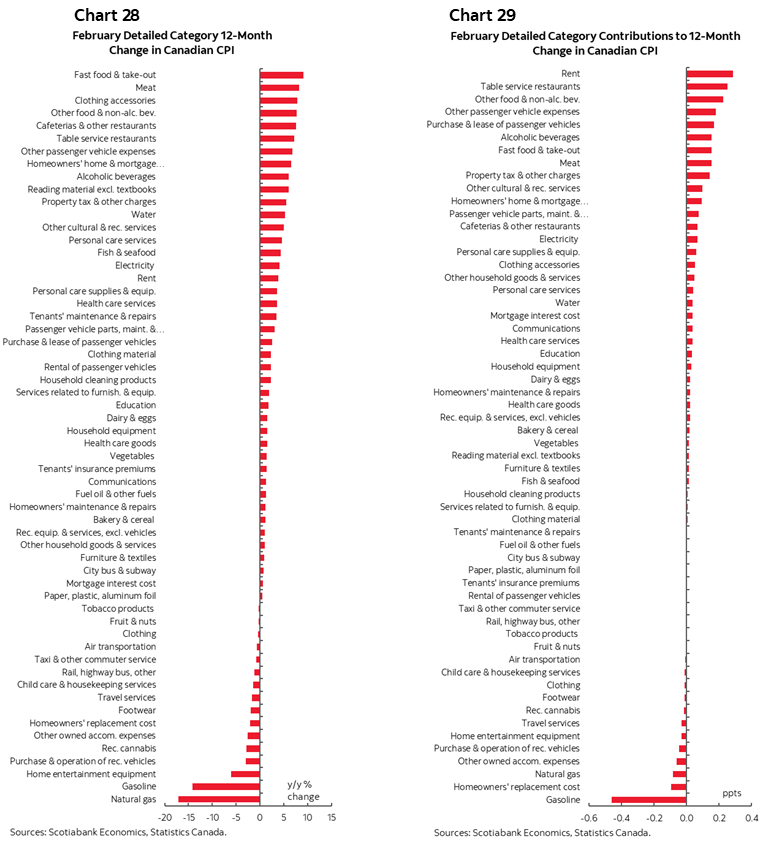
Charts 8–25 break down parts of the CPI basket. Charts 26–27 do likewise in terms of m/m changes and weighted contributions. Charts 28–29 do the same thing with y/y rates. Also see the table showing more details and micro charts.
DISCLAIMER
This report has been prepared by Scotiabank Economics as a resource for the clients of Scotiabank. Opinions, estimates and projections contained herein are our own as of the date hereof and are subject to change without notice. The information and opinions contained herein have been compiled or arrived at from sources believed reliable but no representation or warranty, express or implied, is made as to their accuracy or completeness. Neither Scotiabank nor any of its officers, directors, partners, employees or affiliates accepts any liability whatsoever for any direct or consequential loss arising from any use of this report or its contents.
These reports are provided to you for informational purposes only. This report is not, and is not constructed as, an offer to sell or solicitation of any offer to buy any financial instrument, nor shall this report be construed as an opinion as to whether you should enter into any swap or trading strategy involving a swap or any other transaction. The information contained in this report is not intended to be, and does not constitute, a recommendation of a swap or trading strategy involving a swap within the meaning of U.S. Commodity Futures Trading Commission Regulation 23.434 and Appendix A thereto. This material is not intended to be individually tailored to your needs or characteristics and should not be viewed as a “call to action” or suggestion that you enter into a swap or trading strategy involving a swap or any other transaction. Scotiabank may engage in transactions in a manner inconsistent with the views discussed this report and may have positions, or be in the process of acquiring or disposing of positions, referred to in this report.
Scotiabank, its affiliates and any of their respective officers, directors and employees may from time to time take positions in currencies, act as managers, co-managers or underwriters of a public offering or act as principals or agents, deal in, own or act as market makers or advisors, brokers or commercial and/or investment bankers in relation to securities or related derivatives. As a result of these actions, Scotiabank may receive remuneration. All Scotiabank products and services are subject to the terms of applicable agreements and local regulations. Officers, directors and employees of Scotiabank and its affiliates may serve as directors of corporations.
Any securities discussed in this report may not be suitable for all investors. Scotiabank recommends that investors independently evaluate any issuer and security discussed in this report, and consult with any advisors they deem necessary prior to making any investment.
This report and all information, opinions and conclusions contained in it are protected by copyright. This information may not be reproduced without the prior express written consent of Scotiabank.
™ Trademark of The Bank of Nova Scotia. Used under license, where applicable.
Scotiabank, together with “Global Banking and Markets”, is a marketing name for the global corporate and investment banking and capital markets businesses of The Bank of Nova Scotia and certain of its affiliates in the countries where they operate, including; Scotiabank Europe plc; Scotiabank (Ireland) Designated Activity Company; Scotiabank Inverlat S.A., Institución de Banca Múltiple, Grupo Financiero Scotiabank Inverlat, Scotia Inverlat Casa de Bolsa, S.A. de C.V., Grupo Financiero Scotiabank Inverlat, Scotia Inverlat Derivados S.A. de C.V. – all members of the Scotiabank group and authorized users of the Scotiabank mark. The Bank of Nova Scotia is incorporated in Canada with limited liability and is authorised and regulated by the Office of the Superintendent of Financial Institutions Canada. The Bank of Nova Scotia is authorized by the UK Prudential Regulation Authority and is subject to regulation by the UK Financial Conduct Authority and limited regulation by the UK Prudential Regulation Authority. Details about the extent of The Bank of Nova Scotia's regulation by the UK Prudential Regulation Authority are available from us on request. Scotiabank Europe plc is authorized by the UK Prudential Regulation Authority and regulated by the UK Financial Conduct Authority and the UK Prudential Regulation Authority.
Scotiabank Inverlat, S.A., Scotia Inverlat Casa de Bolsa, S.A. de C.V, Grupo Financiero Scotiabank Inverlat, and Scotia Inverlat Derivados, S.A. de C.V., are each authorized and regulated by the Mexican financial authorities.
Not all products and services are offered in all jurisdictions. Services described are available in jurisdictions where permitted by law.