- Canadian core inflation was weak in November…
- …but the smoothed trend remains warm
- Markets had a very slightly dovish reaction…
- …but the BoC will shake it off for several good reasons
- Canadian CPI m/m % / y/y %, SA, November:
- Actual: 0.1 / 2.2
- Scotia: 0.1 / 2.3
- Consensus: 0.1 / 2.3
- Prior: 0.2 / 2.2
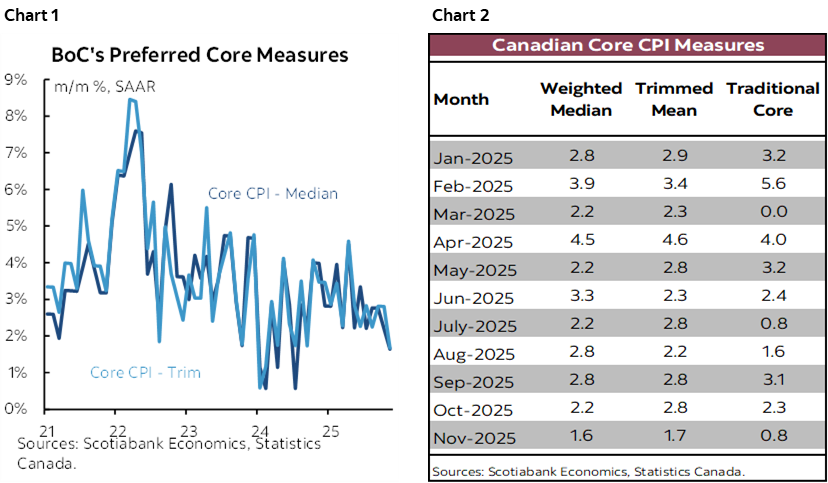
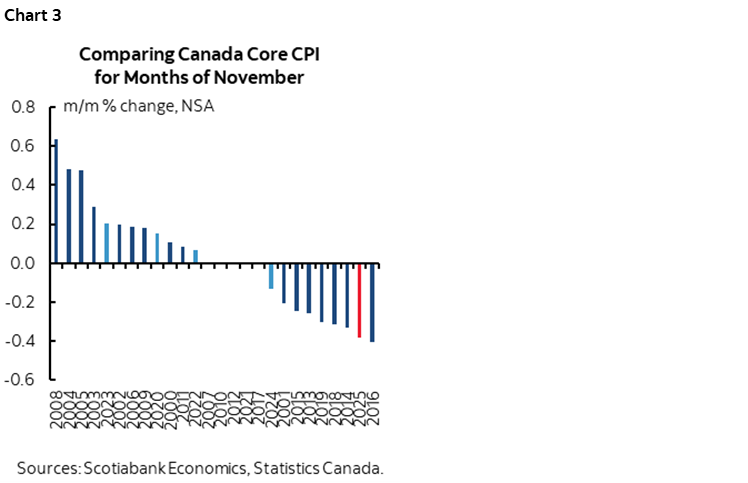
- Trimmed mean CPI m/m % SAAR: 1.7 (prior unrevised from 2.8%)
- Weighted median CPI m/m % SAAR: 1.6 (prior revised up to 2.2% from 1.6%)
- Traditional core ex-food & energy : 0.8 (prior revised to 2.3% from 3.1%)
Canadian core inflation gauges came in softly even as headline CPI roughly matched expectations (charts 1, 2). The trend in core gauges nevertheless remains above 2% in m/m annualized terms, signalling persistent underlying inflationary pressures that will keep the BoC sidelined. Markets reacted by driving a mild rally in Canada 2s that saw the yield drop by about 3bps post-release while USDCAD rose very marginally.
Why it Doesn’t Matter
There are several reasons not to pay much—if any—heed to the figures.
For one, the BoC focuses on trends. So do we. So should you. With the effects of revisions, the 3-month moving averages for traditional core CPI (2.1%), weighted median CPI (2.2% m/m SAAR), and trimmed mean CPI (2.4%) are all on- or slightly above the 2% medium-term headline CPI target. This is basically just one single month of soft core gauges.
For another, there is always notable revision risk primarily as Statcan adjusts SA factors. For instance, this time Statcan revised down traditional core CPI by 0.8 ppts m/m SAAR in October and revised up weighted median CPI by 0.6% m/m SAAR. They are volatile gauges.
Also, there isn’t much to be made of the reading because this is one of two inflation reports before the next Bank of Canada policy decision on January 28th.
Further, monetary policy carries long and variable lags of, say, 12–24 months such that many of the prior rate cuts have not worked through the system yet. You don’t keep easing without giving the lags a chance to work their magic.
There were also large positive GDP revisions that cut down slack estimates and the job market has been ripping with 187k jobs created in the past three months. Fiscal policy across the federal and provincial governments is also at a nascent stage of working through.
The outcome of trade negotiations are anyone’s best guess. I’m maintaining cautious optimism we wind up at a decent spot pre-midterms but along a bumpy path.
Details
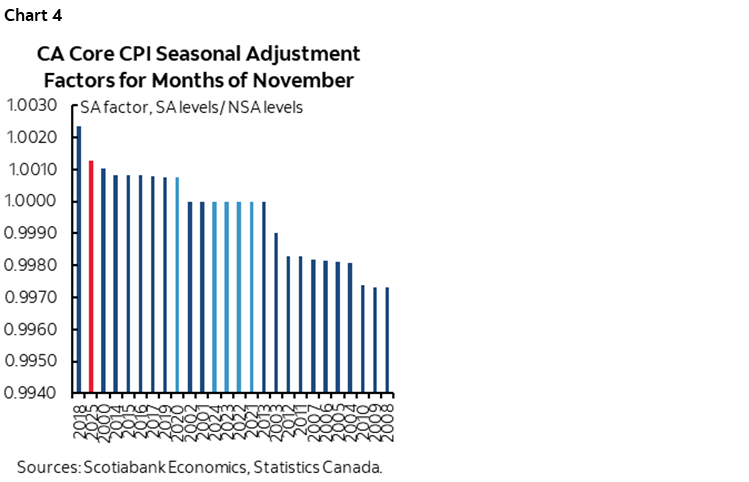
This was one of the softest m/m NSA headline CPI prints on record when comparing like months of November (since it’s not seasonally adjusted). Chart 3.
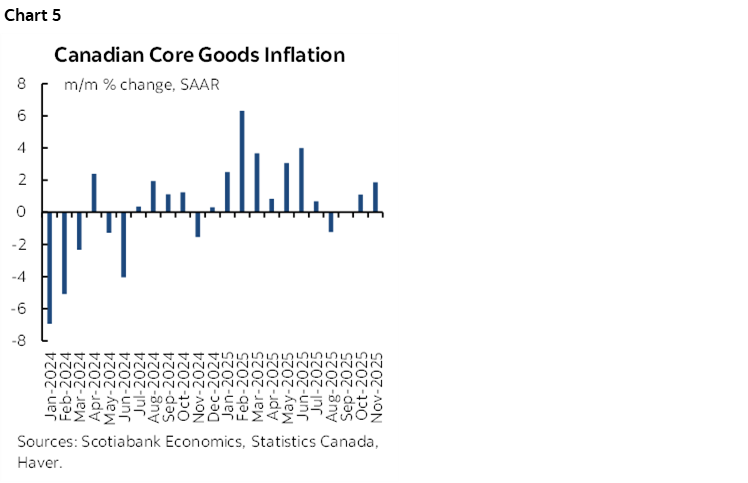
What offset this point is that the seasonal adjustment factor was one of the strongest ever (chart 4).
All of the main core measures were soft. Traditional core CPI ex-food and energy ebbed to 0.8% m/m SAAR from 2.3% the prior month. Trimmed mean CPI was at 1.7% and weighted median equalled 1.6%.
Core goods inflation (ex-food and energy) was fairly contained even though it picked up to the warmest reading in six months (chart 5).
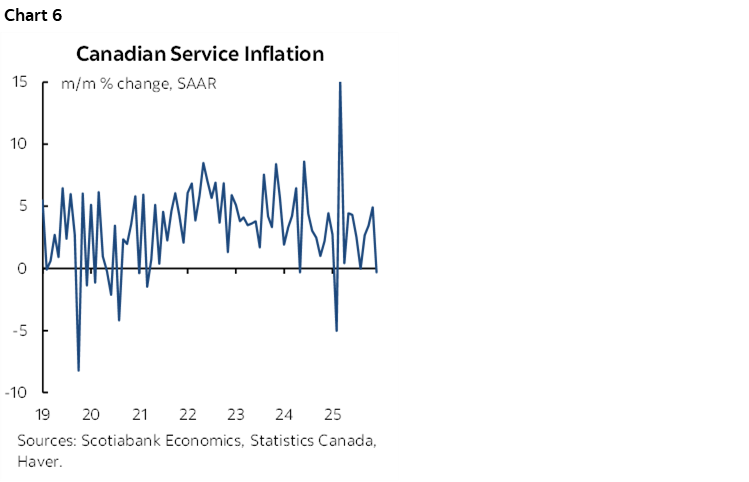
The big story here, however, is that services inflation ebb and continues to be highly volatile (chart 6).
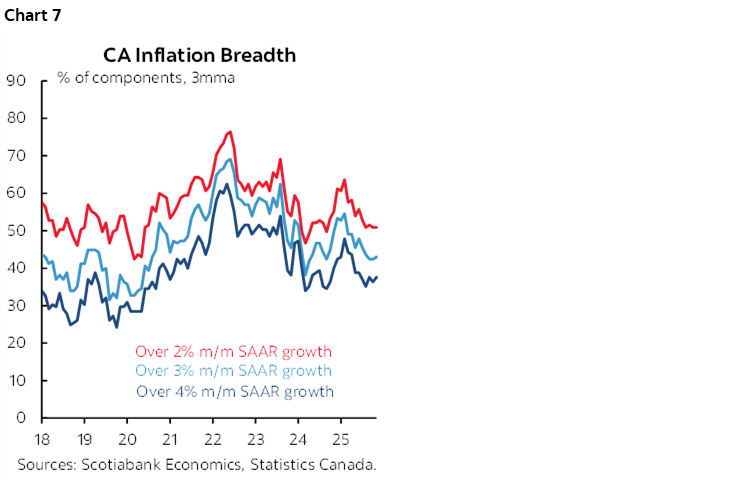
The breadth of price pressures was little changed and still relatively high by historical standards in terms of the share of the basket that is up by 3% y/y or more (chart 7).
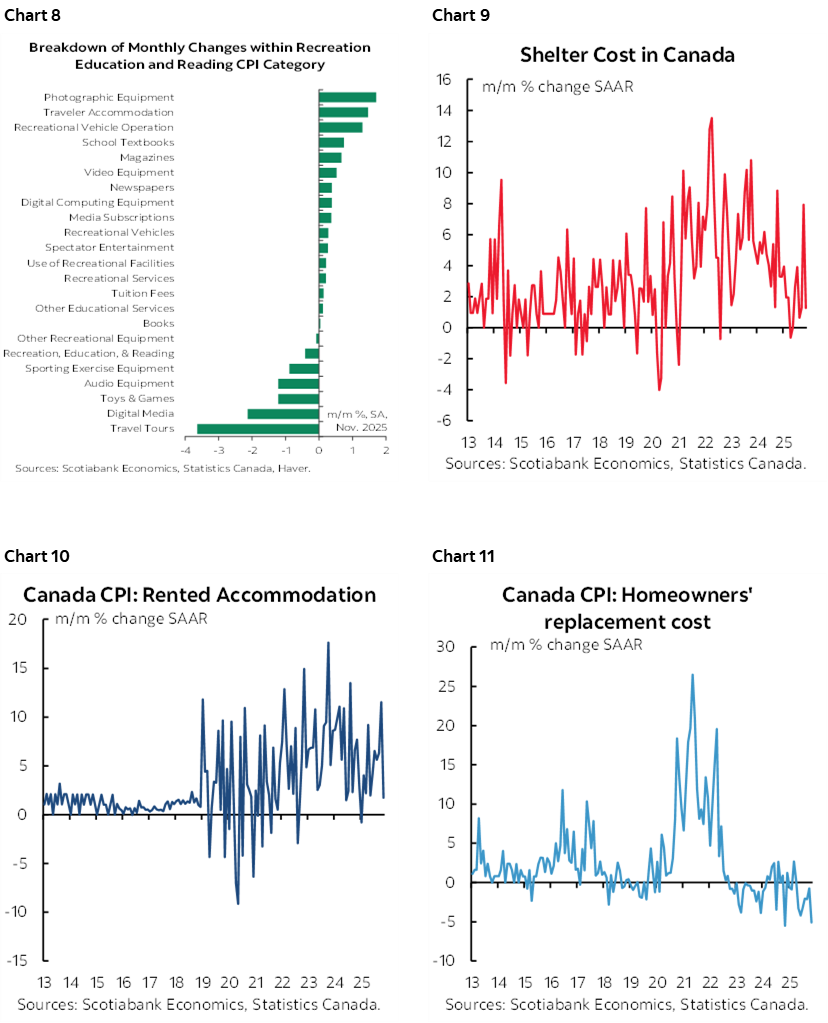
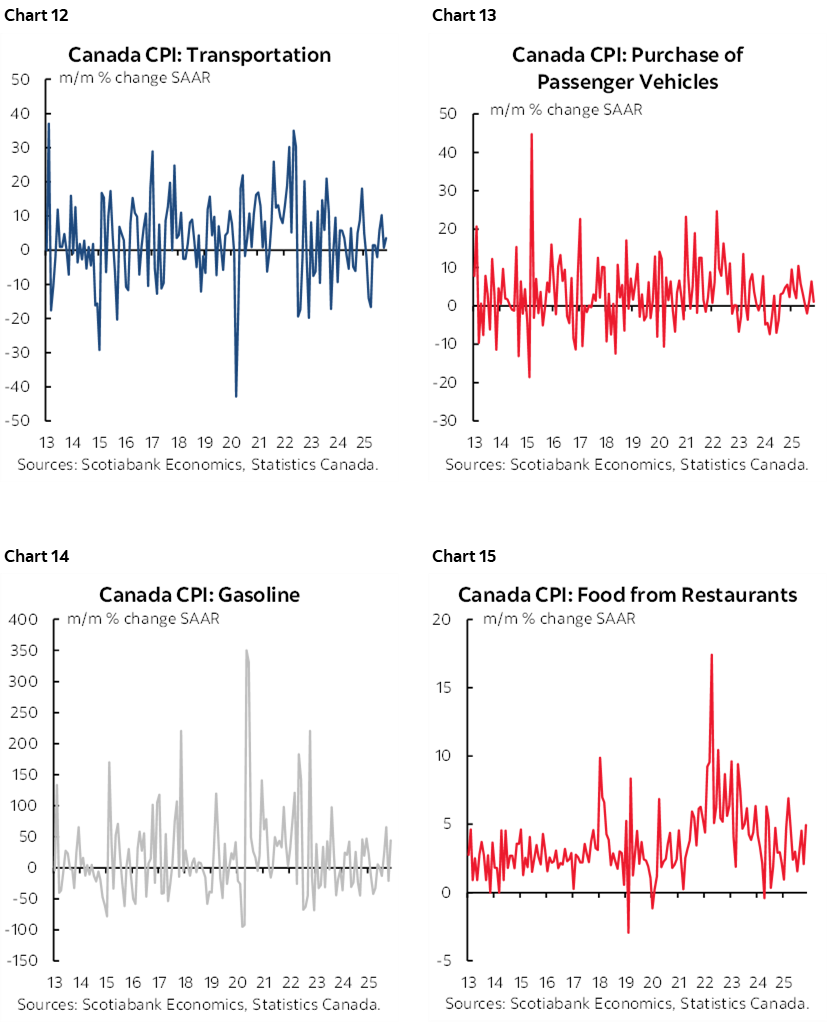
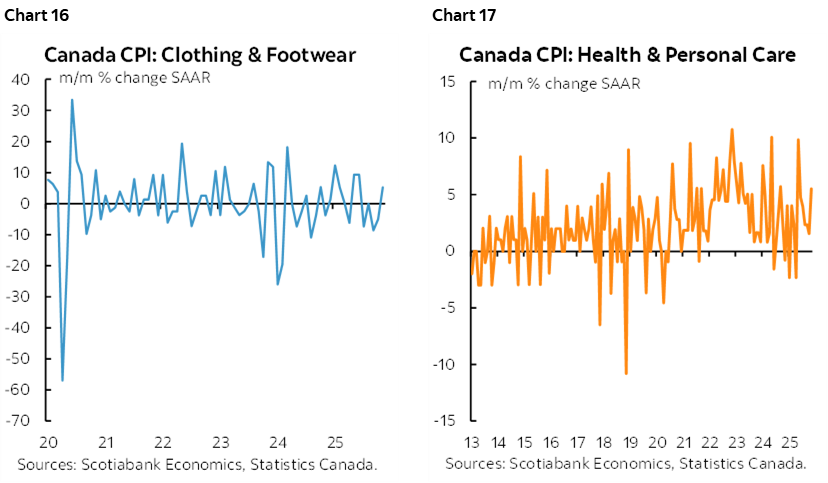
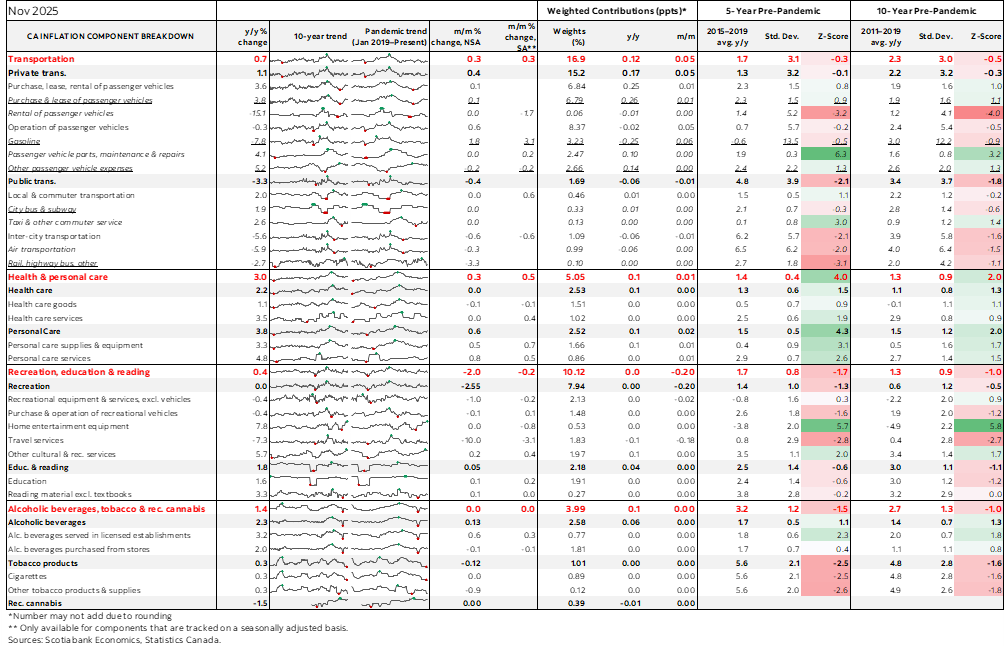
Charts 8–17 show breakdowns of the basket by component.
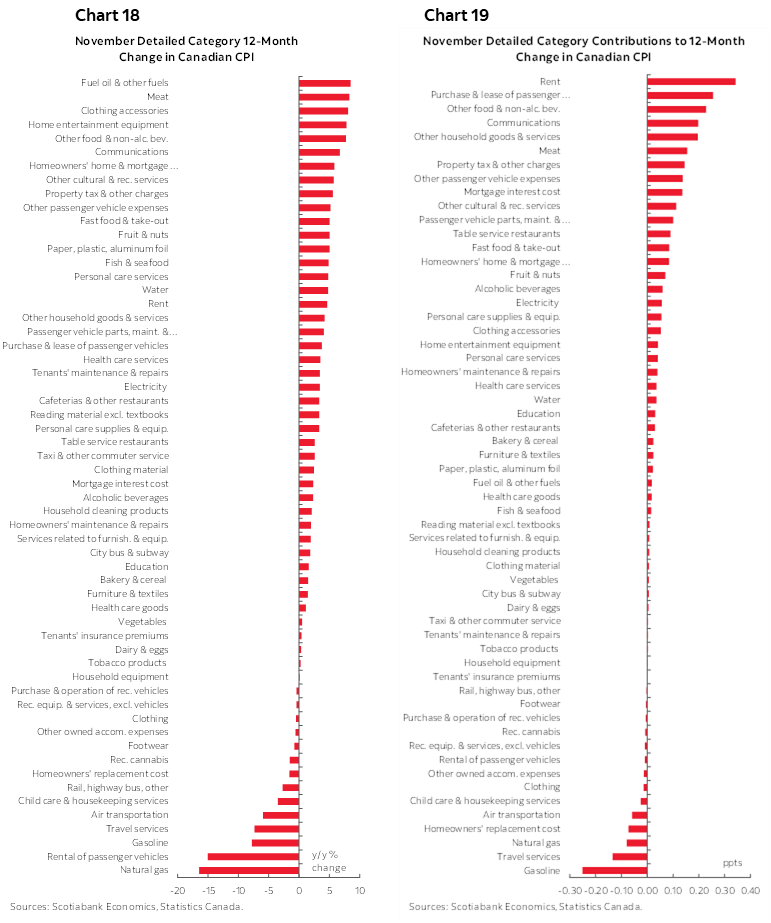
Charts 18–19 show the unweighted changes and weighted contributions by component both in y/y terms.
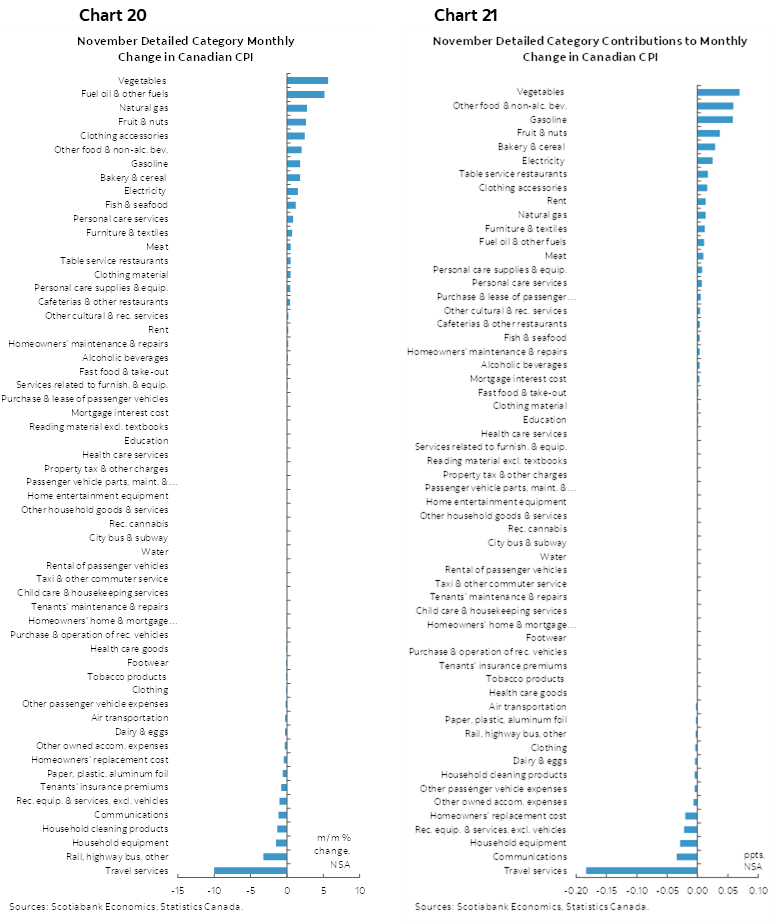
Charts 20–21 do likewise for m/m readings.
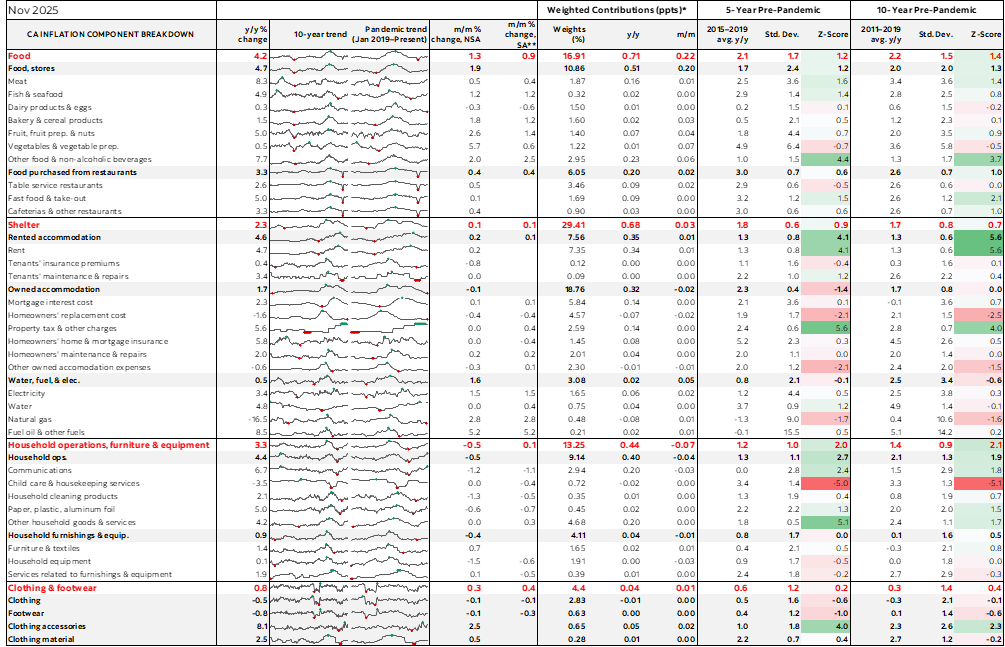
Please also see the accompanying table that provides further details and micro-charts.
DISCLAIMER
This report has been prepared by Scotiabank Economics as a resource for the clients of Scotiabank. Opinions, estimates and projections contained herein are our own as of the date hereof and are subject to change without notice. The information and opinions contained herein have been compiled or arrived at from sources believed reliable but no representation or warranty, express or implied, is made as to their accuracy or completeness. Neither Scotiabank nor any of its officers, directors, partners, employees or affiliates accepts any liability whatsoever for any direct or consequential loss arising from any use of this report or its contents.
These reports are provided to you for informational purposes only. This report is not, and is not constructed as, an offer to sell or solicitation of any offer to buy any financial instrument, nor shall this report be construed as an opinion as to whether you should enter into any swap or trading strategy involving a swap or any other transaction. The information contained in this report is not intended to be, and does not constitute, a recommendation of a swap or trading strategy involving a swap within the meaning of U.S. Commodity Futures Trading Commission Regulation 23.434 and Appendix A thereto. This material is not intended to be individually tailored to your needs or characteristics and should not be viewed as a “call to action” or suggestion that you enter into a swap or trading strategy involving a swap or any other transaction. Scotiabank may engage in transactions in a manner inconsistent with the views discussed this report and may have positions, or be in the process of acquiring or disposing of positions, referred to in this report.
Scotiabank, its affiliates and any of their respective officers, directors and employees may from time to time take positions in currencies, act as managers, co-managers or underwriters of a public offering or act as principals or agents, deal in, own or act as market makers or advisors, brokers or commercial and/or investment bankers in relation to securities or related derivatives. As a result of these actions, Scotiabank may receive remuneration. All Scotiabank products and services are subject to the terms of applicable agreements and local regulations. Officers, directors and employees of Scotiabank and its affiliates may serve as directors of corporations.
Any securities discussed in this report may not be suitable for all investors. Scotiabank recommends that investors independently evaluate any issuer and security discussed in this report, and consult with any advisors they deem necessary prior to making any investment.
This report and all information, opinions and conclusions contained in it are protected by copyright. This information may not be reproduced without the prior express written consent of Scotiabank.
™ Trademark of The Bank of Nova Scotia. Used under license, where applicable.
Scotiabank, together with “Global Banking and Markets”, is a marketing name for the global corporate and investment banking and capital markets businesses of The Bank of Nova Scotia and certain of its affiliates in the countries where they operate, including; Scotiabank Europe plc; Scotiabank (Ireland) Designated Activity Company; Scotiabank Inverlat S.A., Institución de Banca Múltiple, Grupo Financiero Scotiabank Inverlat, Scotia Inverlat Casa de Bolsa, S.A. de C.V., Grupo Financiero Scotiabank Inverlat, Scotia Inverlat Derivados S.A. de C.V. – all members of the Scotiabank group and authorized users of the Scotiabank mark. The Bank of Nova Scotia is incorporated in Canada with limited liability and is authorised and regulated by the Office of the Superintendent of Financial Institutions Canada. The Bank of Nova Scotia is authorized by the UK Prudential Regulation Authority and is subject to regulation by the UK Financial Conduct Authority and limited regulation by the UK Prudential Regulation Authority. Details about the extent of The Bank of Nova Scotia's regulation by the UK Prudential Regulation Authority are available from us on request. Scotiabank Europe plc is authorized by the UK Prudential Regulation Authority and regulated by the UK Financial Conduct Authority and the UK Prudential Regulation Authority.
Scotiabank Inverlat, S.A., Scotia Inverlat Casa de Bolsa, S.A. de C.V, Grupo Financiero Scotiabank Inverlat, and Scotia Inverlat Derivados, S.A. de C.V., are each authorized and regulated by the Mexican financial authorities.
Not all products and services are offered in all jurisdictions. Services described are available in jurisdictions where permitted by law.