- Core CPI is still tracking over double the BoC’s target
- Markets react by retaining a bias toward another hike in January
- CDN CPI m/m % NSA // y/y %, November:
- Actual: 0.1 / 6.8
- Scotia: -0.2 / 6.3
- Consensus: 0.0 / 6.7
- Prior: 0.7 / 6.9
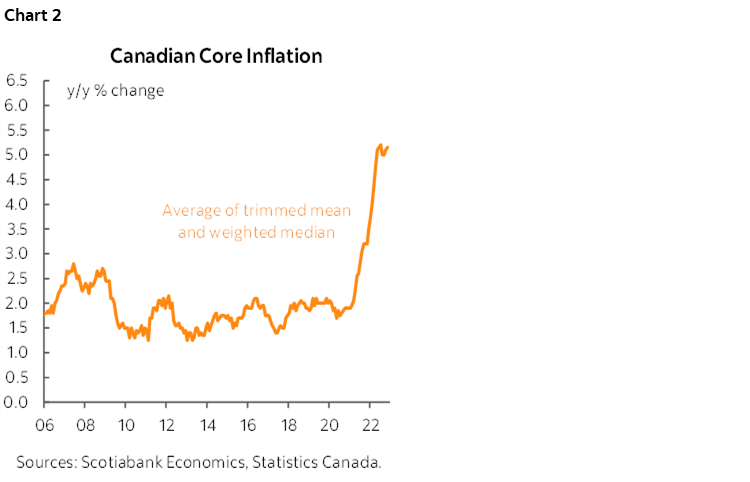
- Average ‘Core’ CPI ex-common: 5.2% y/y (5.1% prior)
- “Core” CPI ex-food/energy: 0.35% m/m // 4.3% SAAR
Key here is that traditional core inflation remains well above the BoC’s target and that keeps hike risk alive into the January meeting.
MARKETS AND THE BANK OF CANADA
Markets reacted the way they should have by putting mild upward pressure on the Canadian two-year yield that has increased by 5bps post-data. Markets are pricing 16bps of a hike on January 25th.
The BoC has been very clear that it is open to either another hike or a pause on January 25th. Any other interpretation must have listened to something other than the statement, the next day’s appearance by Deputy Governor Kozicki and the following Monday’s speech and press conference by Governor Macklem. With further updates on inflation, jobs and BoC surveys between now and then plus external developments it’s prudent to say that we’re still left with a highly data dependent outcome into that meeting that could yet go either way. Markets are splitting the difference and retaining flexibility. Scotia Economics will firm up its assessment closer to the meeting.
Also note that developments since the BoC delivered its communications have made them somewhat stale. China’s abandonment of Covid Zero poses new risks that I think are slanted to another round of supply chain pressures and inflation risk. Furthermore, other central banks from the Fed to the ECB and the BoJ all doubled down after the BoC’s wishy washy assessment.
HOT CORE
Headline inflation was up 0.1% m/m in seasonally unadjusted terms which translates into a gain of 0.4% m/m in seasonally adjusted terms and that owes itself to the firm core reading.
CPI excluding food and energy was up 0.35% m/m SA and at an annualized rate that’s 4.3% which is up from 3.4% the prior month. The trend is shown in chart 1. We’re off the peak from earlier in the year but these are not cool numbers by any stretch. In any world other than the pandemic the BoC would be freaking out over core inflation readings that are still doubling its target.
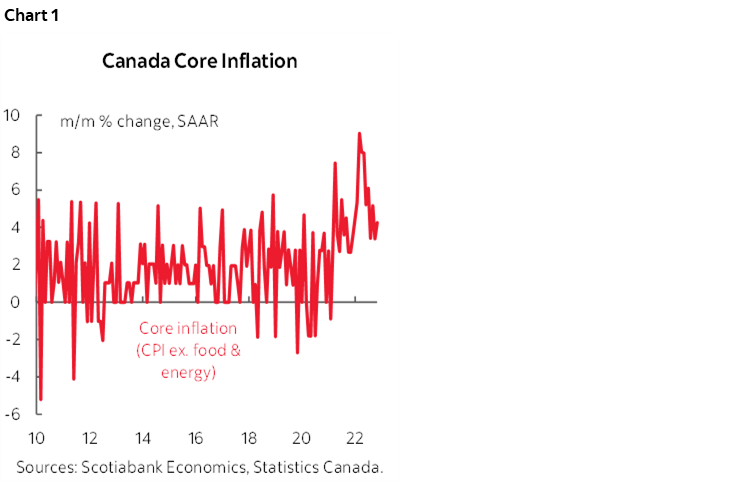
Chart 2 shows that the average of the two central tendency gauges of ‘core’ inflation edged up a tick to 5.2% y/y.
DON’T CHERRY-PICK THE DETAILS
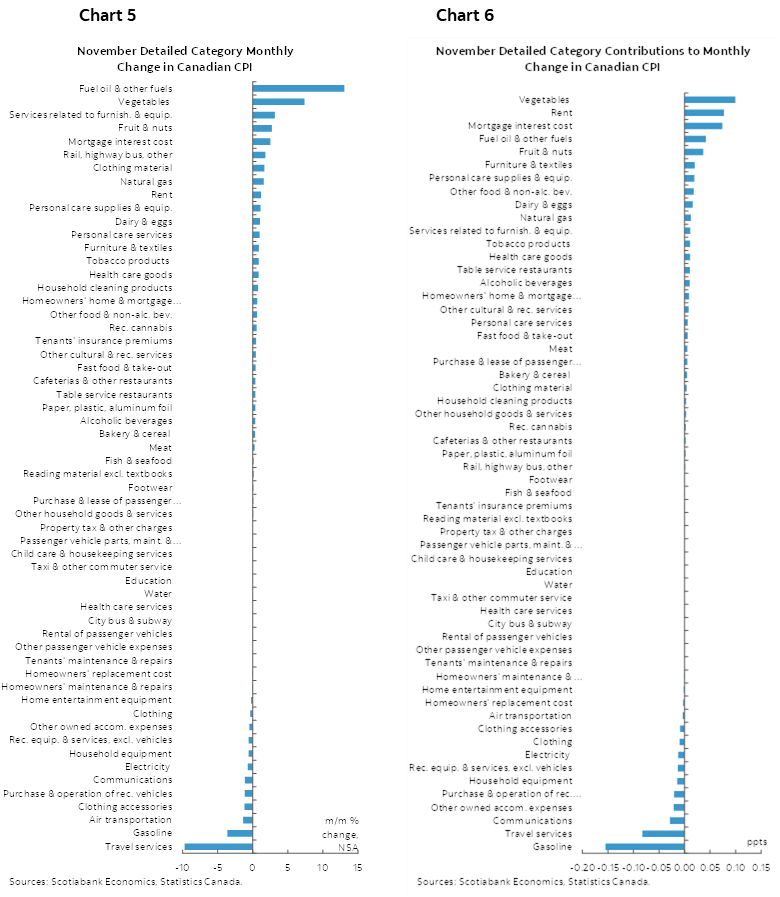
Chart 3 shows the month-over-month seasonally adjusted percentage changes in prices across all 55 components of the CPI basket. There were a few powerful outliers. The biggest gainers have very low weights in the basket.
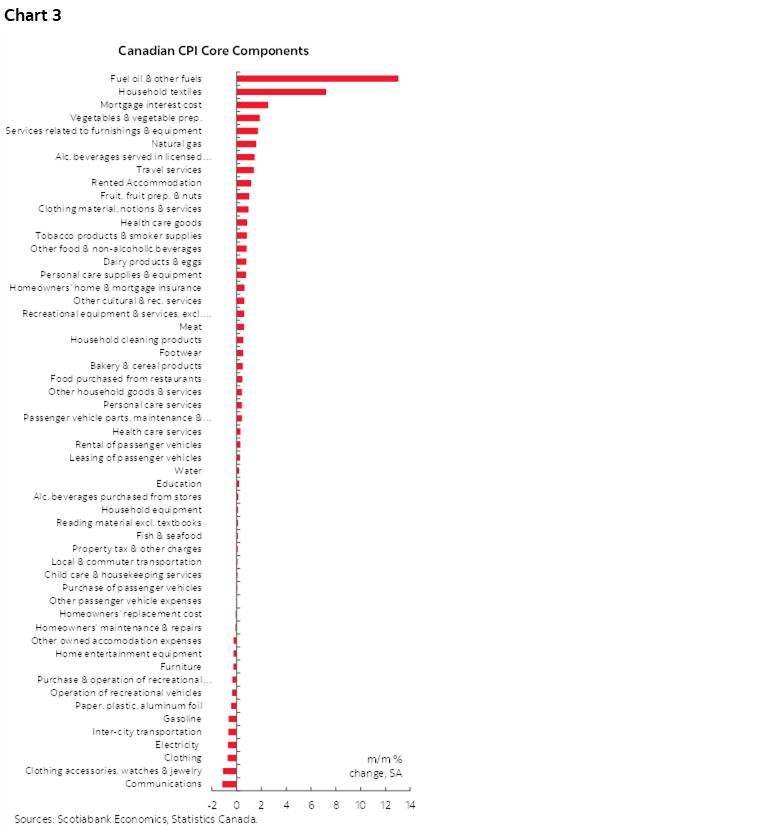
Now I suppose you could cherry-pick the data and say exclude this, not that, and arrive at slightly different conclusions. For instance, removing rent that was relatively hot at 1.2% m/m SA with a weight of 6.6% would knock core CPI ex-f&e down to 0.27% m/m SA or 3.3% at a seasonally adjusted and annualized rate (SAAR) which retains the same point that core inflation is hotter than the BoC’s target. To me it makes no sense to exclude a category that is a safety valve on the housing market’s affordability issues and lack of confidence in nearer-term house prices. Rent inflation is unlikely to go away any time soon. It may also have support through the immigration surge given that a significant number of new arrivals first land in the rental market.
Further, if you start selectively cherry picking, then why not also exclude the five weakest seasonally adjusted categories including clothing and accessories, communications, inter-city transportation and electricity that would add back 0.07 ppts to m/m SA inflation? Exclude those and rent and you’re back at the same point we started with: core is hot. Inflation data has to be read as the totality of all influences and doing so gives us well above target core inflation no matter how we slice and dice it.
Chart 4 shows that breadth remains very high. 81% of the basket is running over 3% y/y (unchanged) and 70% is over 4% (a touch lower than the 73% peak).
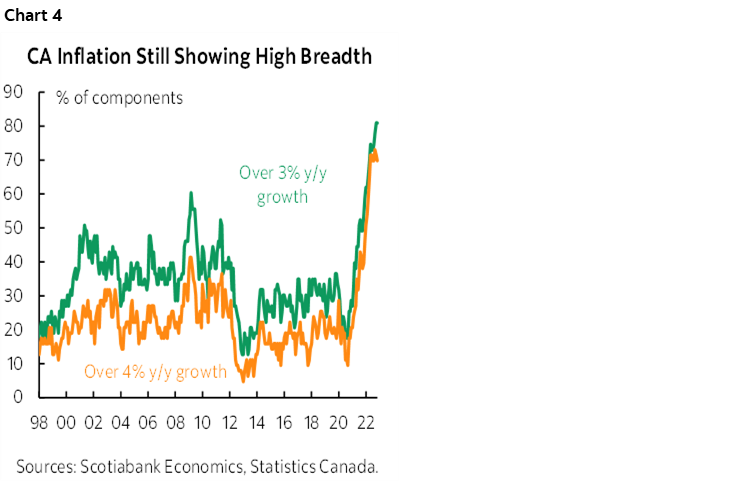
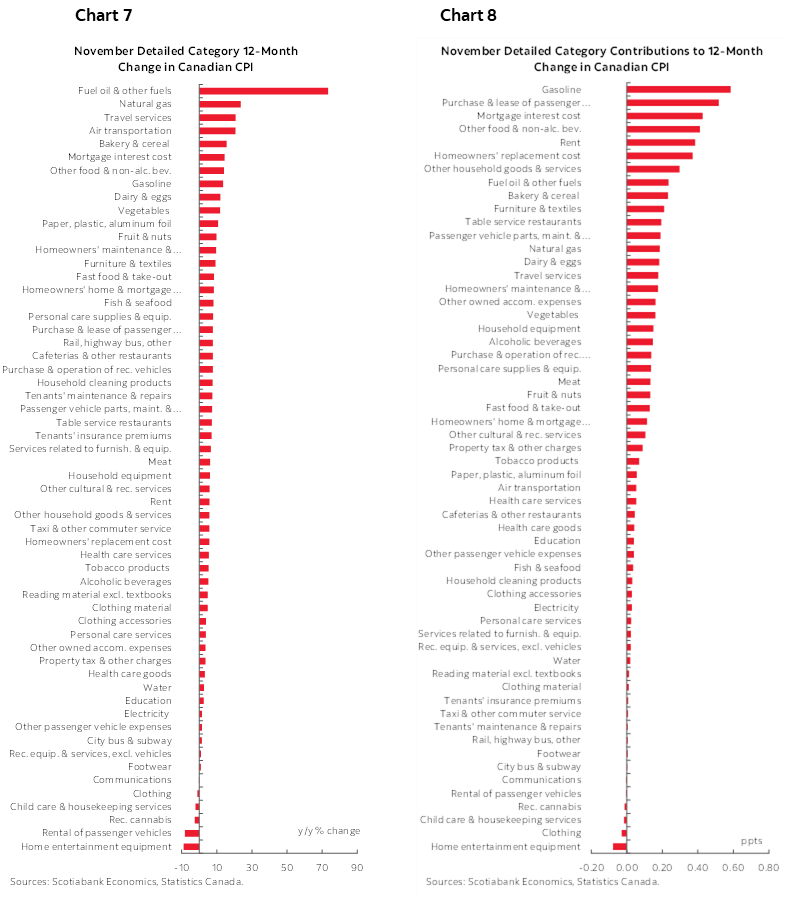
Chart 5 shows a breakdown of the m/m percentage changes in prices by category and chart 6 does likewise in terms of weighted contributions to the overall change in prices. Charts 7 and 8 do the same thing for the year-over-year rates of change.
For further details please see the accompanying table that breaks down the full basket with multiple measures and offers micro charts and “z-score” measures of the extent to which today’s price changes deviate from past historical norms by component.


DISCLAIMER
This report has been prepared by Scotiabank Economics as a resource for the clients of Scotiabank. Opinions, estimates and projections contained herein are our own as of the date hereof and are subject to change without notice. The information and opinions contained herein have been compiled or arrived at from sources believed reliable but no representation or warranty, express or implied, is made as to their accuracy or completeness. Neither Scotiabank nor any of its officers, directors, partners, employees or affiliates accepts any liability whatsoever for any direct or consequential loss arising from any use of this report or its contents.
These reports are provided to you for informational purposes only. This report is not, and is not constructed as, an offer to sell or solicitation of any offer to buy any financial instrument, nor shall this report be construed as an opinion as to whether you should enter into any swap or trading strategy involving a swap or any other transaction. The information contained in this report is not intended to be, and does not constitute, a recommendation of a swap or trading strategy involving a swap within the meaning of U.S. Commodity Futures Trading Commission Regulation 23.434 and Appendix A thereto. This material is not intended to be individually tailored to your needs or characteristics and should not be viewed as a “call to action” or suggestion that you enter into a swap or trading strategy involving a swap or any other transaction. Scotiabank may engage in transactions in a manner inconsistent with the views discussed this report and may have positions, or be in the process of acquiring or disposing of positions, referred to in this report.
Scotiabank, its affiliates and any of their respective officers, directors and employees may from time to time take positions in currencies, act as managers, co-managers or underwriters of a public offering or act as principals or agents, deal in, own or act as market makers or advisors, brokers or commercial and/or investment bankers in relation to securities or related derivatives. As a result of these actions, Scotiabank may receive remuneration. All Scotiabank products and services are subject to the terms of applicable agreements and local regulations. Officers, directors and employees of Scotiabank and its affiliates may serve as directors of corporations.
Any securities discussed in this report may not be suitable for all investors. Scotiabank recommends that investors independently evaluate any issuer and security discussed in this report, and consult with any advisors they deem necessary prior to making any investment.
This report and all information, opinions and conclusions contained in it are protected by copyright. This information may not be reproduced without the prior express written consent of Scotiabank.
™ Trademark of The Bank of Nova Scotia. Used under license, where applicable.
Scotiabank, together with “Global Banking and Markets”, is a marketing name for the global corporate and investment banking and capital markets businesses of The Bank of Nova Scotia and certain of its affiliates in the countries where they operate, including; Scotiabank Europe plc; Scotiabank (Ireland) Designated Activity Company; Scotiabank Inverlat S.A., Institución de Banca Múltiple, Grupo Financiero Scotiabank Inverlat, Scotia Inverlat Casa de Bolsa, S.A. de C.V., Grupo Financiero Scotiabank Inverlat, Scotia Inverlat Derivados S.A. de C.V. – all members of the Scotiabank group and authorized users of the Scotiabank mark. The Bank of Nova Scotia is incorporated in Canada with limited liability and is authorised and regulated by the Office of the Superintendent of Financial Institutions Canada. The Bank of Nova Scotia is authorized by the UK Prudential Regulation Authority and is subject to regulation by the UK Financial Conduct Authority and limited regulation by the UK Prudential Regulation Authority. Details about the extent of The Bank of Nova Scotia's regulation by the UK Prudential Regulation Authority are available from us on request. Scotiabank Europe plc is authorized by the UK Prudential Regulation Authority and regulated by the UK Financial Conduct Authority and the UK Prudential Regulation Authority.
Scotiabank Inverlat, S.A., Scotia Inverlat Casa de Bolsa, S.A. de C.V, Grupo Financiero Scotiabank Inverlat, and Scotia Inverlat Derivados, S.A. de C.V., are each authorized and regulated by the Mexican financial authorities.
Not all products and services are offered in all jurisdictions. Services described are available in jurisdictions where permitted by law.