- It’s not the year-over-year headline rate that matters one iota…
- ...as higher frequency core gauges remain sticky…
- ...reaffirming the BoC’s concern over stalled progress
- Why core inflation faces renewed upside risk with idiosyncratic Canadian drivers
- Canadian CPI, m/m % NSA // y/y %, March:
- Actual: 0.5 / 4.3
- Scotia: 0.7 / 4.5
- Consensus: 0.5 / 4.3
- Prior: 0.4 / 5.2
- Canadian trimmed mean // weighted median // average, y/y %, March:
- Actual: 4.4 / 4.6 / 4.5
- Prior: 4.8 / 4.9 / 4.9 (unrevised)
Canadian core inflation remains sticky and persistently above the BoC’s 2% headline target with no evidence of continued progress. Chart 1 illustrates this point by tracking the month-over-month rates of core inflation at a seasonally adjusted and annualized pace. Two of the three measures picked up and the third one slipped with all of them continuing to rest at 3% or higher (chart 1).
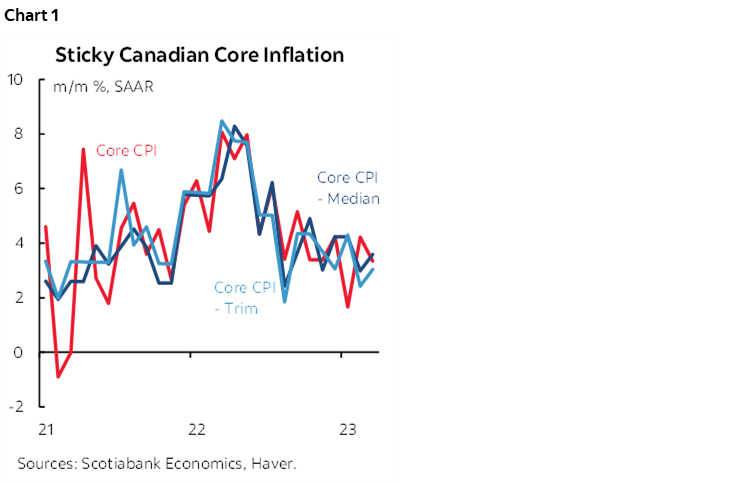
This observation reaffirms Governor Macklem’s stance that the easy part of getting inflation lower has passed and now we’re left with the more persistent pressures that are not building upon prior progress. The result will likely continue to merit a cautious tone by Governor Macklem during his pending testimony this morning in which he is likely to flag stalled progress while leaning against cutting this year and retaining a hike option.
Markets largely shrugged off the readings. There was a slight initial cheapening in Canada 2s post-data but that probably had more to do with the coincidental cheapening in US 2s following US bank earnings and hawkish comments from St. Louis Fed President Bullard who said he favours further rate hikes in a plural sense. These moves were subsequently reversed with little net change holding at the time of sending this publication.
The year-over-year rate of inflation cooled to 4.3% from 5.2% but is largely irrelevant in terms of evaluating monetary policy risks. Ditto for the trimmed mean (4.4% from 4.8%) and weighted median (4.6% from 4.9%) year-over-year gauges.
In order to evaluate price pressures at the margin—and hence not influenced by base effects—we need to use the highest frequency measures. Using year-over-year risks repeating one of the mistakes that the BoC and Fed made when inflation was first starting to take off and they dismissed it as a base effect argument while ignoring incremental pressures. Today presents the opposite risk of misjudging inflation’s decline as year-over-year rates continue to plunge over the duration of the year with uncertain effects beyond.
Hence the focus upon trimmed mean at 3% m/m SAAR, weighted median (3.6% m/m SAAR) and CPI ex-food and energy (3.3% m/m SAAR).
DETAILS
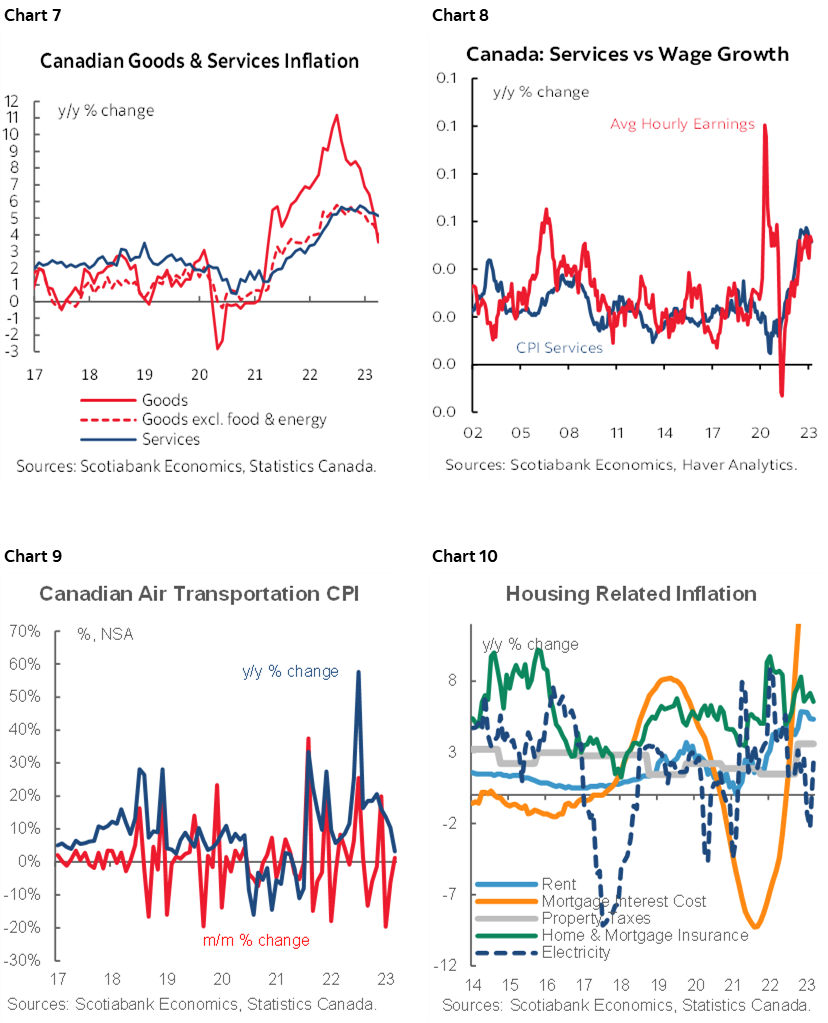
Governor Macklem is keeping a close eye on services inflation and it remains firm. Chart 2 shows the month-over-month seasonally adjusted and annualized rate of services inflation that is holding around the elevated average of the past year.
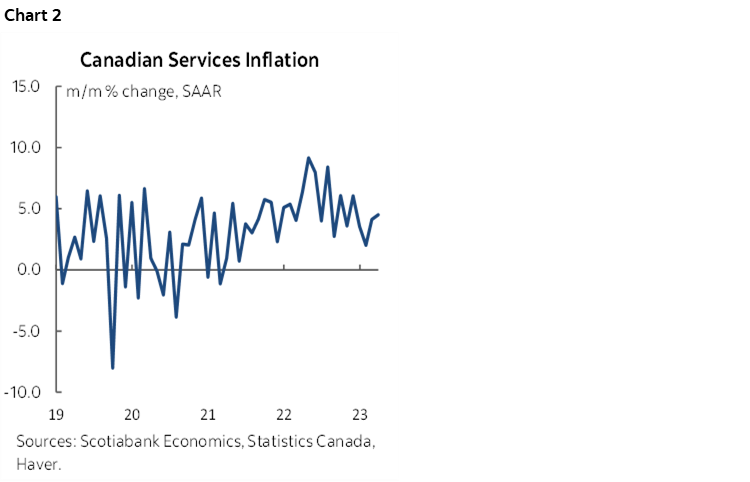
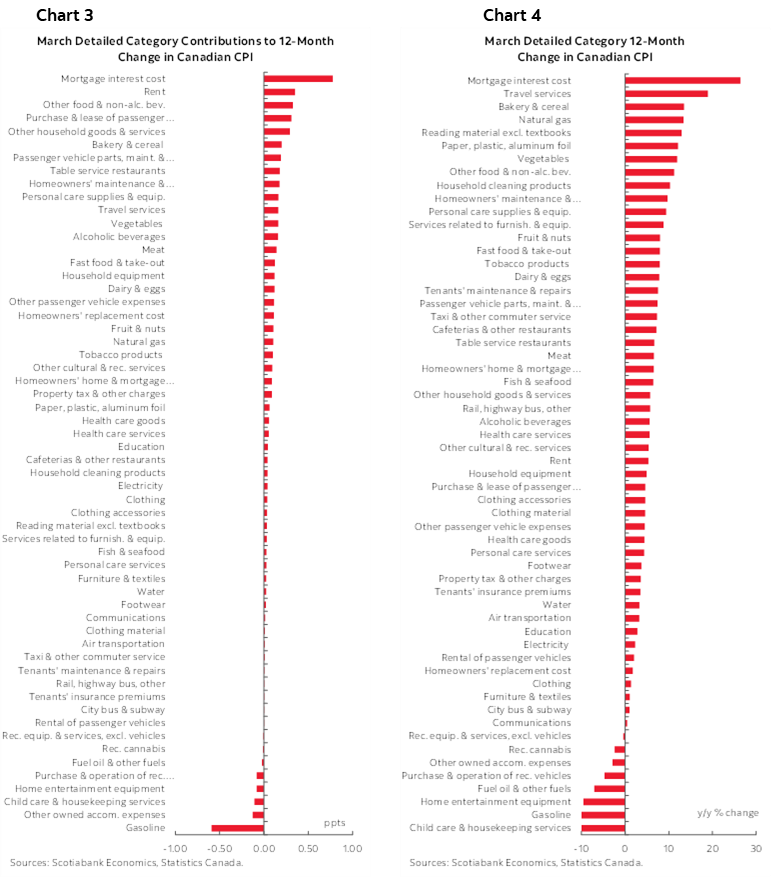
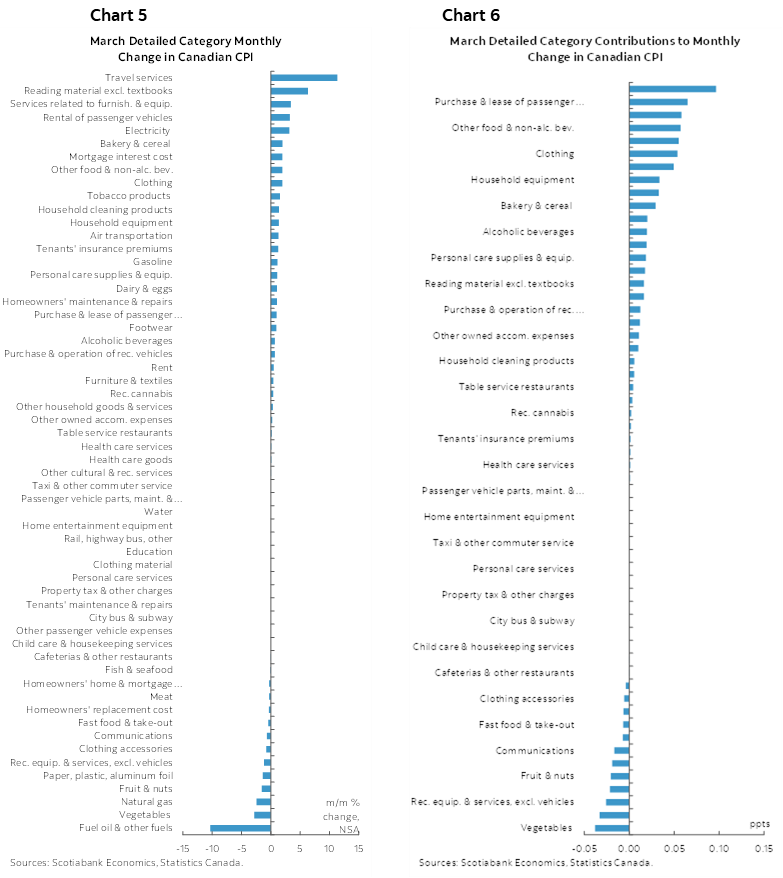
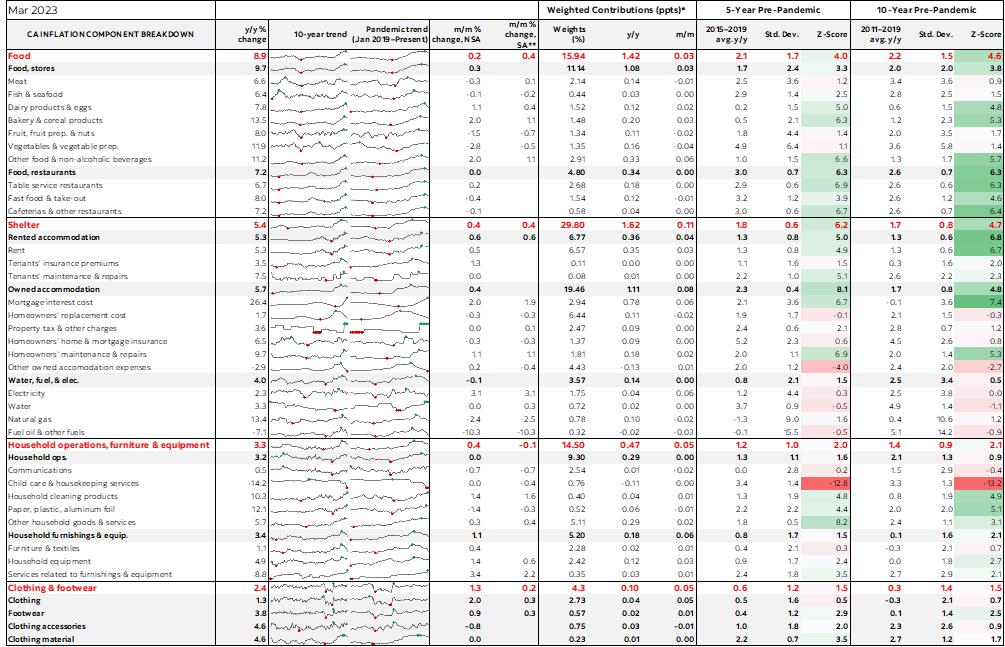
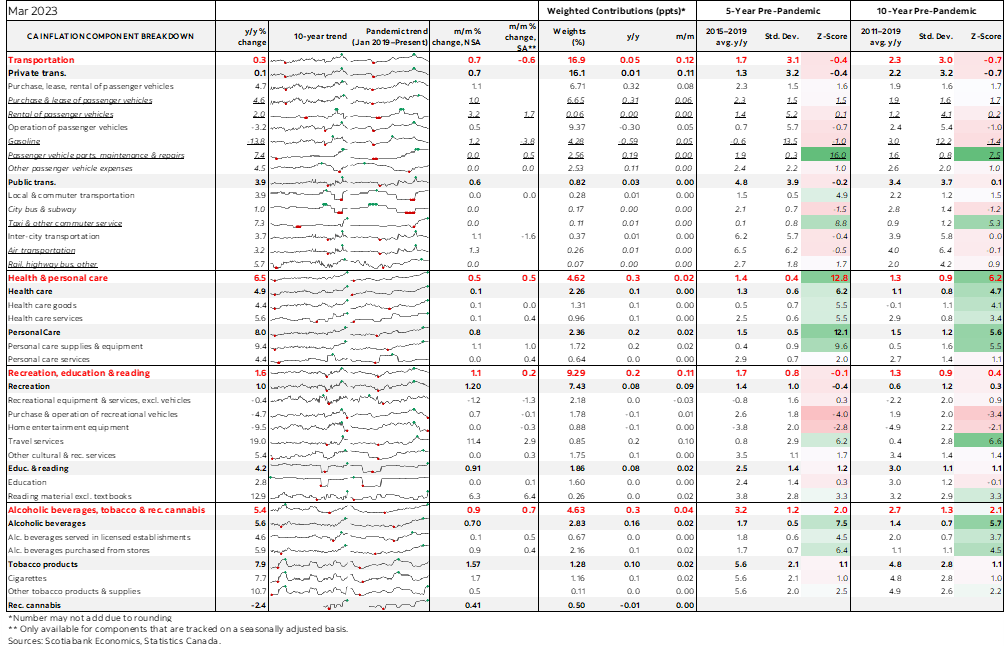
Chart 3 shows the breakdown of the CPI basket in m/m NSA terms by component and chart 4 does the same thing in terms of their weighted contributions to growth. Charts 5 and 6 do likewise for year-over-year rates.
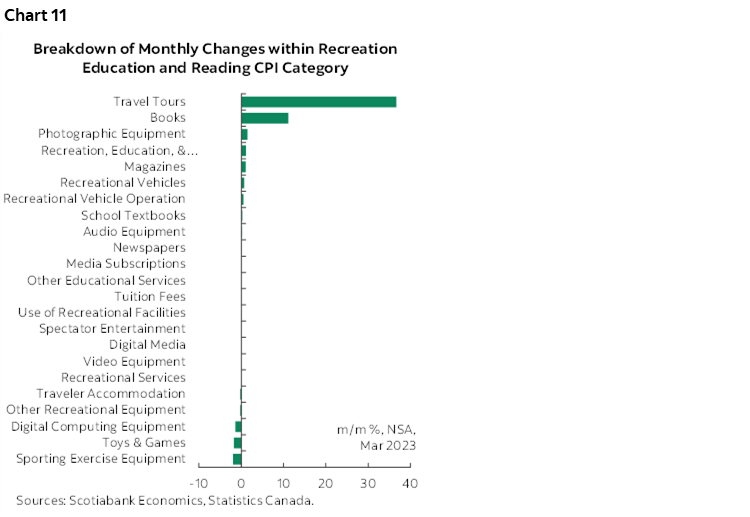
Charts 7–11 portray select components of the basket. In particular, note that seasonal March break plans drove some heat in the recreation/education category as travel tour prices soared.
Please see the accompanying detailed table including micro-charts and z-score measures of deviations from trends by component.
THE PATH FORWARD
As previously argued (here), I think that several forward-looking drivers of inflation are likely to become more heated and this may very well require additional policy tightening lest inflation expectations never come fully under control around the BoC’s desired levels. They include:
- Evidence that housing is bottoming. Canada is likely to achieve a bottom for housing’s influence on CPI earlier than elsewhere because of the way Canada captures house prices in CPI by using replacement costs derived from new home prices. This contrasts with the US in which market rent changes driving lagging influences upon owners equivalent rent.
- This view toward housing is driven by very tight housing inventories and soaring immigration. Governor Macklem is too dismissive toward the impact that immigration may have on inflation by assuming that it impacts supply and demand simultaneously. It does not. When has it ever?? Especially in Canada, where a demand infusion always arrives before supply gets added in lagging fashion. If Canada sticks with its half-million per year immigration target then it faces the likelihood of serial upward pressure upon house prices as supply persistently lags demand. There may be concomitant social challenges as well. To be clear, this is not a knock against immigration as regular readers would know given my longstanding support for higher immigration in order to offset aging influences and as a driver of longer-run economic growth. There are, however, costs and benefits to doing so.
- With firmer housing demand and prices may come spillover effects onto other parts of the CPI basket. If you’ve ever bought a home, new or resale, then you’d know what I mean by that!
- Canada’s job market is very tight and it is generating wage pressures that are far in excess of productivity gains with the latter being a national embarrassment throughout the pandemic.
- Public sector wage gains risk fanning private wage gains and with spillover effects into core CPI. I argued this point in the Global Week Ahead and there is substantial cross-country evidence for this point (here, and box 2.1 here).
- The weight on public sector wage gains in Canada has dramatically risen as shown in charts 9 and 10 in my week ahead. Massive public sector hiring throughout the pandemic has caused worker shortages in the private sector and with that has gone damage to potential GDP growth through permanent impairment of private sector output and wealth creation.
- Fiscal policy remains highly stimulative. Also see the week ahead for this argument and why I think Governor Macklem is too cavalier in dismissing the ongoing and incremental role of fiscal policy.
- Canada has yet to make a dent in terms of opening up disinflationary slack. Once and if it makes such progress then there will be lagging effects on core inflation, but the economy and labour market have not even begun to make that journey despite 1.5 years since the bond market started to materially tighten conditions in anticipation of tighter monetary policy.
DISCLAIMER
This report has been prepared by Scotiabank Economics as a resource for the clients of Scotiabank. Opinions, estimates and projections contained herein are our own as of the date hereof and are subject to change without notice. The information and opinions contained herein have been compiled or arrived at from sources believed reliable but no representation or warranty, express or implied, is made as to their accuracy or completeness. Neither Scotiabank nor any of its officers, directors, partners, employees or affiliates accepts any liability whatsoever for any direct or consequential loss arising from any use of this report or its contents.
These reports are provided to you for informational purposes only. This report is not, and is not constructed as, an offer to sell or solicitation of any offer to buy any financial instrument, nor shall this report be construed as an opinion as to whether you should enter into any swap or trading strategy involving a swap or any other transaction. The information contained in this report is not intended to be, and does not constitute, a recommendation of a swap or trading strategy involving a swap within the meaning of U.S. Commodity Futures Trading Commission Regulation 23.434 and Appendix A thereto. This material is not intended to be individually tailored to your needs or characteristics and should not be viewed as a “call to action” or suggestion that you enter into a swap or trading strategy involving a swap or any other transaction. Scotiabank may engage in transactions in a manner inconsistent with the views discussed this report and may have positions, or be in the process of acquiring or disposing of positions, referred to in this report.
Scotiabank, its affiliates and any of their respective officers, directors and employees may from time to time take positions in currencies, act as managers, co-managers or underwriters of a public offering or act as principals or agents, deal in, own or act as market makers or advisors, brokers or commercial and/or investment bankers in relation to securities or related derivatives. As a result of these actions, Scotiabank may receive remuneration. All Scotiabank products and services are subject to the terms of applicable agreements and local regulations. Officers, directors and employees of Scotiabank and its affiliates may serve as directors of corporations.
Any securities discussed in this report may not be suitable for all investors. Scotiabank recommends that investors independently evaluate any issuer and security discussed in this report, and consult with any advisors they deem necessary prior to making any investment.
This report and all information, opinions and conclusions contained in it are protected by copyright. This information may not be reproduced without the prior express written consent of Scotiabank.
™ Trademark of The Bank of Nova Scotia. Used under license, where applicable.
Scotiabank, together with “Global Banking and Markets”, is a marketing name for the global corporate and investment banking and capital markets businesses of The Bank of Nova Scotia and certain of its affiliates in the countries where they operate, including; Scotiabank Europe plc; Scotiabank (Ireland) Designated Activity Company; Scotiabank Inverlat S.A., Institución de Banca Múltiple, Grupo Financiero Scotiabank Inverlat, Scotia Inverlat Casa de Bolsa, S.A. de C.V., Grupo Financiero Scotiabank Inverlat, Scotia Inverlat Derivados S.A. de C.V. – all members of the Scotiabank group and authorized users of the Scotiabank mark. The Bank of Nova Scotia is incorporated in Canada with limited liability and is authorised and regulated by the Office of the Superintendent of Financial Institutions Canada. The Bank of Nova Scotia is authorized by the UK Prudential Regulation Authority and is subject to regulation by the UK Financial Conduct Authority and limited regulation by the UK Prudential Regulation Authority. Details about the extent of The Bank of Nova Scotia's regulation by the UK Prudential Regulation Authority are available from us on request. Scotiabank Europe plc is authorized by the UK Prudential Regulation Authority and regulated by the UK Financial Conduct Authority and the UK Prudential Regulation Authority.
Scotiabank Inverlat, S.A., Scotia Inverlat Casa de Bolsa, S.A. de C.V, Grupo Financiero Scotiabank Inverlat, and Scotia Inverlat Derivados, S.A. de C.V., are each authorized and regulated by the Mexican financial authorities.
Not all products and services are offered in all jurisdictions. Services described are available in jurisdictions where permitted by law.