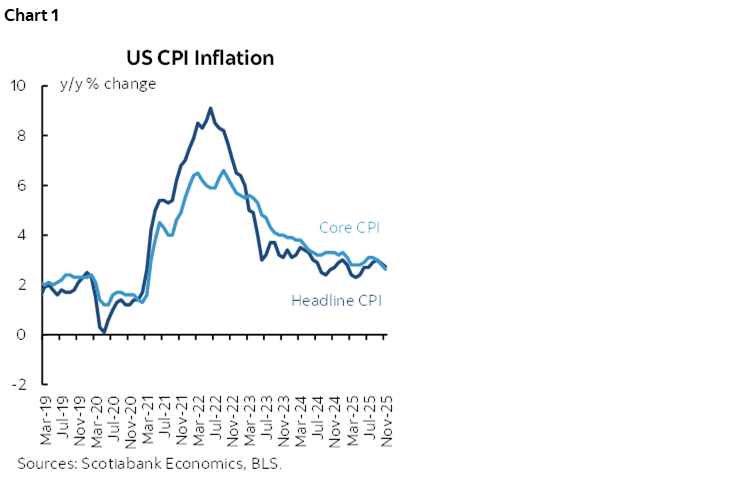
- Inflation fell sharply below consensus in y/y terms
- Implied m/m average changes over October–November were broadly soft
- Why it’s all made up data you should view very skeptically…
- ...as markets largely faded it
- US CPI / core cpi, y/y %, November:
- Actual: 2.7 / 2.6
- Scotia: 3.1 / 3.0
- Consensus: 3.1 / 3.0
- Prior: 3.0 / 3.0 (from September, October missing)
Oh come on. Tell me you don’t believe what the BLS just threw at us in chart 1. Bonds sort of did by driving a small rally, but it was pretty minor in relation to the apparent magnitude of downside surprise. Markets only have another cut fully priced by the April FOMC. Perhaps enough folks in markets view the numbers as unreliable as I do, but there is a case for the FOMC to accept the evidence including payrolls and cut in January.
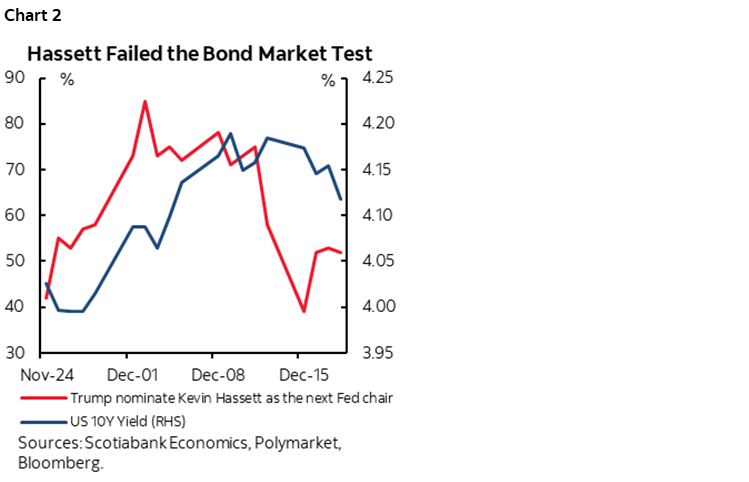
Why? I’ll get to that after reviewing the readings. Perhaps the only one who accepted the numbers at face value was Kevin Hassett. He arguably failed the bond market trial balloon test with very dovish views that are very close to the administration (chart 2). The 10s yield has ebbed and flowed with his chance at winning. If President Trump is truly concerned about the housing market, then given the 30-year mortgage is priced off 10s he might not like what the bond market is telling him about Hassett’s candidacy. Expect more ongoing market trial balloons from the administration.
The Results
Year-over-year CPI fell back to 2.7% versus consensus at 3.1% with core CPI falling back to 2.6% (consensus 3.0%). That looks a lot softer than expected and the magnitude of the miss is unusual for y/y figures.
We did not get m/m figures with this report because no October estimates were provided given the government shutdown from early October to November 12th which prevented data collection.
We can loosely infer the average m/m readings between September and November by taking the SA index levels by component and backing out the implied percentage changes over the two months divided by two.
Chart 3 does this by component and ranks the estimates from highest to lowest. There was widespread softness across the whole basket. Core CPI’s implied average monthly change over this period was 0.08% m/m SA.
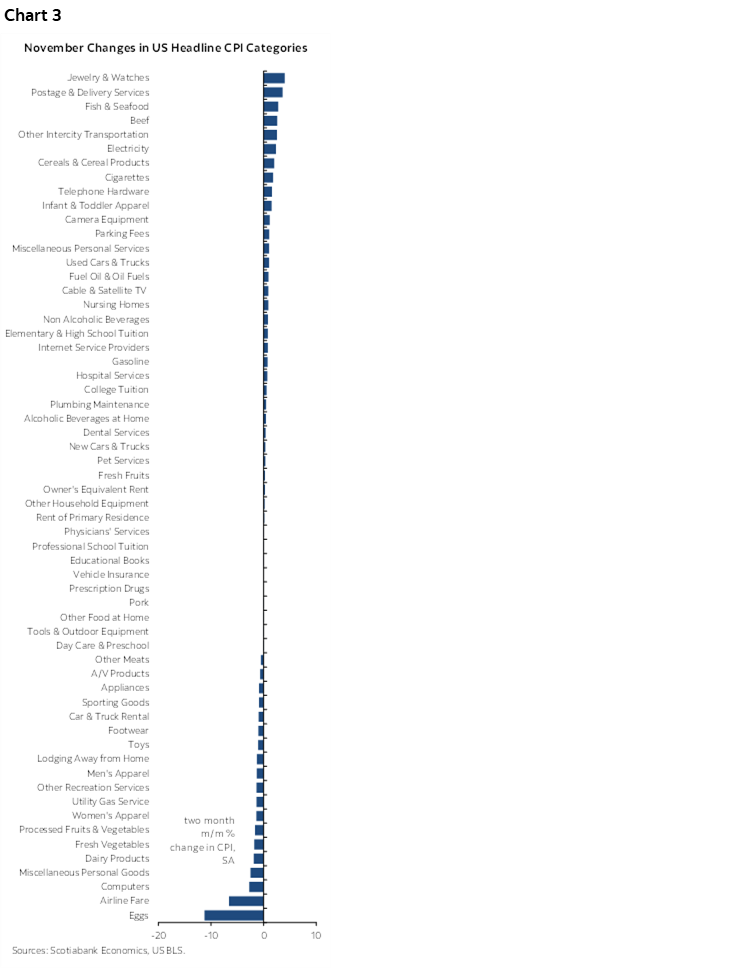
Core goods ex-food and energy prices were up by just 0.06% m/m SA.
You get the idea. Food 0.03% m/m SA, gas 0.4%, OER 0.14%, rent 0.06%, clothing -0.36%, new vehicles 0.16%, used vehicles 0.52%, all services 0.11%.
Why it’s Totally Fabricated Data
I have very little faith in the BLS’s data collection for several reasons.
Most of October's prices were not collected given the shutdown.
This spawned guidance that the "BLS could not collect October 2025 reference period survey data, so survey data were carried forward to October 2025 from September 2025 in accordance with normal procedures."
Also recall that the shutdown extended to mid-November (12th). There were lags in getting back to work that probably went beyond guidance that “CPI data collection resumed on November 14, 2025.” The time and resources they had to collect data in November should be viewed with high caution. For one thing, the DOGE packages that expired in September likely left the BLS further strained for resources. Let alone the impact on morale from having its leader fired and into the broader layoffs.
As per the BLS, “Collection began on Friday, November 14. By authorizing additional collection hours, BLS attempted to collect data for the entire month of November.” This is important because some would argue that perhaps the figures were biased lower by seasonal sales like Black Friday on November 28th and the lead up to it. I’m not a believer in that argument; these sales happen every year, there is spartan evidence they were greater or lesser than in the past, and they would mainly affect some goods with little emphasis on services. For example, it’s not like OER and rent go on sale for Black Friday!
So this says two things. November is missing data for the first half of the month that simply could not be collected. And I think we should be cautious toward the resources they had to competently collect data in the second half of November.
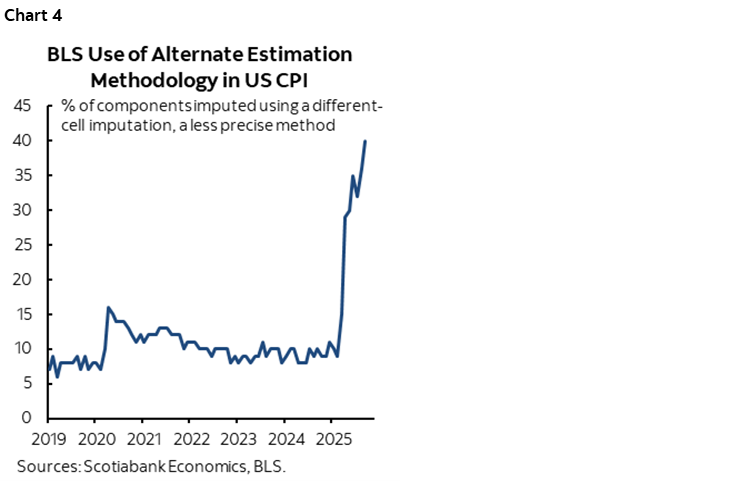
Further, at about 11:15amET or so, we'll get the share of the basket that was imputed through alternative methods (here, ‘different cell’ column). It had risen to 40% in September for an all-time high (chart 4).
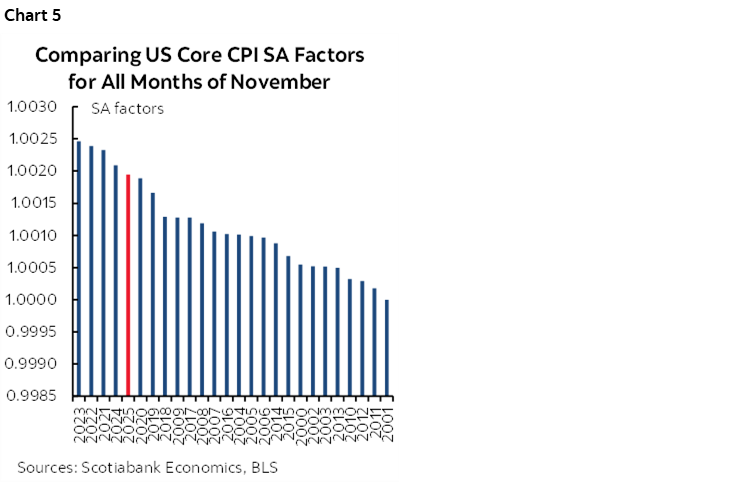
The SA factor wasn’t a stand-out like it has been for nonfarm payrolls (chart 5).
How Will the Federal Reserve React?
I think the Committee will sound cautious but run with the data that we have so far which is bad for jobs as explained here, and soft for cpi if you believe it and subject to PCE translations including PPI.
In other words, if they had to make the decision today, then they would be very likely to cut by another 25bps on January 28th. Lots of data and developments between now and then, but still, I can't see them having the confidence to throw it all out and dig in. The Board is generally more dovish than several of the regionals who rotate next month
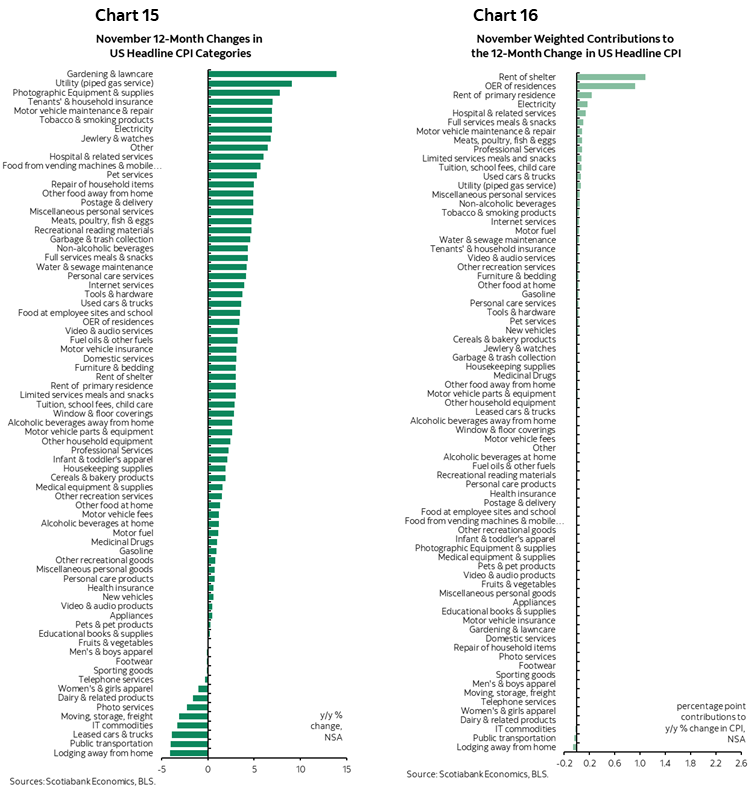
Please see the rest of the collection of charts for further perspective if desired.
DISCLAIMER
This report has been prepared by Scotiabank Economics as a resource for the clients of Scotiabank. Opinions, estimates and projections contained herein are our own as of the date hereof and are subject to change without notice. The information and opinions contained herein have been compiled or arrived at from sources believed reliable but no representation or warranty, express or implied, is made as to their accuracy or completeness. Neither Scotiabank nor any of its officers, directors, partners, employees or affiliates accepts any liability whatsoever for any direct or consequential loss arising from any use of this report or its contents.
These reports are provided to you for informational purposes only. This report is not, and is not constructed as, an offer to sell or solicitation of any offer to buy any financial instrument, nor shall this report be construed as an opinion as to whether you should enter into any swap or trading strategy involving a swap or any other transaction. The information contained in this report is not intended to be, and does not constitute, a recommendation of a swap or trading strategy involving a swap within the meaning of U.S. Commodity Futures Trading Commission Regulation 23.434 and Appendix A thereto. This material is not intended to be individually tailored to your needs or characteristics and should not be viewed as a “call to action” or suggestion that you enter into a swap or trading strategy involving a swap or any other transaction. Scotiabank may engage in transactions in a manner inconsistent with the views discussed this report and may have positions, or be in the process of acquiring or disposing of positions, referred to in this report.
Scotiabank, its affiliates and any of their respective officers, directors and employees may from time to time take positions in currencies, act as managers, co-managers or underwriters of a public offering or act as principals or agents, deal in, own or act as market makers or advisors, brokers or commercial and/or investment bankers in relation to securities or related derivatives. As a result of these actions, Scotiabank may receive remuneration. All Scotiabank products and services are subject to the terms of applicable agreements and local regulations. Officers, directors and employees of Scotiabank and its affiliates may serve as directors of corporations.
Any securities discussed in this report may not be suitable for all investors. Scotiabank recommends that investors independently evaluate any issuer and security discussed in this report, and consult with any advisors they deem necessary prior to making any investment.
This report and all information, opinions and conclusions contained in it are protected by copyright. This information may not be reproduced without the prior express written consent of Scotiabank.
™ Trademark of The Bank of Nova Scotia. Used under license, where applicable.
Scotiabank, together with “Global Banking and Markets”, is a marketing name for the global corporate and investment banking and capital markets businesses of The Bank of Nova Scotia and certain of its affiliates in the countries where they operate, including; Scotiabank Europe plc; Scotiabank (Ireland) Designated Activity Company; Scotiabank Inverlat S.A., Institución de Banca Múltiple, Grupo Financiero Scotiabank Inverlat, Scotia Inverlat Casa de Bolsa, S.A. de C.V., Grupo Financiero Scotiabank Inverlat, Scotia Inverlat Derivados S.A. de C.V. – all members of the Scotiabank group and authorized users of the Scotiabank mark. The Bank of Nova Scotia is incorporated in Canada with limited liability and is authorised and regulated by the Office of the Superintendent of Financial Institutions Canada. The Bank of Nova Scotia is authorized by the UK Prudential Regulation Authority and is subject to regulation by the UK Financial Conduct Authority and limited regulation by the UK Prudential Regulation Authority. Details about the extent of The Bank of Nova Scotia's regulation by the UK Prudential Regulation Authority are available from us on request. Scotiabank Europe plc is authorized by the UK Prudential Regulation Authority and regulated by the UK Financial Conduct Authority and the UK Prudential Regulation Authority.
Scotiabank Inverlat, S.A., Scotia Inverlat Casa de Bolsa, S.A. de C.V, Grupo Financiero Scotiabank Inverlat, and Scotia Inverlat Derivados, S.A. de C.V., are each authorized and regulated by the Mexican financial authorities.
Not all products and services are offered in all jurisdictions. Services described are available in jurisdictions where permitted by law.