CANADA: DECLINE IN VEHICLE SALES POSSIBLY LEVELLING OFF
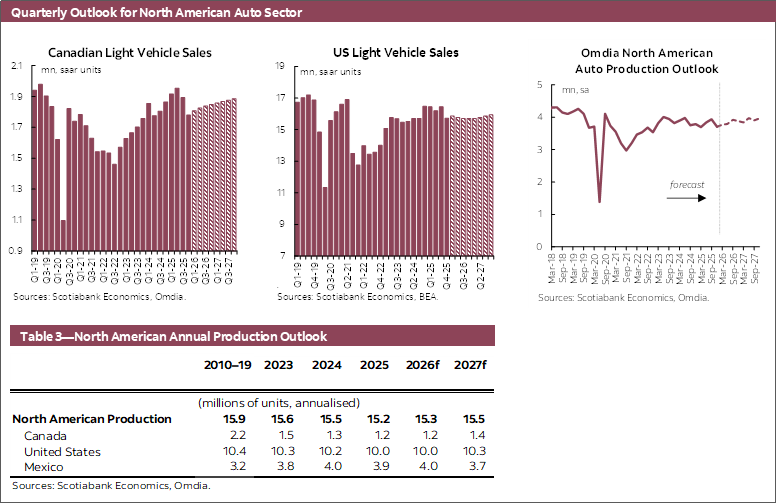
Canadian auto sales increased 3% month-over-month to 1.76 mn units at a seasonally adjusted annualized rate in February based on data from Omdia (chart 1). February marked the first seasonally adjusted increase in vehicle sales since September 2025. The three month moving average is essentially unchanged at 1.74 mn (SAAR) units, the lowest level since the middle of Q4-2023. Non-seasonally adjusted sales for the month were 116.6 k, as reported by the same source, down 6.2% year-over-year.

While the decline in vehicle sales in Canada may be showing signs of levelling off, the sector and overall economic outlook continue to face headwinds from tariffs and other shocks. The recent US Supreme Court ruling on February 20th struck down IEEPA tariffs, which included the 35% tariff on most Canadian goods exports to the US, but the case did not impact Section 232 tariffs such as those targeting US imports of automotive and automotive parts. The Trump administration promptly announced and implemented 10% tariffs using Section 122, which similar to the IEEPA tariffs do not stack with Section 232 tariffs and allow for exemptions of many CUSMA-compliant goods. The volatile trade and tariff policy adds further uncertainty leading into the CUSMA renewal discussions. Large changes to or a total breakdown in the trade agreement would weigh heavily on Canada’s economy as noted in this recent Scotiabank Economics report.
Meanwhile, the recent spike in global oil prices adds further uncertainty to the outlook. While a permanent upward shock to WTI could add to Canada’s GDP growth, as noted in this Scotiabank Economics report, the higher cost at the pump for an extended period could impact consumer demand. Our outlook for Canadian light vehicle sales is 1.83 mn in 2026, as we expect demand to improve throughout the year albeit with larger uncertainty given the recent developments, and rising to 1.87 mn in 2027.
UNITED STATES: UNCERTAINTY RISING AMID VOLATILE TARIFFS AND OIL PRICES
US auto sales increased 6.3% month-over-month to 15.75 mn units at a seasonally adjusted annualized rate in February, according to the BEA (chart 2). Auto sales last month rebounded from the recent low 14.8 mn (SAAR) selling rate in January, which was the lowest level since December 2022. As a result, the three month moving average (3mma) remains around 15.5 mn (SAAR) units but is down from the 16.3 mn sold last year.

On February 20th, the US Supreme Court struck down tariffs imposed using the International Emergency Economic Powers Act (IEEPA) that ranged from 10% to 50% or more on nearly all trading partners. The Trump administration promptly invoked Section 122 to impose broad 10% tariffs for up to 150 days, which would need congressional approval to extend beyond, and has threatened raising the tariff rate to 15%. While this new tariff policy has lowered the estimated effective tariff rate on US imports, tariffs imposed using Section 232 are unchanged. As such, the 25% tariffs on US imports of automotives and auto parts remain in place, and will continue to weigh on the US and North American auto sector.
In addition to tariffs, there remain a host of other headwinds to the outlook. US employment levels have been flat since September, owing in large part from job gains in the health sector. However, the unemployment rate is trending around 4.4% amid slower population and labour force growth. Meanwhile, the recent spike in global oil prices towards 100 USD/bbl from 65 USD/bbl in February owing to the conflict in the Middle East adds to concerns about future inflation. While the Federal Reserve would normally be able to look through oil price shocks, headline and core CPI are around 2.5% y/y and persistent upward price pressures could slow their progress on returning inflation to 2%. As such, financial markets have begun to pull back some of the end-of-year policy rate pricing. Our outlook for US auto sales is 15.8 mn units in 2026 and 2027, with a softer sales rate through the first half of this year amid soft employment growth and marginally improving next year as expected interest rate relief supports consumer demand.
GLOBAL AUTO SALES: SOFT START TO THE YEAR ACROSS MOST REGIONS TRACKED
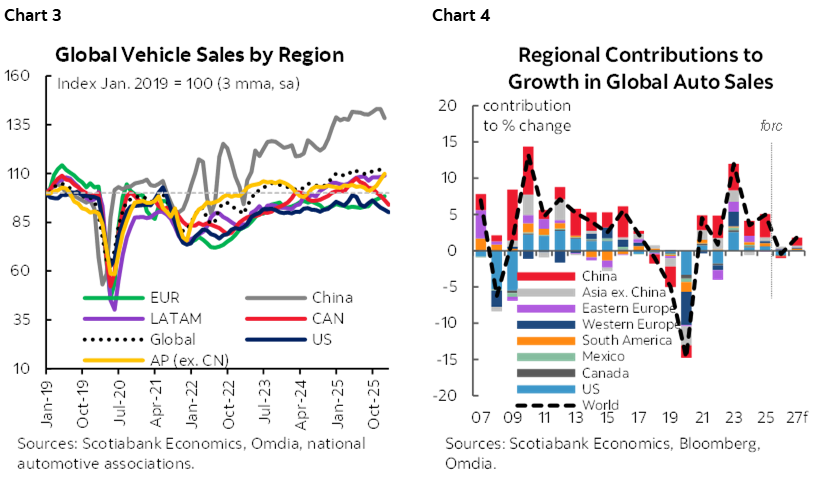
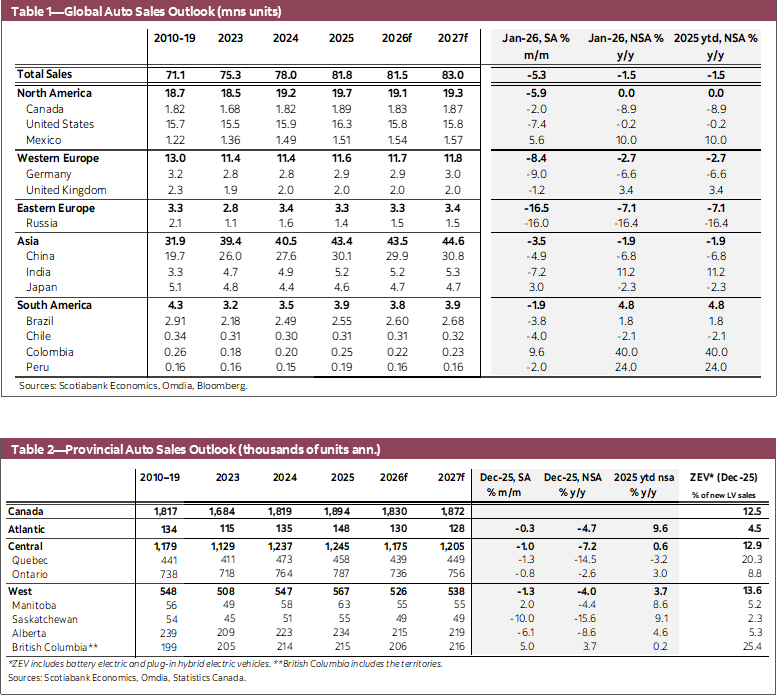
Global auto sales declined 5.3% month-over-month in January, continuing a trend of softening seasonally adjusted sales over the past three months (chart 3). January marked the slowest single seasonally adjusted month for the global automotive selling rate since August 2024. The slow start to the year was broad based with auto sales down in all regions tracked except for South America, where sales were marginally higher (0.2% m/m SA). At the regional level, eastern European auto sales declined the most in percentage terms, down 16.5% m/m (SA) in January, to their lowest level since June 2025. In western Europe, auto sales declined 8.4% m/m (SA), as sales were down in 11 of the 15 countries tracked. Meanwhile, in the Asia Pacific region, auto sales slowed 3.5% m/m (SA), contracting for a third consecutive month, notably from softer sales in China (-4.9%). Our outlook for global vehicle sales is a decline of 0.4% in 2026 before increasing 1.8% in 2027 (chart 4).
DISCLAIMER
This report has been prepared by Scotiabank Economics as a resource for the clients of Scotiabank. Opinions, estimates and projections contained herein are our own as of the date hereof and are subject to change without notice. The information and opinions contained herein have been compiled or arrived at from sources believed reliable but no representation or warranty, express or implied, is made as to their accuracy or completeness. Neither Scotiabank nor any of its officers, directors, partners, employees or affiliates accepts any liability whatsoever for any direct or consequential loss arising from any use of this report or its contents.
These reports are provided to you for informational purposes only. This report is not, and is not constructed as, an offer to sell or solicitation of any offer to buy any financial instrument, nor shall this report be construed as an opinion as to whether you should enter into any swap or trading strategy involving a swap or any other transaction. The information contained in this report is not intended to be, and does not constitute, a recommendation of a swap or trading strategy involving a swap within the meaning of U.S. Commodity Futures Trading Commission Regulation 23.434 and Appendix A thereto. This material is not intended to be individually tailored to your needs or characteristics and should not be viewed as a “call to action” or suggestion that you enter into a swap or trading strategy involving a swap or any other transaction. Scotiabank may engage in transactions in a manner inconsistent with the views discussed this report and may have positions, or be in the process of acquiring or disposing of positions, referred to in this report.
Scotiabank, its affiliates and any of their respective officers, directors and employees may from time to time take positions in currencies, act as managers, co-managers or underwriters of a public offering or act as principals or agents, deal in, own or act as market makers or advisors, brokers or commercial and/or investment bankers in relation to securities or related derivatives. As a result of these actions, Scotiabank may receive remuneration. All Scotiabank products and services are subject to the terms of applicable agreements and local regulations. Officers, directors and employees of Scotiabank and its affiliates may serve as directors of corporations.
Any securities discussed in this report may not be suitable for all investors. Scotiabank recommends that investors independently evaluate any issuer and security discussed in this report, and consult with any advisors they deem necessary prior to making any investment.
This report and all information, opinions and conclusions contained in it are protected by copyright. This information may not be reproduced without the prior express written consent of Scotiabank.
™ Trademark of The Bank of Nova Scotia. Used under license, where applicable.
Scotiabank, together with “Global Banking and Markets”, is a marketing name for the global corporate and investment banking and capital markets businesses of The Bank of Nova Scotia and certain of its affiliates in the countries where they operate, including; Scotiabank Europe plc; Scotiabank (Ireland) Designated Activity Company; Scotiabank Inverlat S.A., Institución de Banca Múltiple, Grupo Financiero Scotiabank Inverlat, Scotia Inverlat Casa de Bolsa, S.A. de C.V., Grupo Financiero Scotiabank Inverlat, Scotia Inverlat Derivados S.A. de C.V. – all members of the Scotiabank group and authorized users of the Scotiabank mark. The Bank of Nova Scotia is incorporated in Canada with limited liability and is authorised and regulated by the Office of the Superintendent of Financial Institutions Canada. The Bank of Nova Scotia is authorized by the UK Prudential Regulation Authority and is subject to regulation by the UK Financial Conduct Authority and limited regulation by the UK Prudential Regulation Authority. Details about the extent of The Bank of Nova Scotia's regulation by the UK Prudential Regulation Authority are available from us on request. Scotiabank Europe plc is authorized by the UK Prudential Regulation Authority and regulated by the UK Financial Conduct Authority and the UK Prudential Regulation Authority.
Scotiabank Inverlat, S.A., Scotia Inverlat Casa de Bolsa, S.A. de C.V, Grupo Financiero Scotiabank Inverlat, and Scotia Inverlat Derivados, S.A. de C.V., are each authorized and regulated by the Mexican financial authorities.
Not all products and services are offered in all jurisdictions. Services described are available in jurisdictions where permitted by law.