CANADA: GROWTH IN ANNUAL SALES BUT YEAR ENDED ON A SOFTER TONE
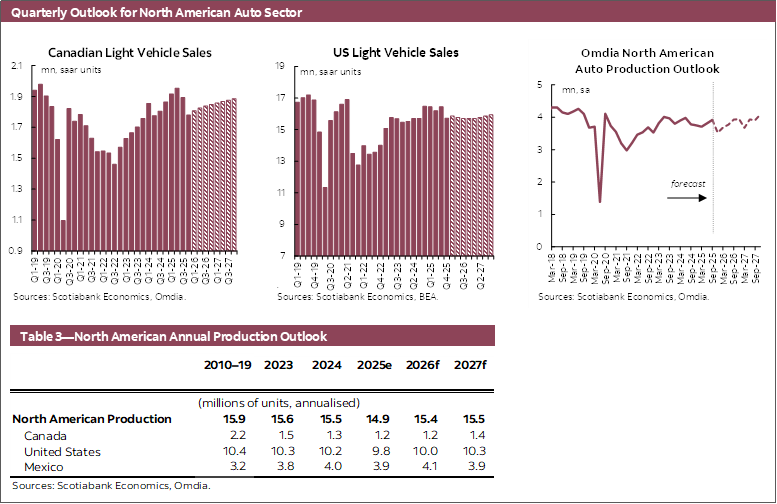
Canadian auto sales in December were 109.7 k in non-seasonally adjusted terms, down 6.2% year-over-year, according to data from Omdia (chart 1). In seasonally adjusted terms, auto sales fell 2.0% month-over-month to 1.72 mn units at an annualized rate (SAAR).

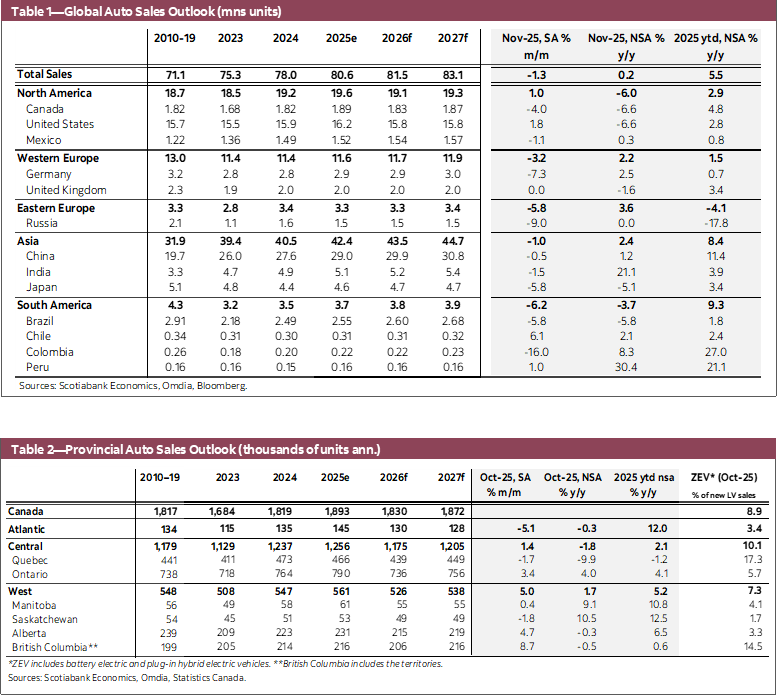
The selling rate for automotives continued to decline towards the end of last year relative to the spring and summer, slowing to an average 1.78 mn (SAAR) in Q4, down 5.9% quarter-over-quarter (q/q) relative to Q3 and down 4.3% year-over-year (y/y) relative to Q4 of 2024. The softness in the final months of the year likely reflects demand that was pulled forward to the spring when consumers were looking to front run any tariff distortions to prices and supply. Nevertheless, annual light vehicle sales rounded out the year at 1.89 mn units in 2025, up 4.1% y/y from 1.82 mn in 2024, and rising to the highest level since 2019 when sales were 1.92 mn.
Economic data through much of 2025 was more resilient than feared in the spring. Job growth began to rebound in the fall, averaging 42.8 k in the fourth quarter with the unemployment rate at 6.8%, unchanged from a year earlier. We expect the Bank of Canada to remain on the sidelines, holding the policy rate at 2.25%, while assessing how the economy evolves and the subsequent impact on the inflation outlook, with their next move likely higher in the second half of 2026. As a result, borrowing costs for consumers and businesses in the near term are unlikely to ease much further and could in fact increase over the medium term. Our outlook for Canadian light vehicle sales is 1.83 mn in 2026 as we expect the sales rate to rebound from the recent declines albeit not to the same level as last spring, and rising to 1.87 mn in 2027.
UNITED STATES: SALES IMPROVE IN DECEMBER TO END A VOLATILE YEAR
US auto sales increased 1.9% month-over-month to 16.0 mn units at a seasonally adjusted annualized rate (SAAR) in December according to the US Bureau of Economic Analysis (chart 2).

Seasonally adjusted light vehicle sales increased for a second consecutive month, but the selling rate has pulled back following the end of the federal electric vehicle subsidy in September, averaging 15.7 mn (SAAR) in the fourth quarter (-4.4% q/q). Similar to above, some softness in recent vehicle sales may be as a result of demand that was pulled forward to avoid tariff effects. For the year as a whole, light vehicle sales totaled 16.2 mn units in 2025, up 2.4% y/y relative to annual 2024. However, excluding the months of March and April which saw a surge in tariff front-running demand, sales for the remaining ten months averaged 15.9 mn (SAAR) in 2025 and were only up 0.5% compared to the same period in 2024.
While the US economy continued to grow at a strong pace, increasing 4.3% (q/q SAAR) in Q3 supported by higher personal consumption (3.5% q/q SAAR) and a shrinking trade deficit, we expect the pace of growth to moderate. Job gains have stalled in recent months, outside of the healthcare sector, with the unemployment rate trending around 4.4% due to tightened immigration policies. This softer employment hiring is likely to be a greater focus for the Federal Reserve which is a driving factor of our expectations for further rate cuts from the current 3.75% towards 3% by the middle of this year. Our outlook for US auto sales is 15.76 mn in 2026, as we expect the softer labour market to weigh on demand, before increasing to 15.82 mn in 2027, supported by further declines in borrowing costs for consumers as the effects of previous and future expected interest rate cuts work their way through the economy.
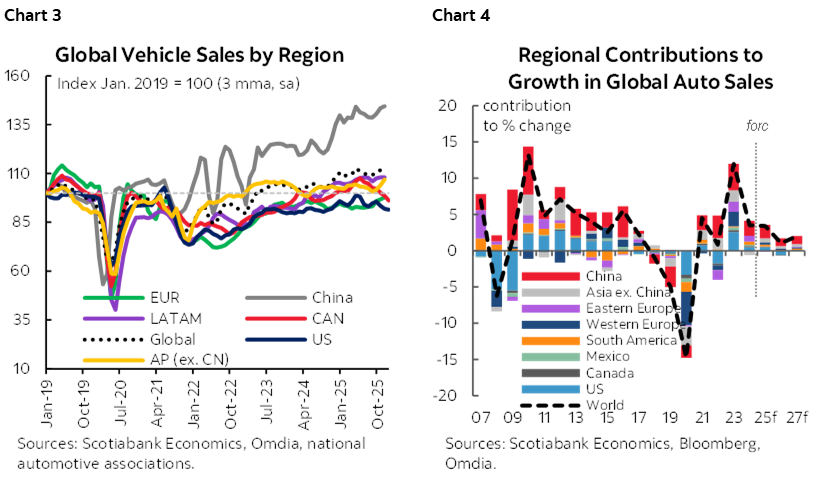
GLOBAL AUTO SALES: REVERTING TO TREND AT THE REGIONAL LEVEL
Global auto sales fell 1.3% m/m (SA) in November, as higher sales in North America were offset by declines in all other regions tracked (chart 3). In western Europe, auto sales decreased 3.2% m/m (SA), as sales eased back in line with their 12-month moving average but remain up 2.2% y/y (NSA). Meanwhile in eastern Europe, auto sales decreased 5.8% m/m (SA) in November after growing to their highest seasonally adjusted month since 2014. Auto sales in the Asia Pacific region decreased 1.0% m/m (SA), as the sales rate declined in most countries covered, including China (-0.5% m/m, SA) which accounts for approximately two thirds of unit sales in the region. Auto sales in Latin America fell 3.8% m/m (SA), slowing to the lowest seasonally adjusted sales rate since August 2025. Our outlook for global vehicle sales is 3.4% in 2025, with growth expected to slow to 1.1% in 2026 before picking up to 2.0% in 2027 (chart 4).
DISCLAIMER
This report has been prepared by Scotiabank Economics as a resource for the clients of Scotiabank. Opinions, estimates and projections contained herein are our own as of the date hereof and are subject to change without notice. The information and opinions contained herein have been compiled or arrived at from sources believed reliable but no representation or warranty, express or implied, is made as to their accuracy or completeness. Neither Scotiabank nor any of its officers, directors, partners, employees or affiliates accepts any liability whatsoever for any direct or consequential loss arising from any use of this report or its contents.
These reports are provided to you for informational purposes only. This report is not, and is not constructed as, an offer to sell or solicitation of any offer to buy any financial instrument, nor shall this report be construed as an opinion as to whether you should enter into any swap or trading strategy involving a swap or any other transaction. The information contained in this report is not intended to be, and does not constitute, a recommendation of a swap or trading strategy involving a swap within the meaning of U.S. Commodity Futures Trading Commission Regulation 23.434 and Appendix A thereto. This material is not intended to be individually tailored to your needs or characteristics and should not be viewed as a “call to action” or suggestion that you enter into a swap or trading strategy involving a swap or any other transaction. Scotiabank may engage in transactions in a manner inconsistent with the views discussed this report and may have positions, or be in the process of acquiring or disposing of positions, referred to in this report.
Scotiabank, its affiliates and any of their respective officers, directors and employees may from time to time take positions in currencies, act as managers, co-managers or underwriters of a public offering or act as principals or agents, deal in, own or act as market makers or advisors, brokers or commercial and/or investment bankers in relation to securities or related derivatives. As a result of these actions, Scotiabank may receive remuneration. All Scotiabank products and services are subject to the terms of applicable agreements and local regulations. Officers, directors and employees of Scotiabank and its affiliates may serve as directors of corporations.
Any securities discussed in this report may not be suitable for all investors. Scotiabank recommends that investors independently evaluate any issuer and security discussed in this report, and consult with any advisors they deem necessary prior to making any investment.
This report and all information, opinions and conclusions contained in it are protected by copyright. This information may not be reproduced without the prior express written consent of Scotiabank.
™ Trademark of The Bank of Nova Scotia. Used under license, where applicable.
Scotiabank, together with “Global Banking and Markets”, is a marketing name for the global corporate and investment banking and capital markets businesses of The Bank of Nova Scotia and certain of its affiliates in the countries where they operate, including; Scotiabank Europe plc; Scotiabank (Ireland) Designated Activity Company; Scotiabank Inverlat S.A., Institución de Banca Múltiple, Grupo Financiero Scotiabank Inverlat, Scotia Inverlat Casa de Bolsa, S.A. de C.V., Grupo Financiero Scotiabank Inverlat, Scotia Inverlat Derivados S.A. de C.V. – all members of the Scotiabank group and authorized users of the Scotiabank mark. The Bank of Nova Scotia is incorporated in Canada with limited liability and is authorised and regulated by the Office of the Superintendent of Financial Institutions Canada. The Bank of Nova Scotia is authorized by the UK Prudential Regulation Authority and is subject to regulation by the UK Financial Conduct Authority and limited regulation by the UK Prudential Regulation Authority. Details about the extent of The Bank of Nova Scotia's regulation by the UK Prudential Regulation Authority are available from us on request. Scotiabank Europe plc is authorized by the UK Prudential Regulation Authority and regulated by the UK Financial Conduct Authority and the UK Prudential Regulation Authority.
Scotiabank Inverlat, S.A., Scotia Inverlat Casa de Bolsa, S.A. de C.V, Grupo Financiero Scotiabank Inverlat, and Scotia Inverlat Derivados, S.A. de C.V., are each authorized and regulated by the Mexican financial authorities.
Not all products and services are offered in all jurisdictions. Services described are available in jurisdictions where permitted by law.