CANADA: ANNOUNCED EV POLICIES BRING NEW APPROACH TO SAME OBJECTIVE
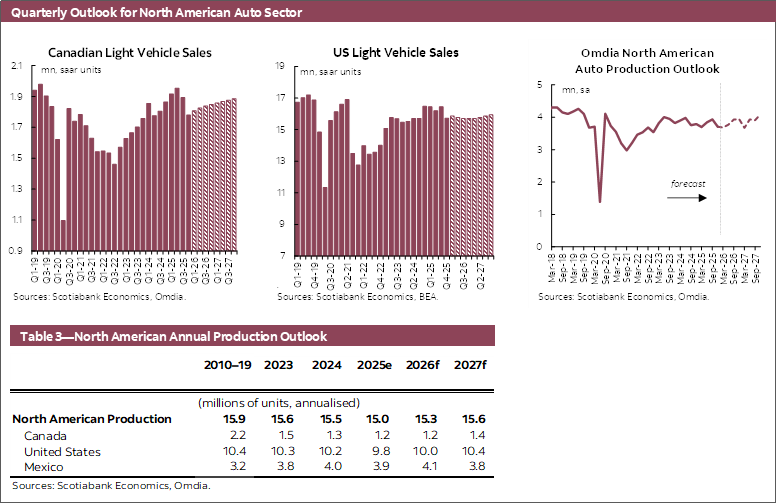
Canadian auto sales fell 2.6% month-over-month to 1.69 mn units at a seasonally adjusted annualized rate (SAAR) in January based on data from Omdia (chart 1). In non-seasonally adjusted terms auto sales were 108 k, down 9.4% year-over-year. When comparing to the same month, auto sales posted the slowest start to the year since 2023. In seasonally adjusted terms, the selling rate softened through the second half of 2025 in what was likely a balancing out from demand pulled forward earlier in the year by consumers that were looking to front-run any distortions from the Spring tariff announcements. We will be keeping an eye out over the coming months for signs that the decline in seasonally adjusted auto sales may be bottoming out. However, overall demand is unlikely to see a similar Spring surge compared to last year.

Canada’s employment growth has pulled back in recent months, with the three month moving average (3mma) job gains slowing to 12.5 k (SA) in January, down from 59.8 k (SA, 3mma) in November 2025, while the unemployment rate declined to 6.5% owing to a lower participation rate. Meanwhile, the Bank of Canada held the policy rate at 2.25% in January and we expect an extended hold in the near term with potential rate hikes beginning in the fourth quarter as the BoC returns towards a more neutral policy stance.
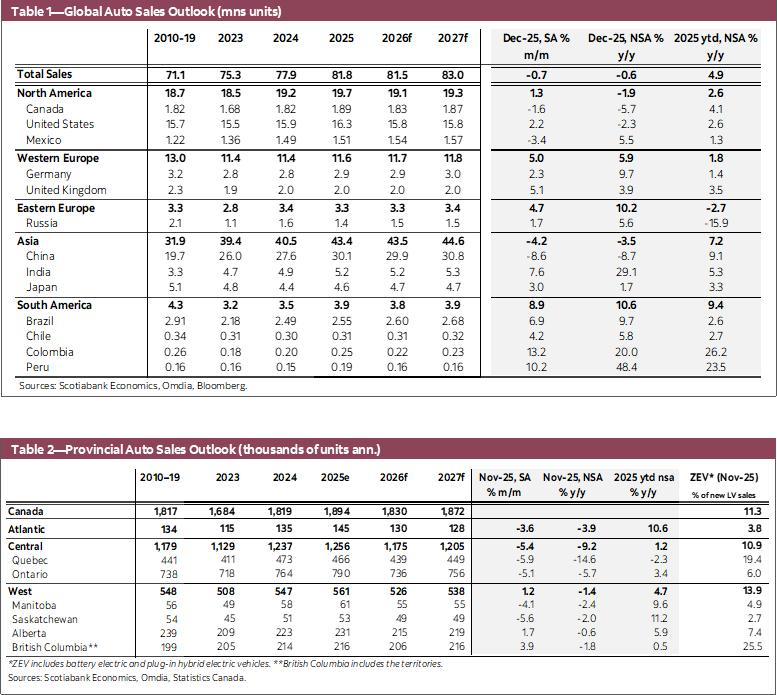
On February 5th, the federal government announced plans to adjust the greenhouse gas (GHG) emission standards and repeal the Electric Vehicle Availability Standard (EVAS) that previously mandated 100% zero-emission vehicle sales by 2035. The stricter GHG emission standards are estimated to push the share of electric vehicle (EV) sales towards 75% by 2035 and 90% by 2040. EV sales through the first 11 months of 2025 are tracking less than 9% of overall new auto sales, down from 13.7% in 2024 owing in part from the federal iZEV consumer rebate running out of funding early last year. In order to support EV demand in the near term, the federal government also will be launching a five-year EV Affordability Program. The new program will provide incentives of up to $5 k for battery electric and fuel cell EVs and up to $2.5 k for plug-in hybrid vehicles. The incentives will be limited to vehicles valued up to $50 k when manufactured by countries which have a free trade agreement with Canada, thereby excluding Chinese EVs imported under the trade agreement announced mid-January, but will not have a price cap for Canadian manufactured EVs, and the incentives will be gradually phased out by the end of 2030.
While the new consumer subsidy may support a near term rise in demand for ZEVs, bringing the share of ZEV sales back towards 2024 levels, Canada’s longer term growth of the EV market will likely depend on how rapidly the supply side evolves. Our outlook for Canadian light vehicle sales is 1.83 mn in 2026 as we expect the sales rate to rebound from the recent lows, albeit not to the same level as last Spring, and rising to 1.87 mn in 2027.
UNITED STATES: SALES SOFTEN AS LABOUR MARKETS TREND SIDEWAYS
US auto sales in January declined 6.7% month-over-month to 14.9 mn units at a seasonally adjusted annualized rate (SAAR) according to the US Bureau of Economic Analysis (chart 2). January marked the lowest seasonally adjusted sales rate for a single month since December 2022. Demand for new vehicles in the US continues to ease relative to 12 months ago. The average auto sales rate in the US over the past three months has declined to 15.5 mn (SAAR, 3mma), down from the 16.3 mn sold in annual 2025 and to the lowest three month average since August 2024.

Uncertainty within the labour markets is likely posing headwinds to consumer confidence. Non-farm employment levels have essentially treaded water since last Summer, with 22 k jobs lost per month on average in the fourth quarter. The weaker hiring environment is combining with lower labour force growth which has kept the unemployment rate around 4.4% for the same time period. However, year-over-year measures of headline and core inflation remain around 2.7–3.0%, posing conflicting challenges to the US Federal Reserve’s mandate of maximum sustainable employment and the 2% inflation target. The Fed held the policy rate at 3.75% at the January FOMC meeting after having cut by 25 basis points at each of the three prior meetings. We expect that the Fed will lower the policy rate to 3% by the end of Q3 this year, albeit with a much more gradual pace of easing compared to the end of last year as they assess price pressures while maintaining flexibility for further interest rate relief should there be a greater slowdown in the labour market.
Our outlook for US auto sales is 15.76 mn in 2026, as we expect auto demand to be weighed by soft employment growth, before increasing to 15.82 mn in 2027, supported by further declines in borrowing costs for consumers as the effects of previous and future expected interest rate cuts work their way through the economy.
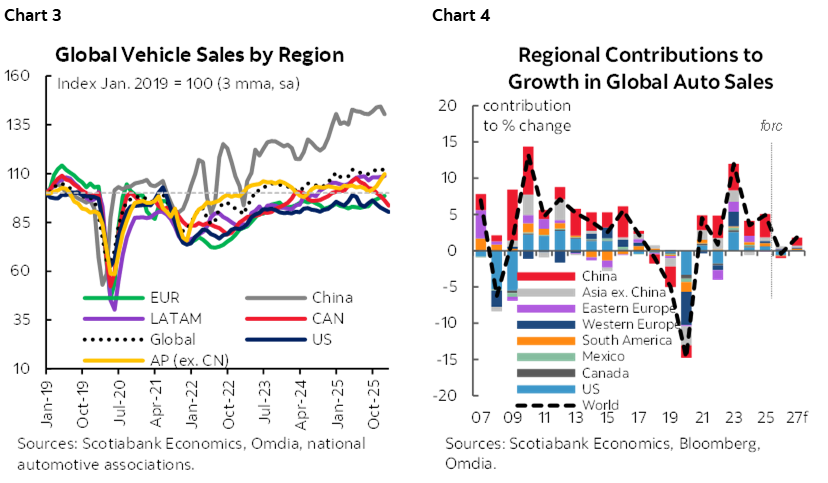
GLOBAL AUTO SALES: ANNUAL GROWTH ACROSS MOST REGIONS TRACKED IN 2025
Global auto sales declined 0.7% m/m (SA) in December as vehicle sales growth continued to soften at the end of a positive year (chart 3). Nevertheless, auto sales in the fourth quarter marginally increased by 0.3% q/q (SA), up for a third consecutive quarter. Auto sales for the countries we track were 81.8 mn in 2025, up 4.9% year-over-year, with positive annual sales growth in all regions except for eastern Europe. Vehicle sales in eastern Europe fell 2.7% y/y in 2025, but ended the year on a stronger note, increasing 4.7% m/m in December and 7.1% quarter-over-quarter in Q4. Meanwhile, in western Europe, auto sales rebounded sharply in December (5% m/m) which supported increases of 7.1% q/q growth in Q4 and 1.8% y/y for the year. In the Asia Pacific region, automotive sales ended the final month on a softer tone, decreasing 4.2% m/m in December but increased 1.6% q/q in Q4. Annual auto sales for the region were up 7.2% y/y owing to further rising demand in China with sales up 9.1% y/y in 2025. In Latin America, vehicle sales remain volatile on a monthly basis, up 5.1% m/m in December and were marginally higher in the final quarter (0.6% q/q) to cap off 9.4% y/y growth for the year and the highest annual sales volume since 2018. Our outlook for global vehicle sales expects growth rates to slow at the regional level, with volume pulling back from last year’s levels that came in above expected, resulting in global sales declining 0.4% in 2026 before picking up to 1.8% in 2027 (chart 4).
DISCLAIMER
This report has been prepared by Scotiabank Economics as a resource for the clients of Scotiabank. Opinions, estimates and projections contained herein are our own as of the date hereof and are subject to change without notice. The information and opinions contained herein have been compiled or arrived at from sources believed reliable but no representation or warranty, express or implied, is made as to their accuracy or completeness. Neither Scotiabank nor any of its officers, directors, partners, employees or affiliates accepts any liability whatsoever for any direct or consequential loss arising from any use of this report or its contents.
These reports are provided to you for informational purposes only. This report is not, and is not constructed as, an offer to sell or solicitation of any offer to buy any financial instrument, nor shall this report be construed as an opinion as to whether you should enter into any swap or trading strategy involving a swap or any other transaction. The information contained in this report is not intended to be, and does not constitute, a recommendation of a swap or trading strategy involving a swap within the meaning of U.S. Commodity Futures Trading Commission Regulation 23.434 and Appendix A thereto. This material is not intended to be individually tailored to your needs or characteristics and should not be viewed as a “call to action” or suggestion that you enter into a swap or trading strategy involving a swap or any other transaction. Scotiabank may engage in transactions in a manner inconsistent with the views discussed this report and may have positions, or be in the process of acquiring or disposing of positions, referred to in this report.
Scotiabank, its affiliates and any of their respective officers, directors and employees may from time to time take positions in currencies, act as managers, co-managers or underwriters of a public offering or act as principals or agents, deal in, own or act as market makers or advisors, brokers or commercial and/or investment bankers in relation to securities or related derivatives. As a result of these actions, Scotiabank may receive remuneration. All Scotiabank products and services are subject to the terms of applicable agreements and local regulations. Officers, directors and employees of Scotiabank and its affiliates may serve as directors of corporations.
Any securities discussed in this report may not be suitable for all investors. Scotiabank recommends that investors independently evaluate any issuer and security discussed in this report, and consult with any advisors they deem necessary prior to making any investment.
This report and all information, opinions and conclusions contained in it are protected by copyright. This information may not be reproduced without the prior express written consent of Scotiabank.
™ Trademark of The Bank of Nova Scotia. Used under license, where applicable.
Scotiabank, together with “Global Banking and Markets”, is a marketing name for the global corporate and investment banking and capital markets businesses of The Bank of Nova Scotia and certain of its affiliates in the countries where they operate, including; Scotiabank Europe plc; Scotiabank (Ireland) Designated Activity Company; Scotiabank Inverlat S.A., Institución de Banca Múltiple, Grupo Financiero Scotiabank Inverlat, Scotia Inverlat Casa de Bolsa, S.A. de C.V., Grupo Financiero Scotiabank Inverlat, Scotia Inverlat Derivados S.A. de C.V. – all members of the Scotiabank group and authorized users of the Scotiabank mark. The Bank of Nova Scotia is incorporated in Canada with limited liability and is authorised and regulated by the Office of the Superintendent of Financial Institutions Canada. The Bank of Nova Scotia is authorized by the UK Prudential Regulation Authority and is subject to regulation by the UK Financial Conduct Authority and limited regulation by the UK Prudential Regulation Authority. Details about the extent of The Bank of Nova Scotia's regulation by the UK Prudential Regulation Authority are available from us on request. Scotiabank Europe plc is authorized by the UK Prudential Regulation Authority and regulated by the UK Financial Conduct Authority and the UK Prudential Regulation Authority.
Scotiabank Inverlat, S.A., Scotia Inverlat Casa de Bolsa, S.A. de C.V, Grupo Financiero Scotiabank Inverlat, and Scotia Inverlat Derivados, S.A. de C.V., are each authorized and regulated by the Mexican financial authorities.
Not all products and services are offered in all jurisdictions. Services described are available in jurisdictions where permitted by law.