CANADA: NEW VEHICLE SALES HOLD STEADY IN Q1
Canadian auto sales marginally declined 0.1% month-over-month to 1.81 mn units at a seasonally adjusted annualized rate in March based on data from Omdia (chart 1). Upward revisions to data for January and February resulted in Q1 sales averaging 1.79 mn (SAAR) units, stronger than previously expected but still down 0.2% relative to Q4-2025. Non-seasonally adjusted sales reported by the same source for March were 170.6 k, down 7.8% year-over-year, albeit compared to a relatively strong start last year before newly imposed tariffs began to upend global trade. When comparing Q1 sales in NSA terms against the same period across recent years, sales were down 6.5% relative to 2025 and down 2.3% relative to 2024.

The recent decline in seasonally adjusted new vehicle sales may have bottomed out, as the selling rate over the past two months has increased in line with historical trends. However, only time will tell as there remains a host of competing factors that will impact demand. Canada’s overall employment level has contracted in January and February, while the unemployment rate trends sideways around 6.7% (3mma). Global oil prices remain elevated amid the conflict in the Middle East, which is widely expected to push up headline inflation, while the Bank of Canada will be looking for signs of risks that higher input costs are being passed through to core inflation. And while we estimate that higher oil prices are likely a small net positive to Canadian GDP growth, higher costs at the pump may weigh on vehicle demand in the near term. Meanwhile, the new federal Electric Vehicle Affordability Program may boost EV sales over the coming months.
Our outlook for Canadian light vehicle sales is 1.81 mn in 2026. We expect demand to gradually improve throughout this year and next, rising to 1.87 mn in 2027, albeit with larger uncertainty given elevated and volatile oil prices clouding the outlook.
UNITED STATES: MARGINAL DECLINE IN Q1 MASKS MONTHLY VOLATILITY
US auto sales increased 3.7% month-over-month to 16.3 mn units at a seasonally adjusted annualized rate in March, according to the BEA (chart 2). In Q1, sales averaged 15.6 mn (SAAR) units, down 0.5% relative to Q4 as the sales rate continues to pull back from the recent highs in 2025. Non-seasonally adjusted sales were 1.4 mn for March, down 11.9% year-over-year. Meanwhile, Q1 sales in NSA terms were down 5.3% and 0.6% when compared with the same quarter in 2025 and 2024 respectively.

US vehicle sales remain volatile from month-to-month, as headwinds weigh against durable improvement in the near term. Job growth in the US has improved since December, averaging 68 k (3mma), but it is uncertain as to whether it’s long lasting or a temporary increase, while the unemployment rate holds steady around 4.3%. At the same time, higher and more volatile oil prices risk adding upward pressure to core inflation. These factors could complicate the Federal Reserve’s task of bringing inflation from 2.5–3% back toward 2% while supporting maximum sustainable job growth. Meanwhile, recent changes to US tariffs on metals and pharmaceutical goods further reinforce uncertainty surrounding global trade amid the more protectionist US trade policy.
Our outlook for US auto sales is 15.7 mn units in 2026 with the sales rate trending sideways this year, and marginally improving to 15.8 mn in 2027 as expected interest rate relief and improving labour market dynamics support consumer demand but remains highly uncertain in the face of headwinds from elevated and volatile oil prices.
GLOBAL AUTO SALES: MONTHLY SALES IMPROVE AMID SOFT START TO YEAR
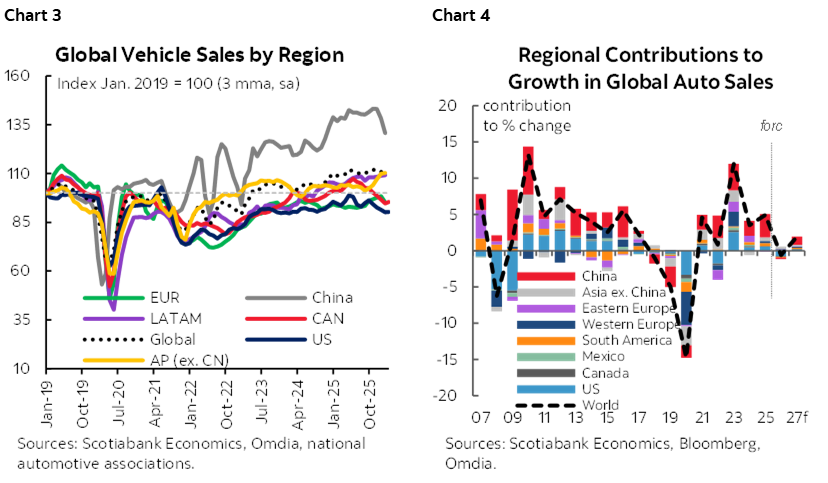
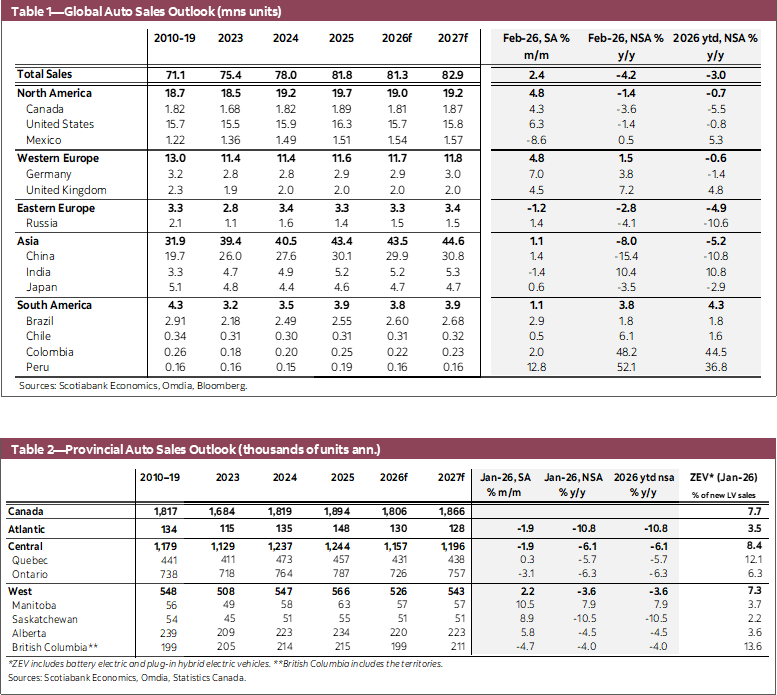
Global auto sales increased 2.4% month-over-month in February, the first seasonally adjusted increase since September (chart 3). The monthly increase was broad based across most of the major regional markets tracked but global sales remain soft relative to year-ago levels. In western Europe, auto sales increased 4.8% m/m (SA) in February as sales rebounded from the prior month’s lowest seasonally-adjusted level since September 2024, and February sales are up 1.5% y/y in non-seasonally adjusted terms. Meanwhile, in eastern Europe vehicle sales fell 1.2% m/m (SA) amid a soft start to the year with sales down 2.8% y/y (NSA). In the Asia Pacific region, auto sales increased 1.1% m/m (SA) but are 8% below the same month one year ago, weighed down by Chinese auto sales that are down 15.4% y/y (NSA) despite increasing 1.4% m/m (SA) in February. In Latin America, auto sales fell 1.8% m/m (SA) in February, continuing a general upward trend with the occasional monthly decline as sales in the region are up 3.8% y/y (NSA). Our outlook for global vehicle sales is a decline of 0.6% in 2026 before increasing 1.9% in 2027 but could face downside risk from the recent higher and more volatile oil prices (chart 4).
DISCLAIMER
This report has been prepared by Scotiabank Economics as a resource for the clients of Scotiabank. Opinions, estimates and projections contained herein are our own as of the date hereof and are subject to change without notice. The information and opinions contained herein have been compiled or arrived at from sources believed reliable but no representation or warranty, express or implied, is made as to their accuracy or completeness. Neither Scotiabank nor any of its officers, directors, partners, employees or affiliates accepts any liability whatsoever for any direct or consequential loss arising from any use of this report or its contents.
These reports are provided to you for informational purposes only. This report is not, and is not constructed as, an offer to sell or solicitation of any offer to buy any financial instrument, nor shall this report be construed as an opinion as to whether you should enter into any swap or trading strategy involving a swap or any other transaction. The information contained in this report is not intended to be, and does not constitute, a recommendation of a swap or trading strategy involving a swap within the meaning of U.S. Commodity Futures Trading Commission Regulation 23.434 and Appendix A thereto. This material is not intended to be individually tailored to your needs or characteristics and should not be viewed as a “call to action” or suggestion that you enter into a swap or trading strategy involving a swap or any other transaction. Scotiabank may engage in transactions in a manner inconsistent with the views discussed this report and may have positions, or be in the process of acquiring or disposing of positions, referred to in this report.
Scotiabank, its affiliates and any of their respective officers, directors and employees may from time to time take positions in currencies, act as managers, co-managers or underwriters of a public offering or act as principals or agents, deal in, own or act as market makers or advisors, brokers or commercial and/or investment bankers in relation to securities or related derivatives. As a result of these actions, Scotiabank may receive remuneration. All Scotiabank products and services are subject to the terms of applicable agreements and local regulations. Officers, directors and employees of Scotiabank and its affiliates may serve as directors of corporations.
Any securities discussed in this report may not be suitable for all investors. Scotiabank recommends that investors independently evaluate any issuer and security discussed in this report, and consult with any advisors they deem necessary prior to making any investment.
This report and all information, opinions and conclusions contained in it are protected by copyright. This information may not be reproduced without the prior express written consent of Scotiabank.
™ Trademark of The Bank of Nova Scotia. Used under license, where applicable.
Scotiabank, together with “Global Banking and Markets”, is a marketing name for the global corporate and investment banking and capital markets businesses of The Bank of Nova Scotia and certain of its affiliates in the countries where they operate, including; Scotiabank Europe plc; Scotiabank (Ireland) Designated Activity Company; Scotiabank Inverlat S.A., Institución de Banca Múltiple, Grupo Financiero Scotiabank Inverlat, Scotia Inverlat Casa de Bolsa, S.A. de C.V., Grupo Financiero Scotiabank Inverlat, Scotia Inverlat Derivados S.A. de C.V. – all members of the Scotiabank group and authorized users of the Scotiabank mark. The Bank of Nova Scotia is incorporated in Canada with limited liability and is authorised and regulated by the Office of the Superintendent of Financial Institutions Canada. The Bank of Nova Scotia is authorized by the UK Prudential Regulation Authority and is subject to regulation by the UK Financial Conduct Authority and limited regulation by the UK Prudential Regulation Authority. Details about the extent of The Bank of Nova Scotia's regulation by the UK Prudential Regulation Authority are available from us on request. Scotiabank Europe plc is authorized by the UK Prudential Regulation Authority and regulated by the UK Financial Conduct Authority and the UK Prudential Regulation Authority.
Scotiabank Inverlat, S.A., Scotia Inverlat Casa de Bolsa, S.A. de C.V, Grupo Financiero Scotiabank Inverlat, and Scotia Inverlat Derivados, S.A. de C.V., are each authorized and regulated by the Mexican financial authorities.
Not all products and services are offered in all jurisdictions. Services described are available in jurisdictions where permitted by law.